| Param | Original file | Final file |
|---|---|---|
| Filename | modeM0/AS1A14_070T08_9000006568_57228cztM0_level2.fits | modeM0/AS1A14_070T08_9000006568_57228cztM0_level2_quad_clean.evt |
| Size (bytes) | 1,677,216,960 | 353,632,320 |
| Size | 1.6 GB | 337.3 MB |
| Events in quadrant A | 10,604,443 | 2,356,308 |
| Events in quadrant B | 12,755,572 | 2,494,697 |
| Events in quadrant C | 24,532,919 | 2,010,175 |
| Events in quadrant D | 12,249,323 | 2,119,633 |
| Mode M9 | |||
|---|---|---|---|
| Quadrant | BADHDUFLAG | Total packets | Discarded packets |
| A | 0 | 17 | 0 |
| B | 0 | 17 | 0 |
| C | 0 | 17 | 0 |
| D | 0 | 17 | 0 |
| Mode SS | |||
|---|---|---|---|
| Quadrant | BADHDUFLAG | Total packets | Discarded packets |
| A | 0 | 508 | 0 |
| B | 0 | 508 | 0 |
| C | 0 | 508 | 0 |
| D | 0 | 508 | 0 |
| Mode M0 | |||
|---|---|---|---|
| Quadrant | BADHDUFLAG | Total packets | Discarded packets |
| A | 0 | 51079 | 3 |
| B | 0 | 56156 | 3 |
| C | 0 | 90603 | 3 |
| D | 0 | 54936 | 3 |
| Quadrant | Total seconds | Saturated seconds | Saturation percentage |
|---|---|---|---|
| A | 25092 | 320 | 1.275307% |
| B | 25093 | 857 | 3.415295% |
| C | 25093 | 3751 | 14.948392% |
| D | 25093 | 420 | 1.673774% |
Noise dominated data is calculated using 1-second bins in cleaned event files. If a bin has >2000 counts, and if more than 50% of those come from <1% of pixels, then it is considered to be noise-dominated and hence unusable.
| Quadrant | # 1 sec bins | Bins with >0 counts | Bins with >2000 counts | High rate bins dominated by noise | Noise dominated (total time) | Noise dominated (detector-on time) | Marked lightcurve |
|---|---|---|---|---|---|---|---|
| A | 26657 | 25096 | 14 | 14 | 0.05% | 0.06% | 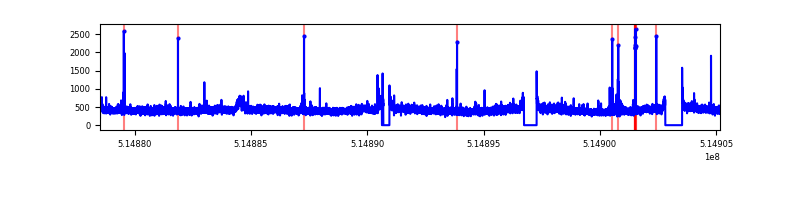 |
| B | 26658 | 25097 | 255 | 255 | 0.96% | 1.02% | 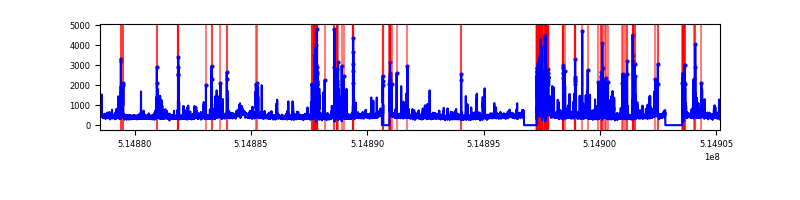 |
| C | 26658 | 25097 | 2674 | 2674 | 10.03% | 10.65% | 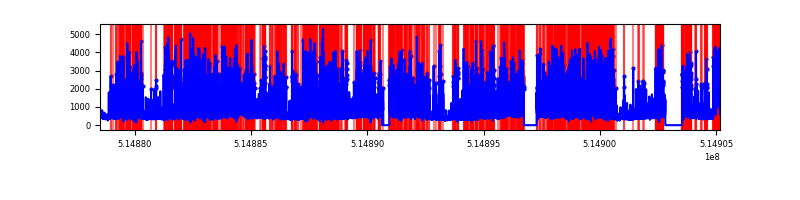 |
| D | 26658 | 25097 | 177 | 177 | 0.66% | 0.71% | 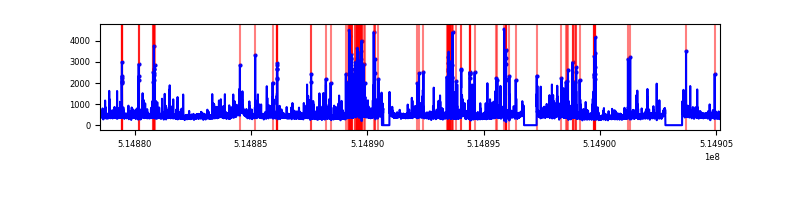 |
Top three noisy pixels from each quadrant. If the there are fewer than three noisy pixels in the level2.evt file, extra rows are filled as -1
| Pixel properties | Quadrant properties | ||||||
|---|---|---|---|---|---|---|---|
| Quadrant | DetID | PixID | Counts | Sigma | Mean | Median | Sigma |
| A | 10 | 251 | 53898 | 77.45 | 2691 | 2617 | 662.1 |
| A | 13 | 254 | 39327 | 55.45 | 2691 | 2617 | 662.1 |
| A | 3 | 14 | 36373 | 50.98 | 2691 | 2617 | 662.1 |
| B | 10 | 16 | 878692 | 1571.62 | 2627 | 2519 | 557.5 |
| B | 5 | 185 | 374847 | 667.86 | 2627 | 2519 | 557.5 |
| B | 4 | 201 | 330799 | 588.85 | 2627 | 2519 | 557.5 |
| C | 15 | 224 | 10437605 | 15629.01 | 2465 | 2437 | 667.7 |
| C | 12 | 254 | 3573496 | 5348.47 | 2465 | 2437 | 667.7 |
| C | 12 | 252 | 323479 | 480.83 | 2465 | 2437 | 667.7 |
| D | 3 | 12 | 768388 | 1047.39 | 2606 | 2494 | 731.2 |
| D | 5 | 173 | 207484 | 280.33 | 2606 | 2494 | 731.2 |
| D | 2 | 31 | 170645 | 229.95 | 2606 | 2494 | 731.2 |
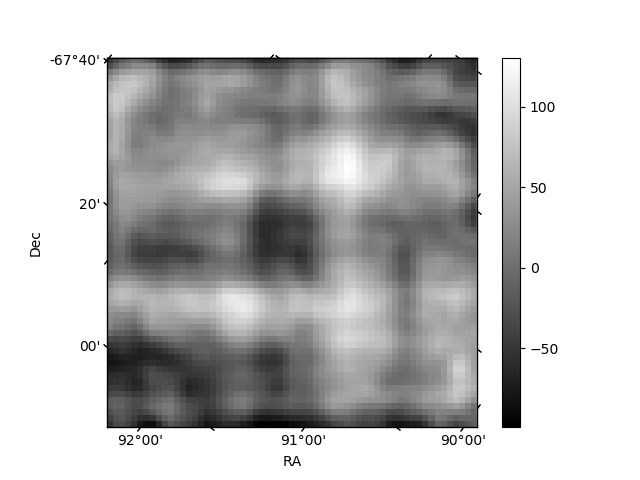
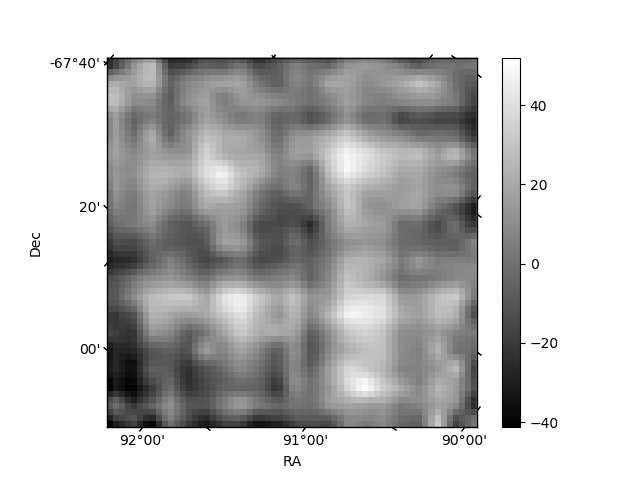
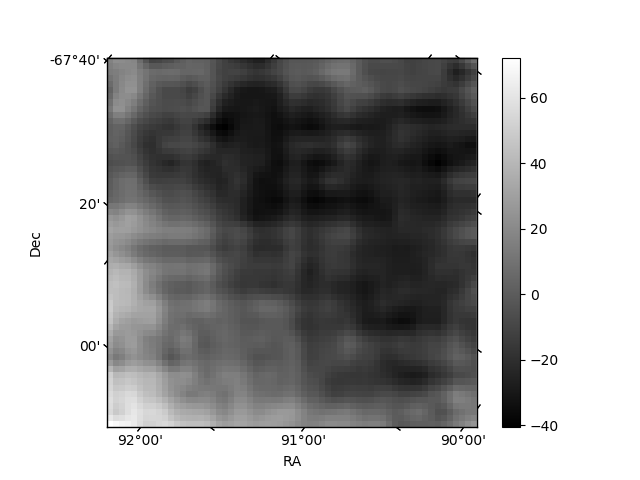
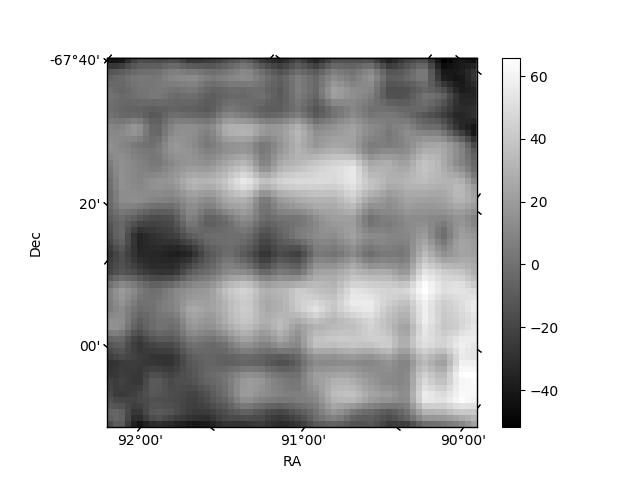
Histogram calculated using DETX and DETY for each event in the final _common_clean file
| Quadrant A | 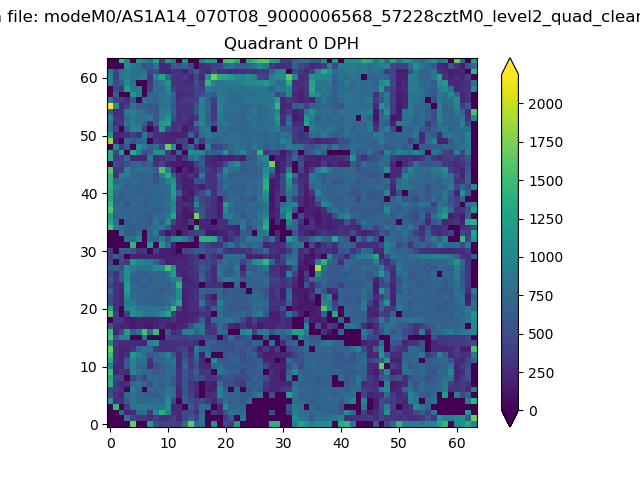 |
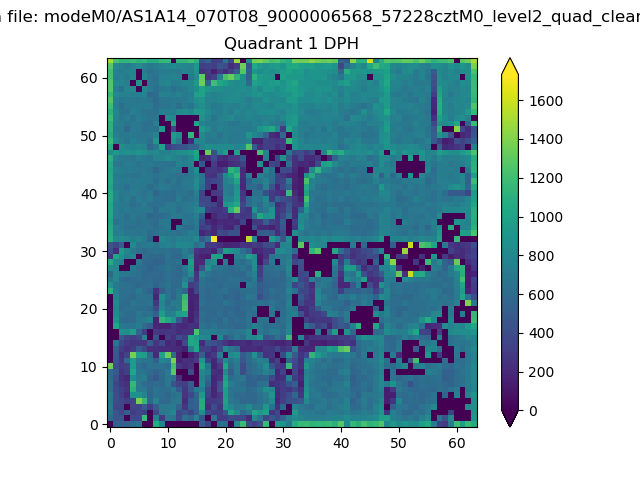 |
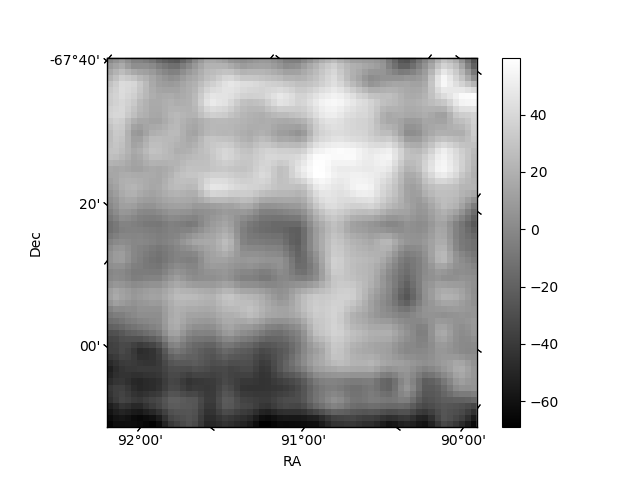
Quadrant B |
|---|---|---|---|
| Quadrant D | 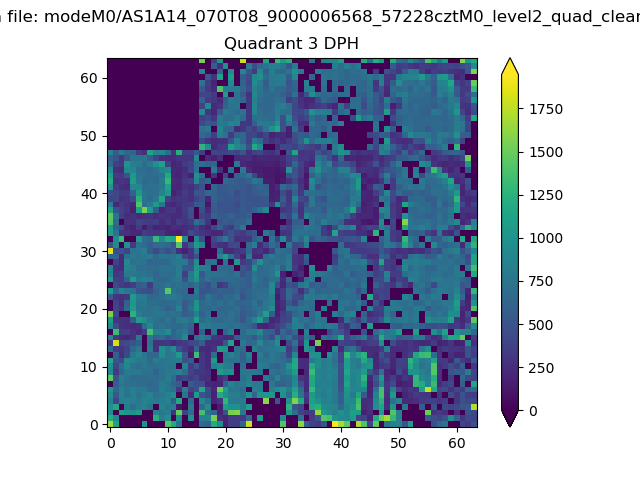 |
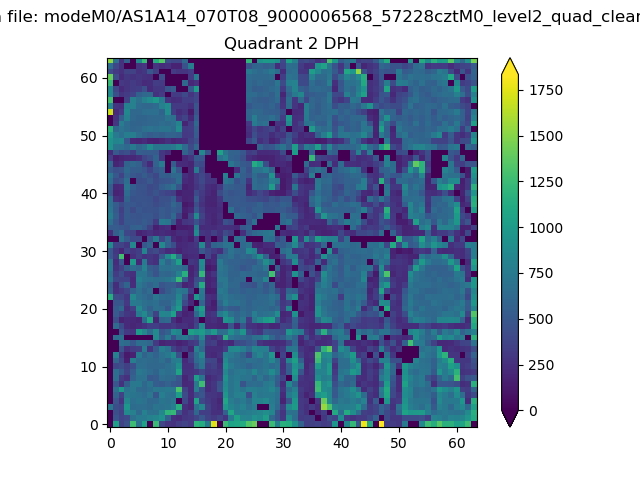 |
Quadrant C |
| Plot type | Count rate plots | Images |
|---|---|---|
| Comparison with Poisson distribution Blue bars denote a histogram of data divided into 1 sec bins. Red curve is a Poisson curve with rate = median count rate of data. |
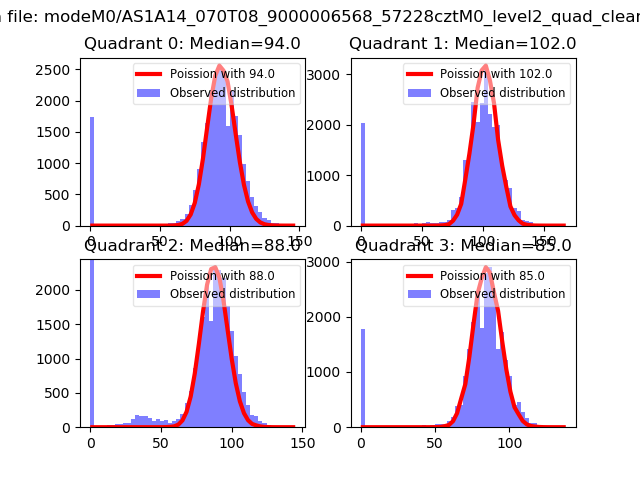 |
 |
| Quadrant-wise count rates Data is divided into 100 sec bins |
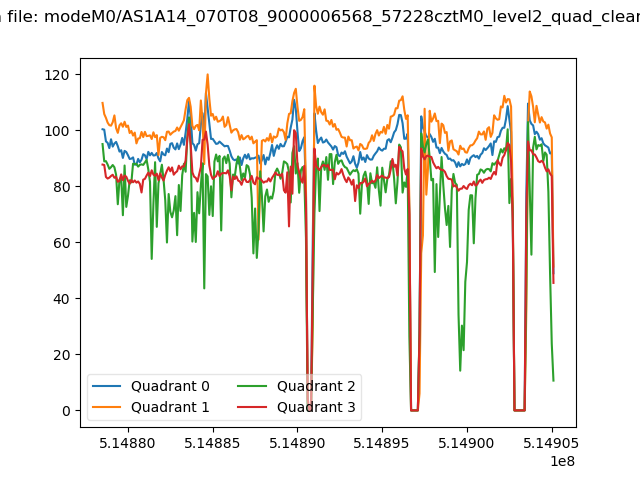 |
|
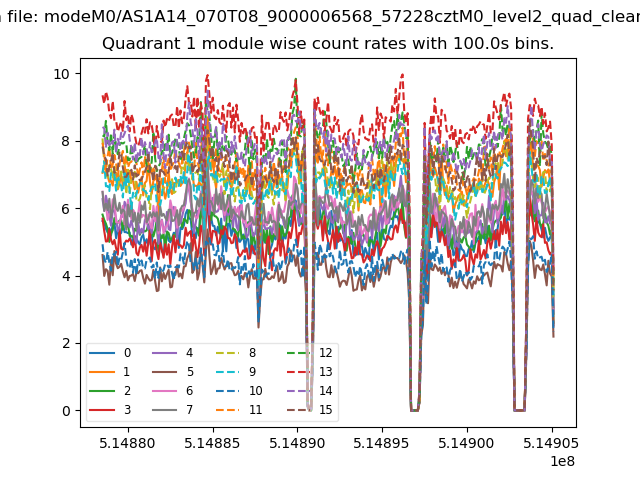
| Module-wise count rates for Quadrant A Data is divided into 100 sec bins |
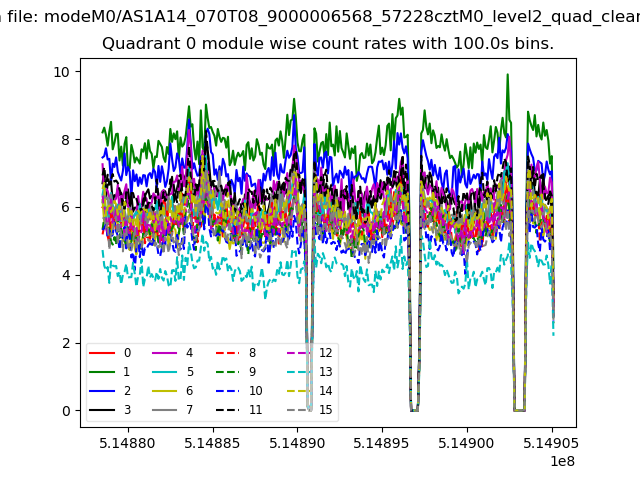 |
 |
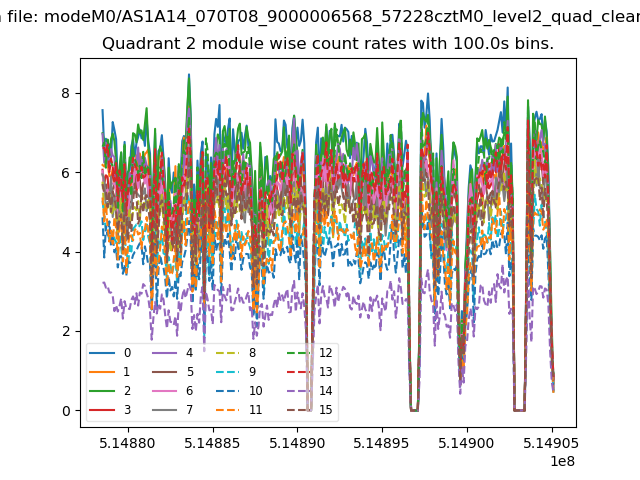
| Module-wise count rates for Quadrant B Data is divided into 100 sec bins |
 |
 |
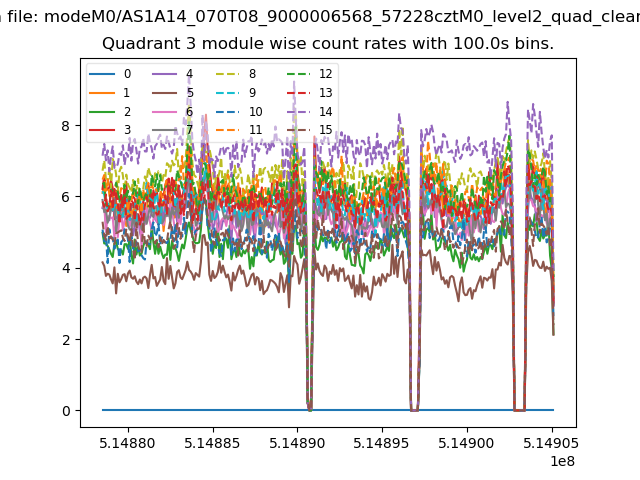
| Module-wise count rates for Quadrant C Data is divided into 100 sec bins |
 |
 |
| Module-wise count rates for Quadrant D Data is divided into 100 sec bins |
 |
 |
| Parameter | Plot |
|---|---|
| CZT HV Monitor | 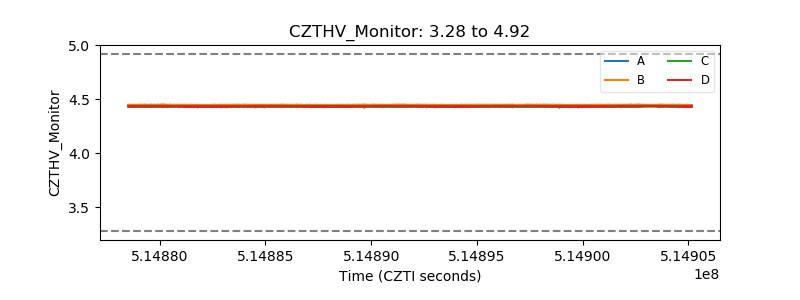 |
| D_VDD | 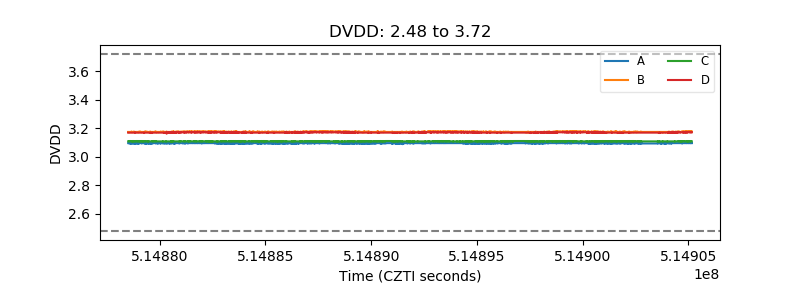 |
| Temperature 1 | 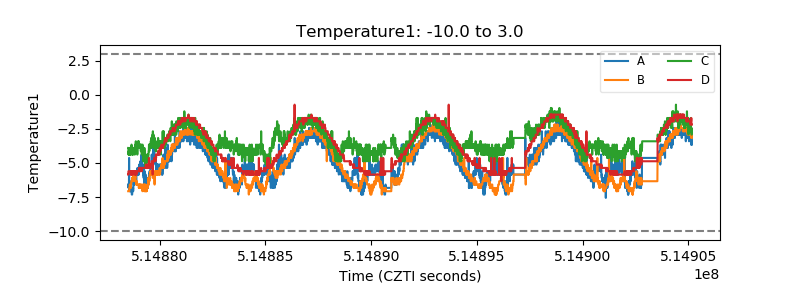 |
| Veto HV Monitor | 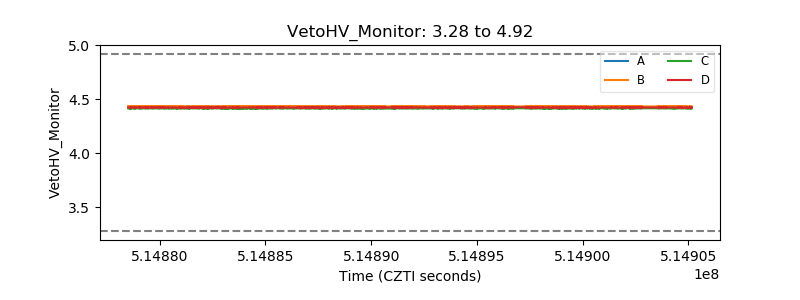 |
| Veto LLD | 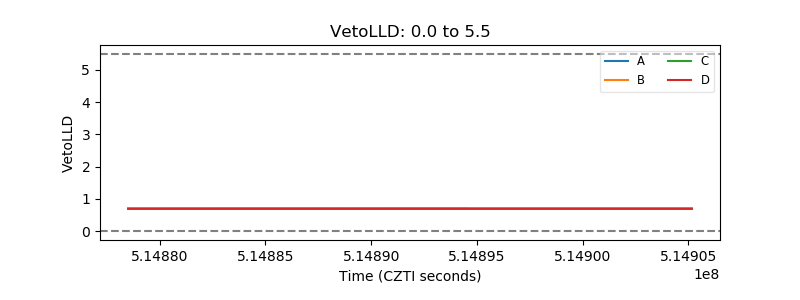 |
| Alpha Counter | 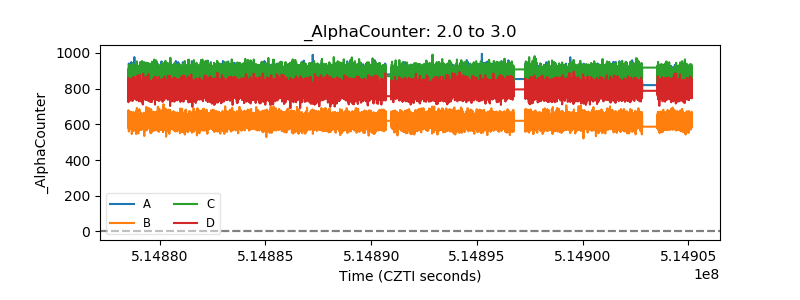 |
| _CPM_Rate | 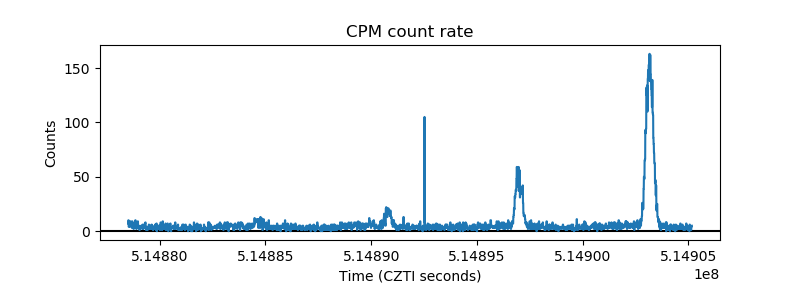 |
| CZT Counter | 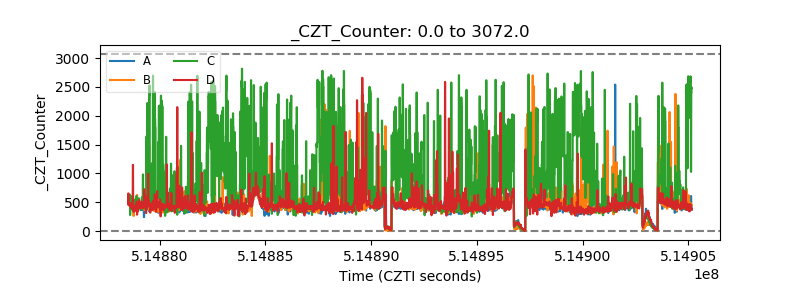 |
| +2.5 Volts monitor | 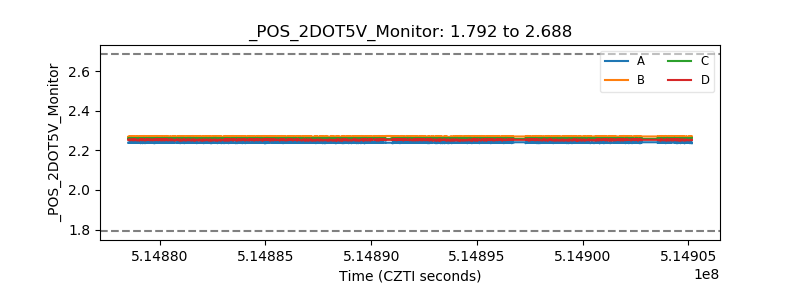 |
| +5 Volts monitor |  |
| _ROLL_ROT | 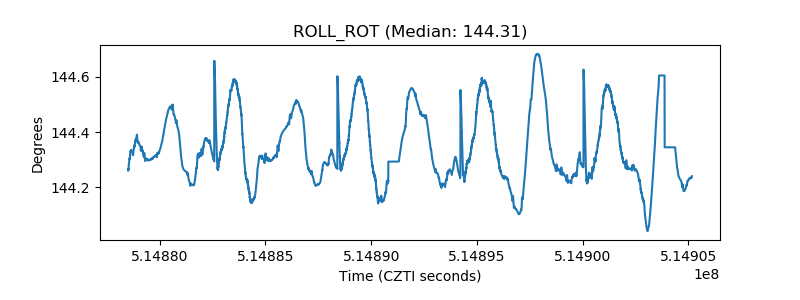 |
| _Roll_DEC | 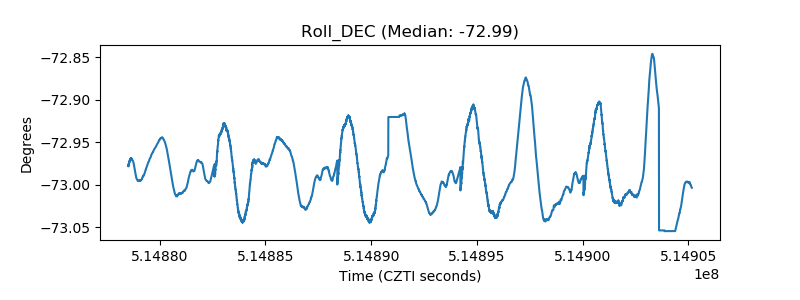 |
| _Roll_RA | 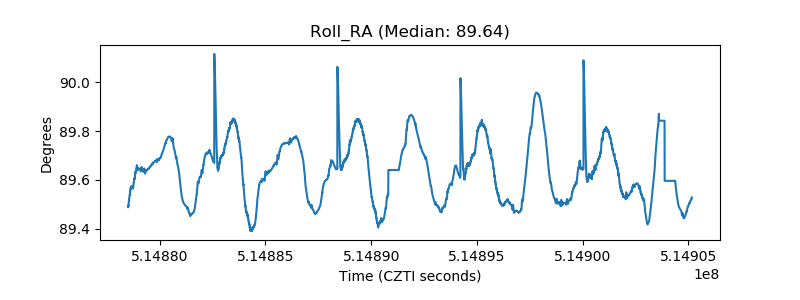 |
| Veto Counter | 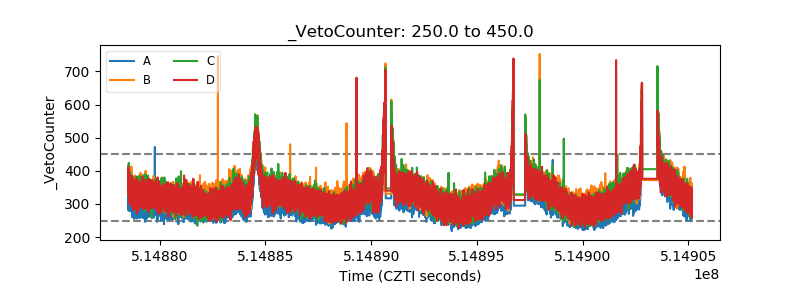 |