| Param | Original file | Final file |
|---|---|---|
| Filename | modeM0/AS1A14_070T08_9000006568_57229cztM0_level2.fits | modeM0/AS1A14_070T08_9000006568_57229cztM0_level2_quad_clean.evt |
| Size (bytes) | 386,303,040 | 85,561,920 |
| Size | 368.4 MB | 81.6 MB |
| Events in quadrant A | 2,847,283 | 565,832 |
| Events in quadrant B | 2,953,442 | 599,992 |
| Events in quadrant C | 5,311,039 | 494,497 |
| Events in quadrant D | 2,722,390 | 512,866 |
| Mode M9 | |||
|---|---|---|---|
| Quadrant | BADHDUFLAG | Total packets | Discarded packets |
| A | 0 | 9 | 0 |
| B | 0 | 9 | 0 |
| C | 0 | 9 | 0 |
| D | 0 | 9 | 0 |
| Mode SS | |||
|---|---|---|---|
| Quadrant | BADHDUFLAG | Total packets | Discarded packets |
| A | 0 | 122 | 0 |
| B | 0 | 122 | 0 |
| C | 0 | 122 | 0 |
| D | 0 | 122 | 0 |
| Mode M0 | |||
|---|---|---|---|
| Quadrant | BADHDUFLAG | Total packets | Discarded packets |
| A | 0 | 12961 | 1 |
| B | 0 | 13091 | 1 |
| C | 0 | 20063 | 2 |
| D | 0 | 12633 | 1 |
| Quadrant | Total seconds | Saturated seconds | Saturation percentage |
|---|---|---|---|
| A | 5975 | 107 | 1.790795% |
| B | 5976 | 127 | 2.125167% |
| C | 5975 | 702 | 11.748954% |
| D | 5975 | 44 | 0.736402% |
Noise dominated data is calculated using 1-second bins in cleaned event files. If a bin has >2000 counts, and if more than 50% of those come from <1% of pixels, then it is considered to be noise-dominated and hence unusable.
| Quadrant | # 1 sec bins | Bins with >0 counts | Bins with >2000 counts | High rate bins dominated by noise | Noise dominated (total time) | Noise dominated (detector-on time) | Marked lightcurve |
|---|---|---|---|---|---|---|---|
| A | 6885 | 5976 | 49 | 49 | 0.71% | 0.82% | 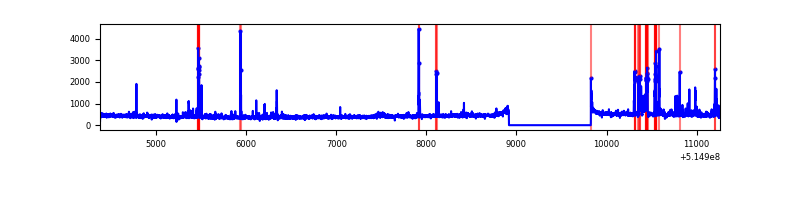 |
| B | 6886 | 5977 | 45 | 45 | 0.65% | 0.75% | 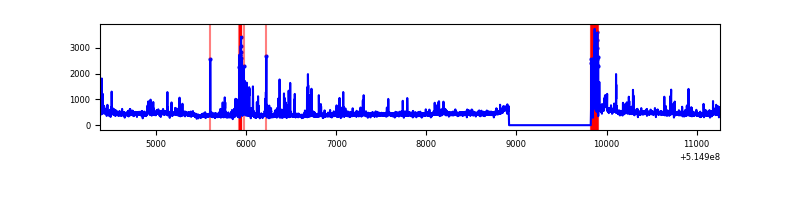 |
| C | 6885 | 5976 | 561 | 561 | 8.15% | 9.39% | 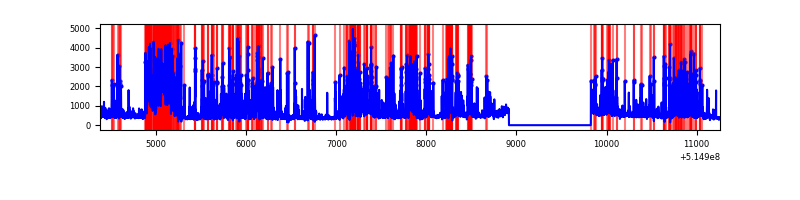 |
| D | 6885 | 5976 | 21 | 21 | 0.31% | 0.35% | 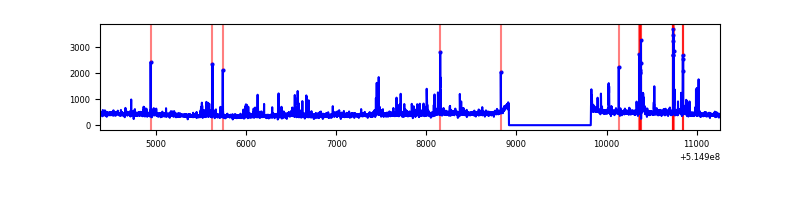 |
Top three noisy pixels from each quadrant. If the there are fewer than three noisy pixels in the level2.evt file, extra rows are filled as -1
| Pixel properties | Quadrant properties | ||||||
|---|---|---|---|---|---|---|---|
| Quadrant | DetID | PixID | Counts | Sigma | Mean | Median | Sigma |
| A | 7 | 64 | 220433 | 1408.36 | 632 | 617 | 156.1 |
| A | 13 | 248 | 73156 | 464.76 | 632 | 617 | 156.1 |
| A | 10 | 251 | 34574 | 217.56 | 632 | 617 | 156.1 |
| B | 10 | 16 | 131410 | 977.15 | 616 | 593 | 133.9 |
| B | 10 | 247 | 75349 | 558.4 | 616 | 593 | 133.9 |
| B | 1 | 238 | 53009 | 391.53 | 616 | 593 | 133.9 |
| C | 15 | 224 | 2961154 | 18422.33 | 580 | 572 | 160.7 |
| C | 12 | 252 | 40553 | 248.78 | 580 | 572 | 160.7 |
| C | 14 | 246 | 17036 | 102.44 | 580 | 572 | 160.7 |
| D | 8 | 240 | 108170 | 623.2 | 608 | 581 | 172.6 |
| D | 7 | 96 | 65214 | 374.38 | 608 | 581 | 172.6 |
| D | 5 | 173 | 43202 | 246.88 | 608 | 581 | 172.6 |
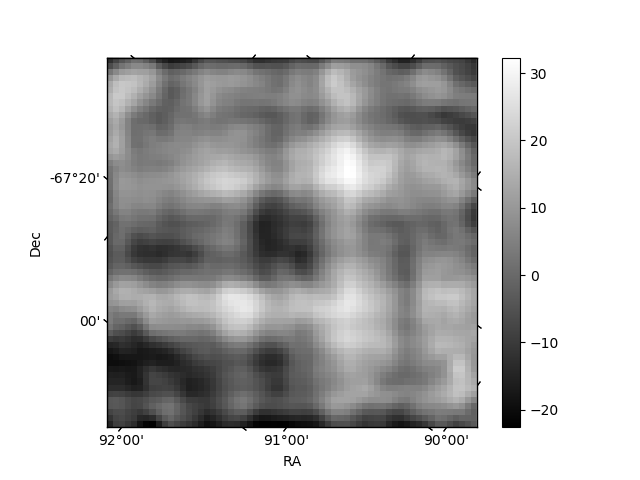
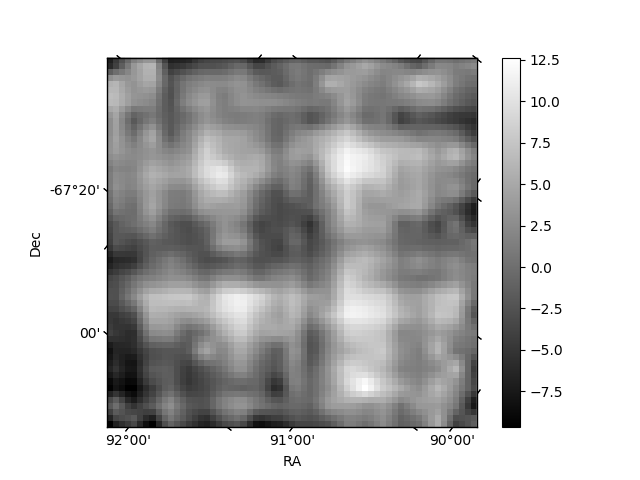
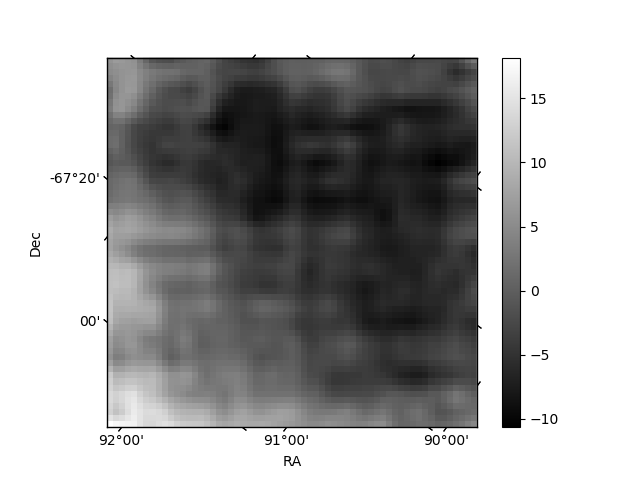
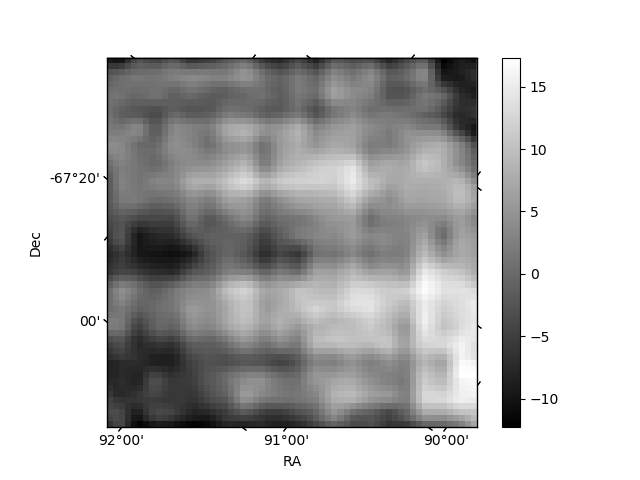
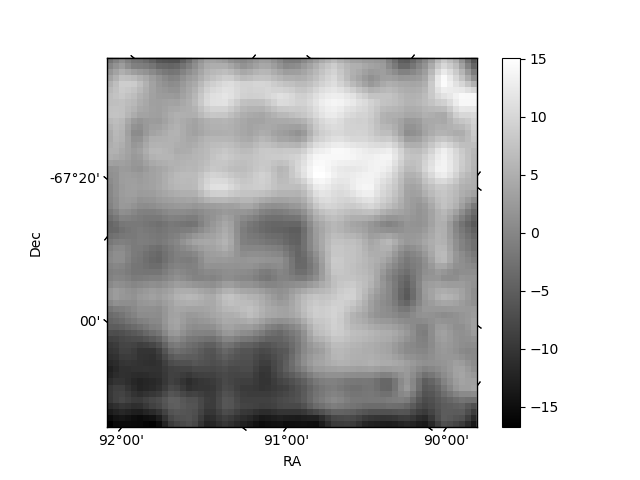
Histogram calculated using DETX and DETY for each event in the final _common_clean file
| Quadrant A | 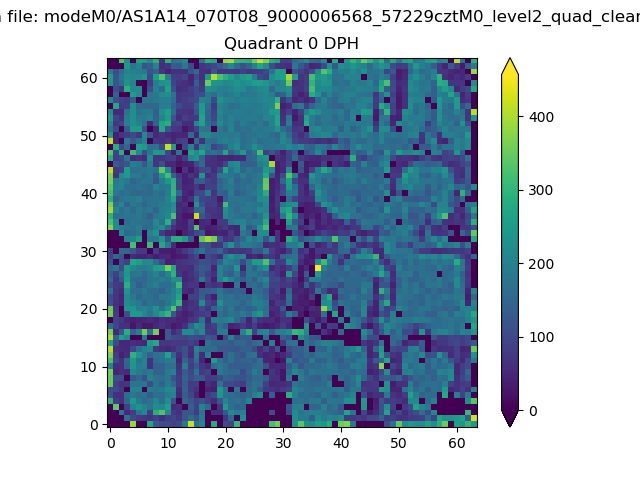 |
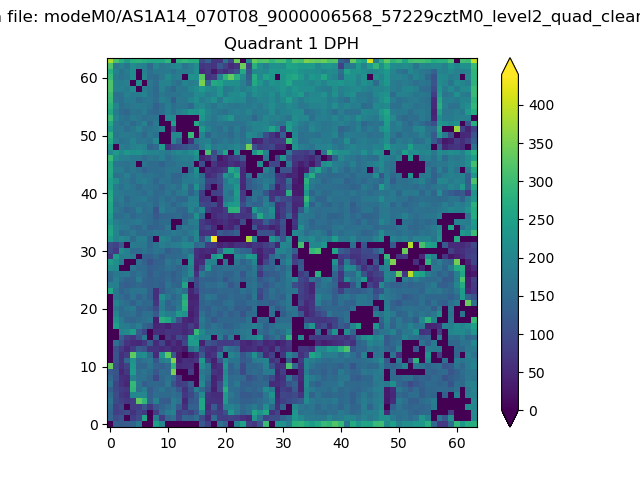 |
Quadrant B |
|---|---|---|---|
| Quadrant D | 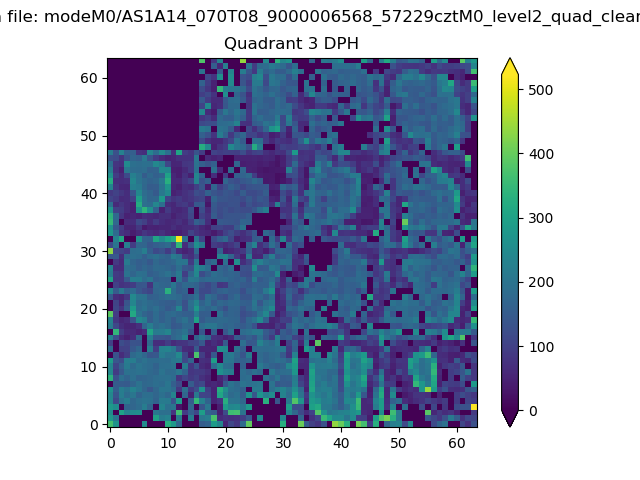 |
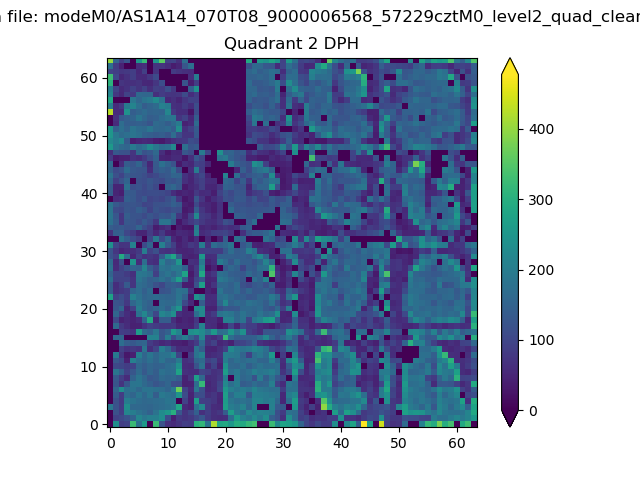 |
Quadrant C |
| Plot type | Count rate plots | Images |
|---|---|---|
| Comparison with Poisson distribution Blue bars denote a histogram of data divided into 1 sec bins. Red curve is a Poisson curve with rate = median count rate of data. |
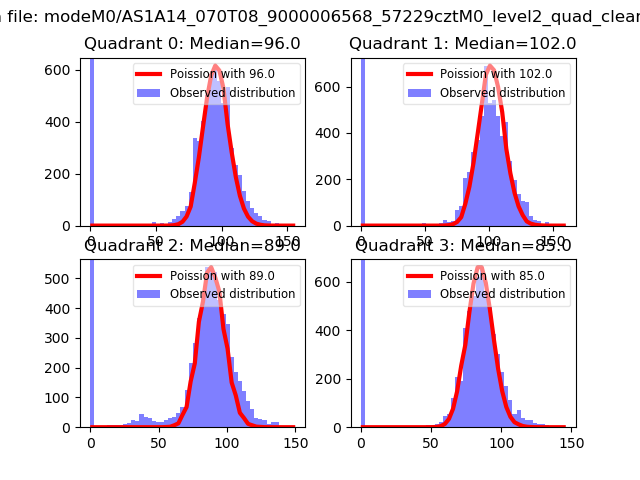 |
 |
| Quadrant-wise count rates Data is divided into 100 sec bins |
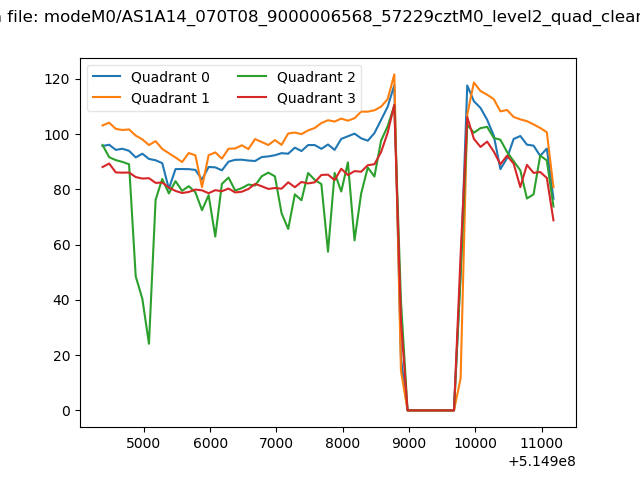 |
|
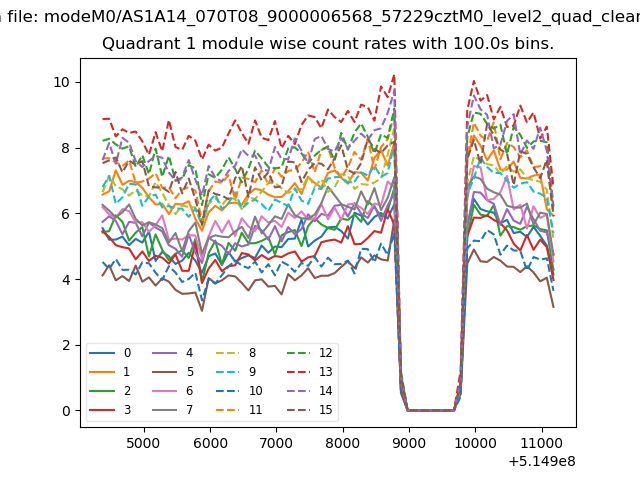
| Module-wise count rates for Quadrant A Data is divided into 100 sec bins |
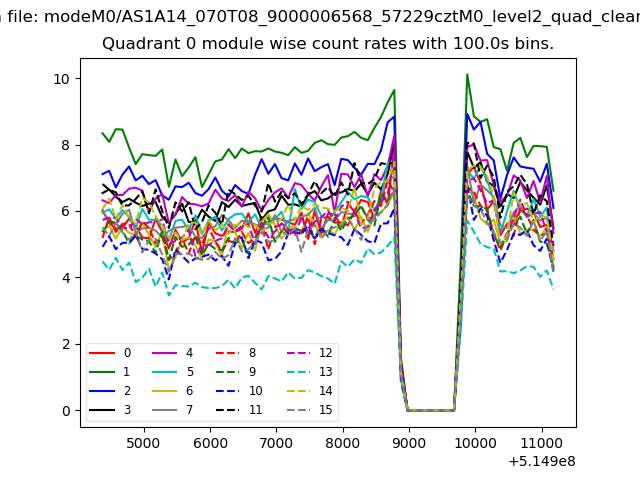 |
 |
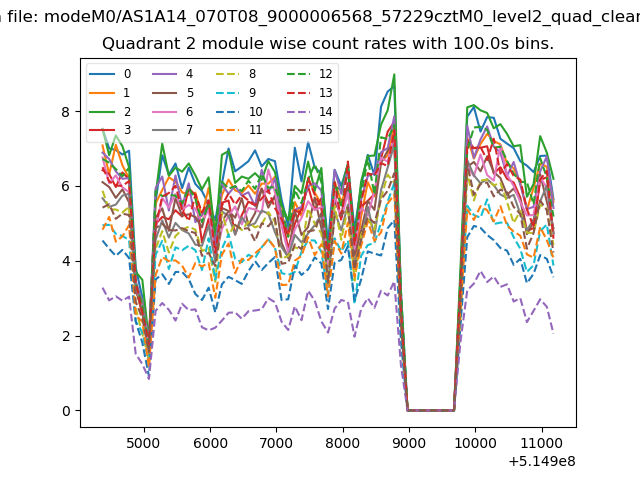
| Module-wise count rates for Quadrant B Data is divided into 100 sec bins |
 |
 |
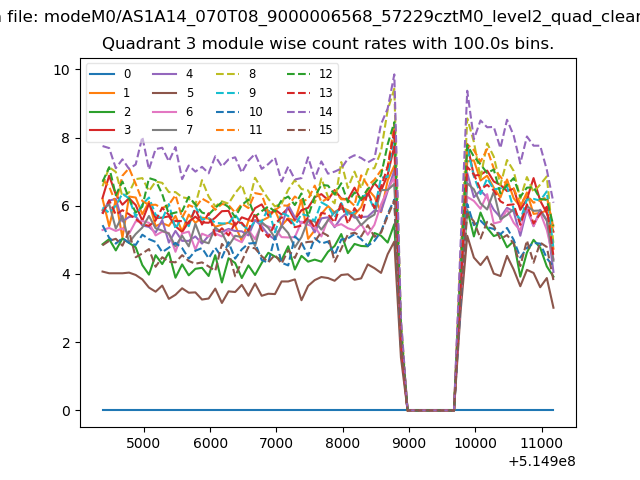
| Module-wise count rates for Quadrant C Data is divided into 100 sec bins |
 |
 |
| Module-wise count rates for Quadrant D Data is divided into 100 sec bins |
 |
 |
| Parameter | Plot |
|---|---|
| CZT HV Monitor | 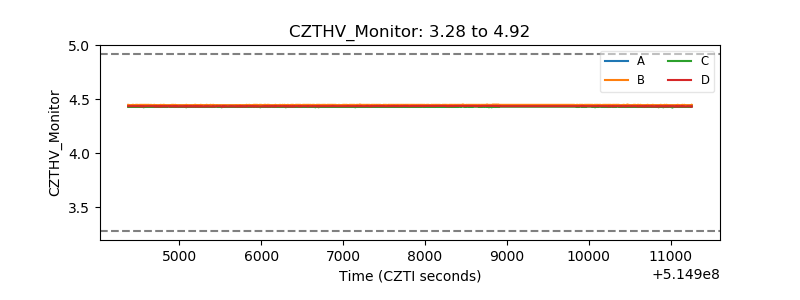 |
| D_VDD | 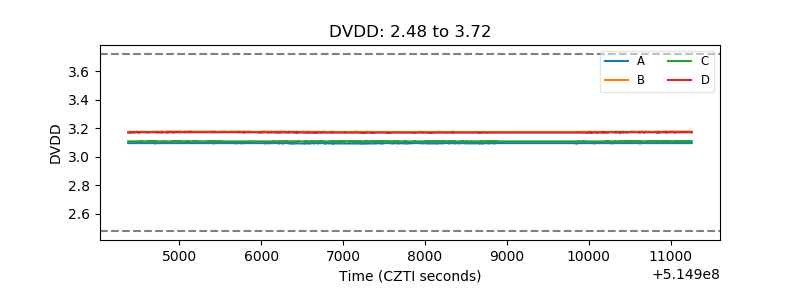 |
| Temperature 1 | 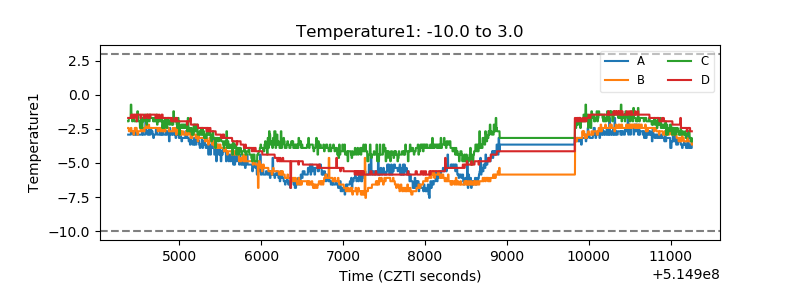 |
| Veto HV Monitor | 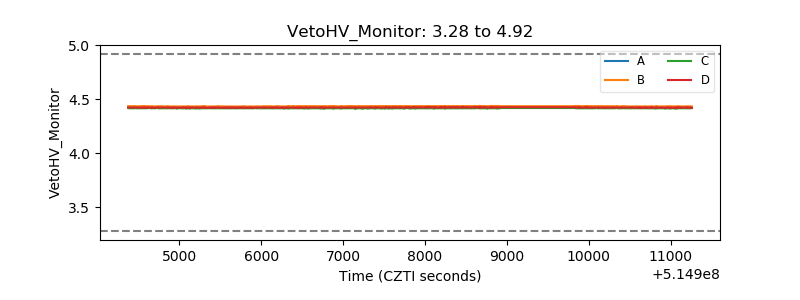 |
| Veto LLD | 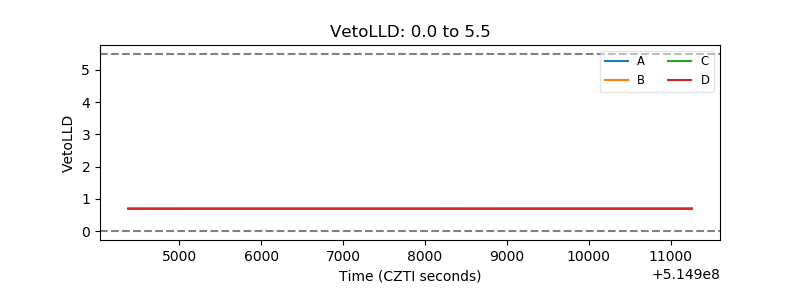 |
| Alpha Counter | 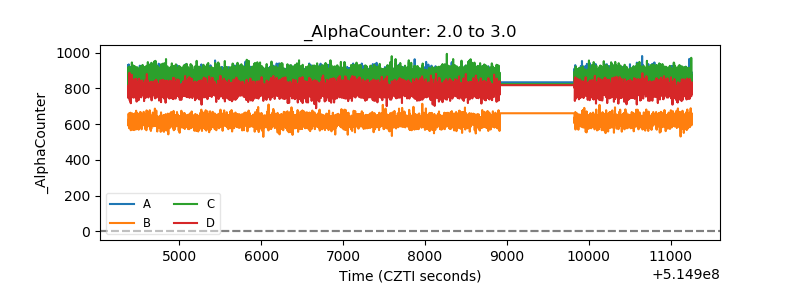 |
| _CPM_Rate | 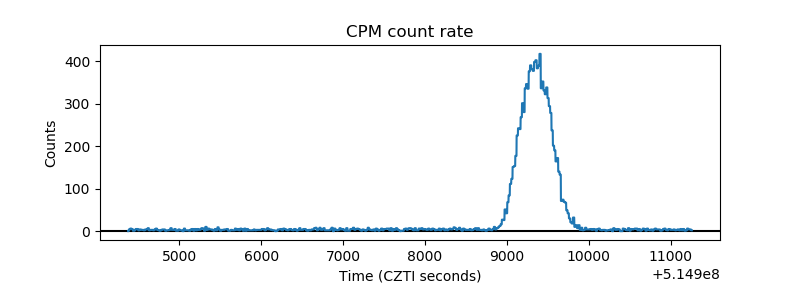 |
| CZT Counter | 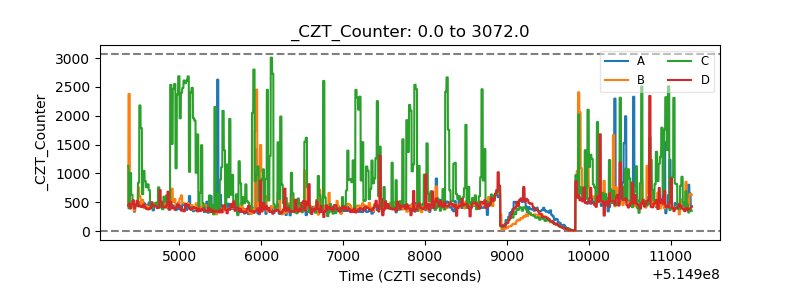 |
| +2.5 Volts monitor | 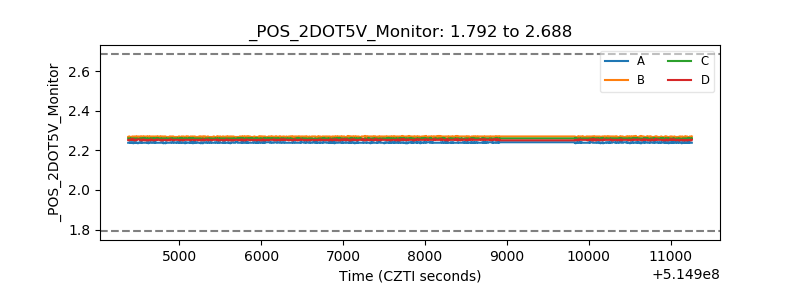 |
| +5 Volts monitor | 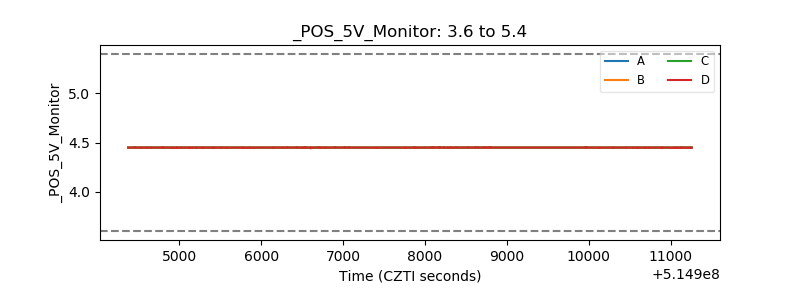 |
| _ROLL_ROT | 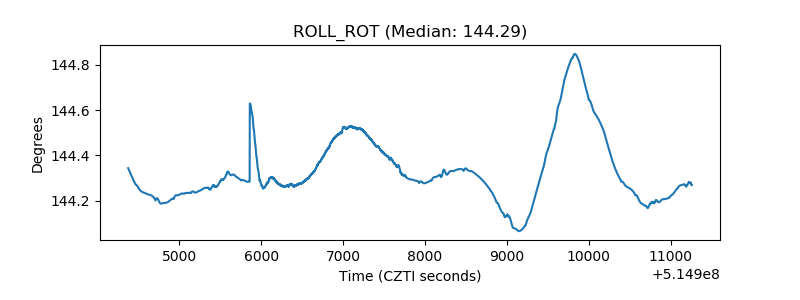 |
| _Roll_DEC | 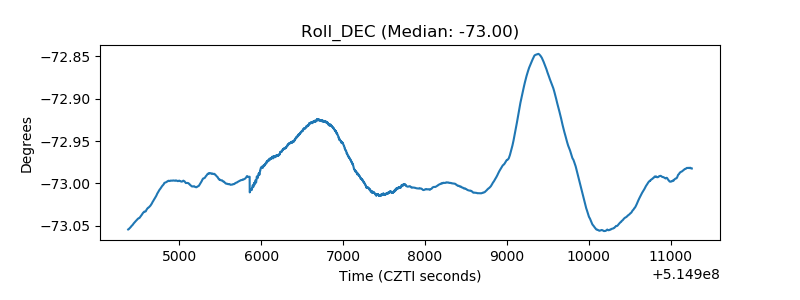 |
| _Roll_RA | 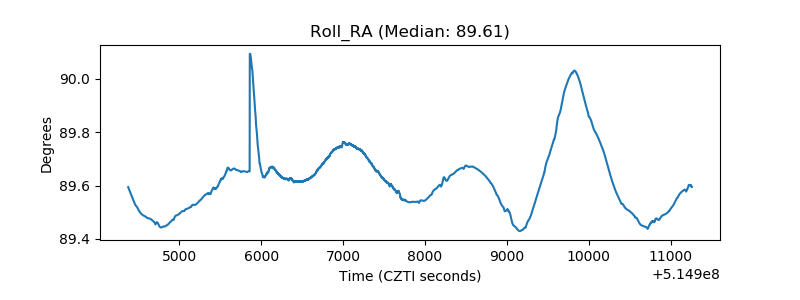 |
| Veto Counter | 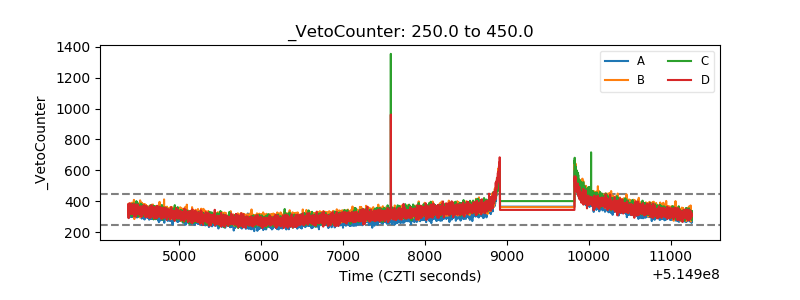 |