| Param | Original file | Final file |
|---|---|---|
| Filename | modeM0/AS1A14_070T08_9000006568_57231cztM0_level2.fits | modeM0/AS1A14_070T08_9000006568_57231cztM0_level2_quad_clean.evt |
| Size (bytes) | 474,672,960 | 94,199,040 |
| Size | 452.7 MB | 89.8 MB |
| Events in quadrant A | 3,996,852 | 615,388 |
| Events in quadrant B | 3,622,479 | 672,628 |
| Events in quadrant C | 5,740,701 | 553,847 |
| Events in quadrant D | 3,701,961 | 554,089 |
| Mode M9 | |||
|---|---|---|---|
| Quadrant | BADHDUFLAG | Total packets | Discarded packets |
| A | 0 | 11 | 0 |
| B | 0 | 11 | 0 |
| C | 0 | 11 | 0 |
| D | 0 | 11 | 0 |
| Mode SS | |||
|---|---|---|---|
| Quadrant | BADHDUFLAG | Total packets | Discarded packets |
| A | 0 | 132 | 0 |
| B | 0 | 132 | 0 |
| C | 0 | 132 | 0 |
| D | 0 | 132 | 0 |
| Mode M0 | |||
|---|---|---|---|
| Quadrant | BADHDUFLAG | Total packets | Discarded packets |
| A | 0 | 16542 | 2 |
| B | 0 | 15466 | 2 |
| C | 0 | 21708 | 2 |
| D | 0 | 15852 | 2 |
| Quadrant | Total seconds | Saturated seconds | Saturation percentage |
|---|---|---|---|
| A | 6543 | 361 | 5.517347% |
| B | 6544 | 221 | 3.377139% |
| C | 6544 | 747 | 11.415037% |
| D | 6544 | 269 | 4.110636% |
Noise dominated data is calculated using 1-second bins in cleaned event files. If a bin has >2000 counts, and if more than 50% of those come from <1% of pixels, then it is considered to be noise-dominated and hence unusable.
| Quadrant | # 1 sec bins | Bins with >0 counts | Bins with >2000 counts | High rate bins dominated by noise | Noise dominated (total time) | Noise dominated (detector-on time) | Marked lightcurve |
|---|---|---|---|---|---|---|---|
| A | 7588 | 6544 | 266 | 266 | 3.51% | 4.06% | 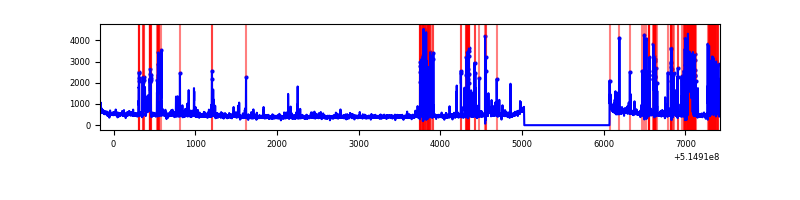 |
| B | 7589 | 6545 | 101 | 101 | 1.33% | 1.54% |  |
| C | 7589 | 6545 | 605 | 605 | 7.97% | 9.24% | 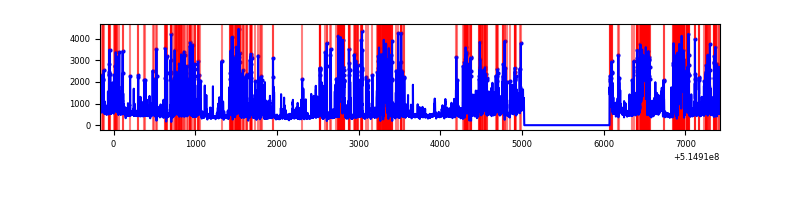 |
| D | 7589 | 6545 | 243 | 243 | 3.20% | 3.71% | 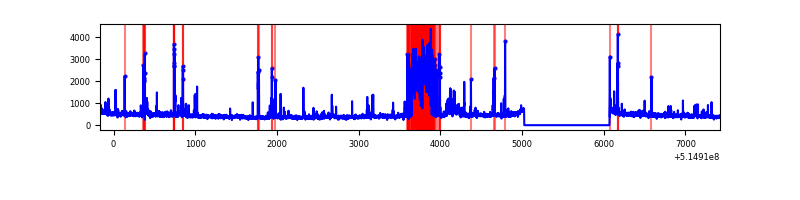 |
Top three noisy pixels from each quadrant. If the there are fewer than three noisy pixels in the level2.evt file, extra rows are filled as -1
| Pixel properties | Quadrant properties | ||||||
|---|---|---|---|---|---|---|---|
| Quadrant | DetID | PixID | Counts | Sigma | Mean | Median | Sigma |
| A | 4 | 13 | 758542 | 4390.25 | 696 | 678 | 172.6 |
| A | 7 | 64 | 331730 | 1917.76 | 696 | 678 | 172.6 |
| A | 3 | 14 | 69138 | 396.58 | 696 | 678 | 172.6 |
| B | 10 | 16 | 339573 | 2310.78 | 689 | 663 | 146.7 |
| B | 10 | 247 | 111973 | 758.94 | 689 | 663 | 146.7 |
| B | 5 | 185 | 79439 | 537.12 | 689 | 663 | 146.7 |
| C | 15 | 224 | 2939753 | 16589.72 | 646 | 640 | 177.2 |
| C | 7 | 112 | 115541 | 648.55 | 646 | 640 | 177.2 |
| C | 14 | 67 | 67913 | 379.72 | 646 | 640 | 177.2 |
| D | 12 | 128 | 677831 | 3556.59 | 669 | 637 | 190.4 |
| D | 8 | 240 | 86468 | 450.78 | 669 | 637 | 190.4 |
| D | 7 | 96 | 82839 | 431.72 | 669 | 637 | 190.4 |
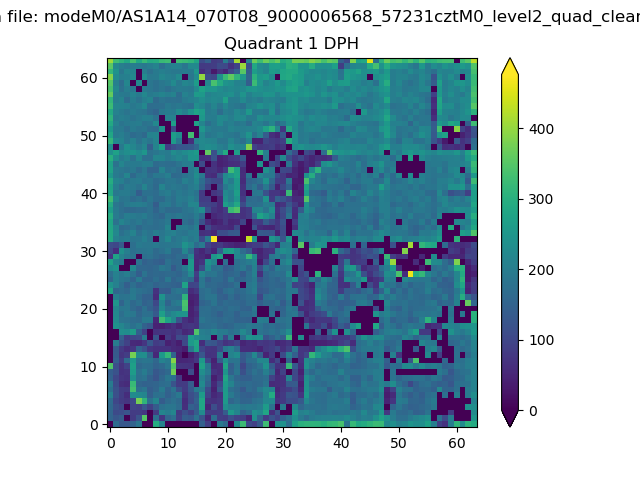
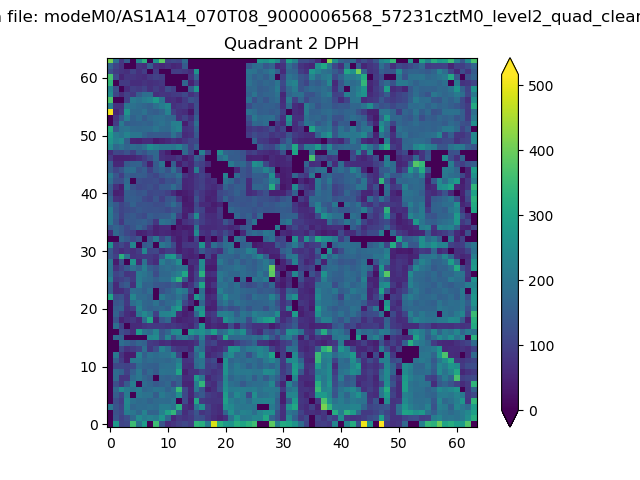
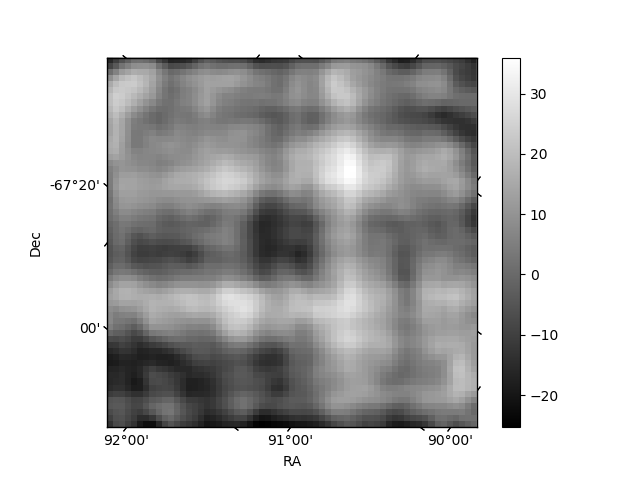
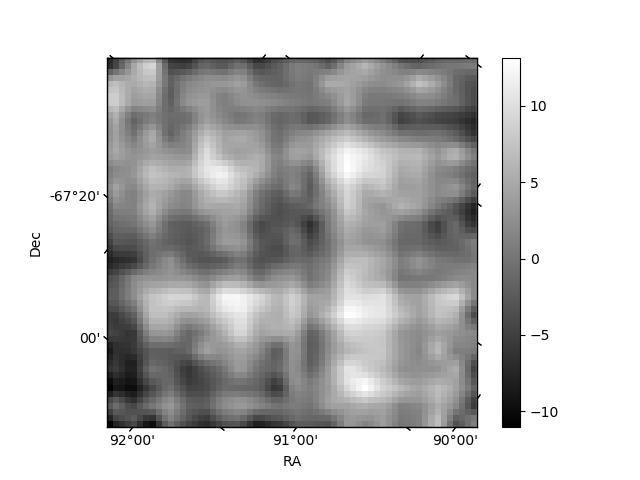
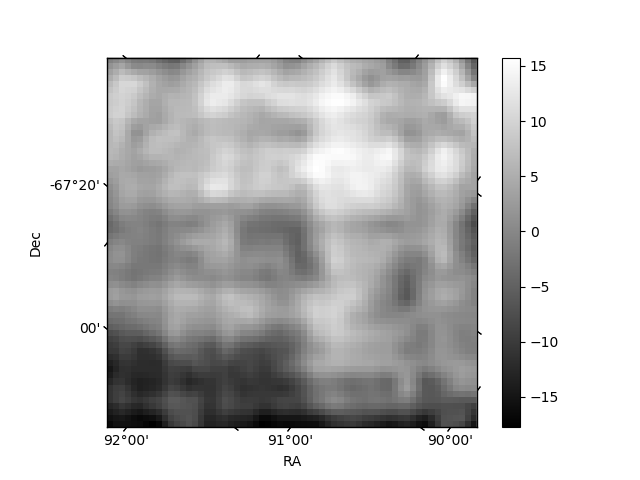
Histogram calculated using DETX and DETY for each event in the final _common_clean file
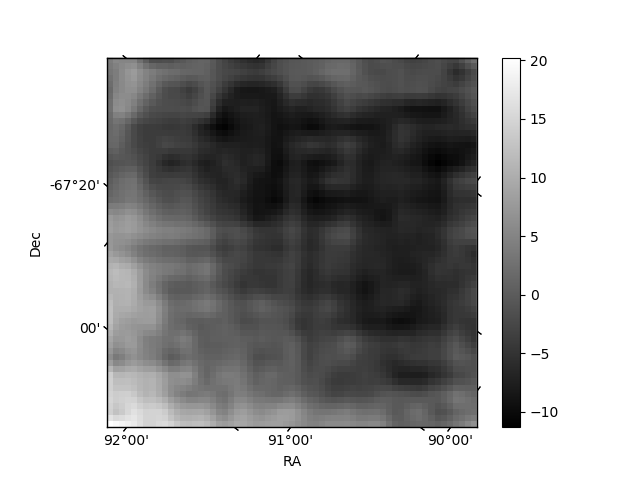
| Quadrant A | 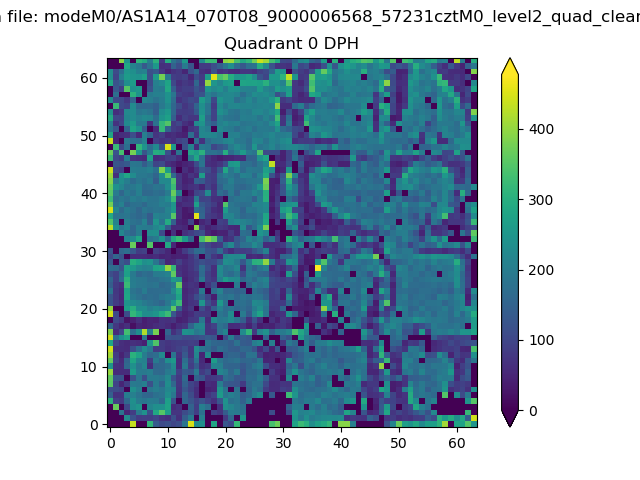 |
 |
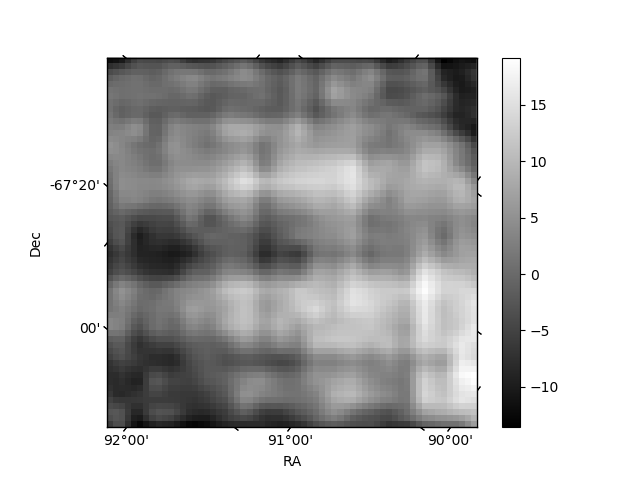
Quadrant B |
|---|---|---|---|
| Quadrant D | 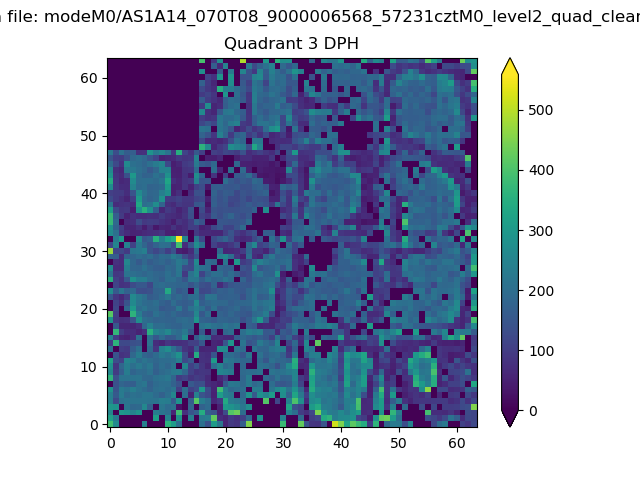 |
 |
Quadrant C |
| Plot type | Count rate plots | Images |
|---|---|---|
| Comparison with Poisson distribution Blue bars denote a histogram of data divided into 1 sec bins. Red curve is a Poisson curve with rate = median count rate of data. |
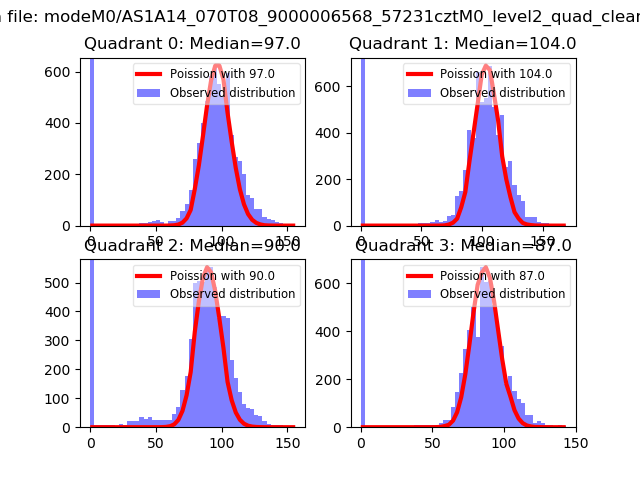 |
 |
| Quadrant-wise count rates Data is divided into 100 sec bins |
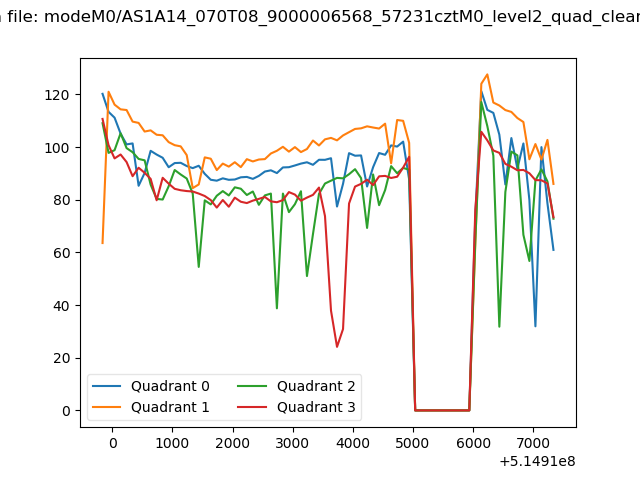 |
|
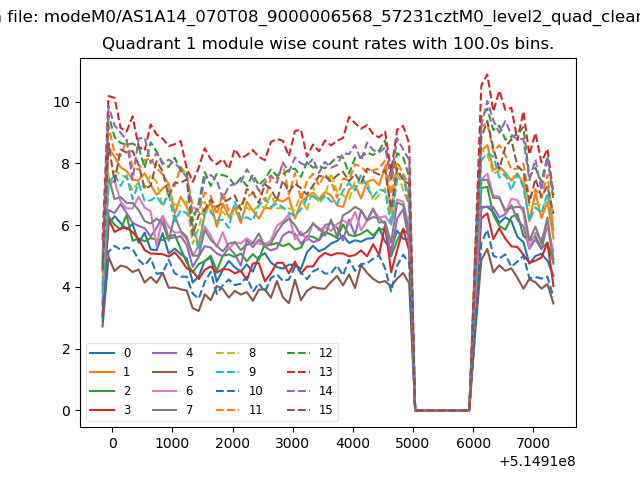
| Module-wise count rates for Quadrant A Data is divided into 100 sec bins |
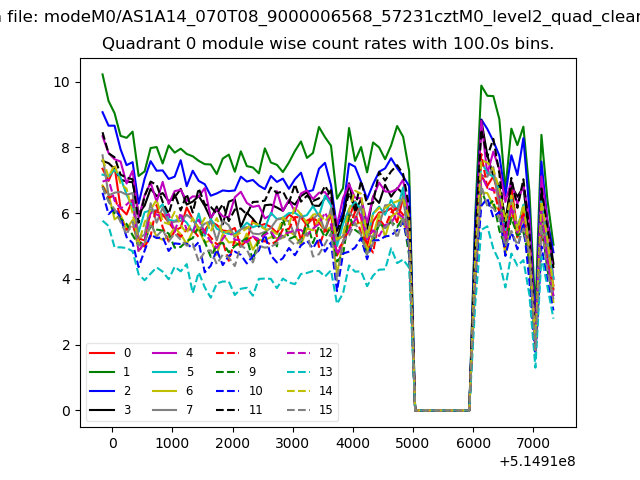 |
 |
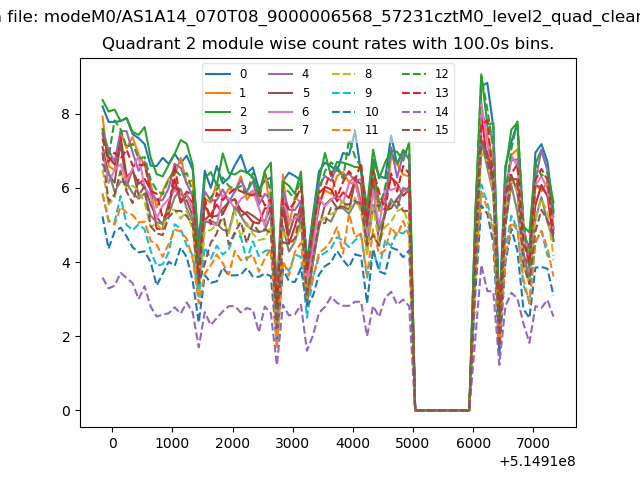
| Module-wise count rates for Quadrant B Data is divided into 100 sec bins |
 |
 |
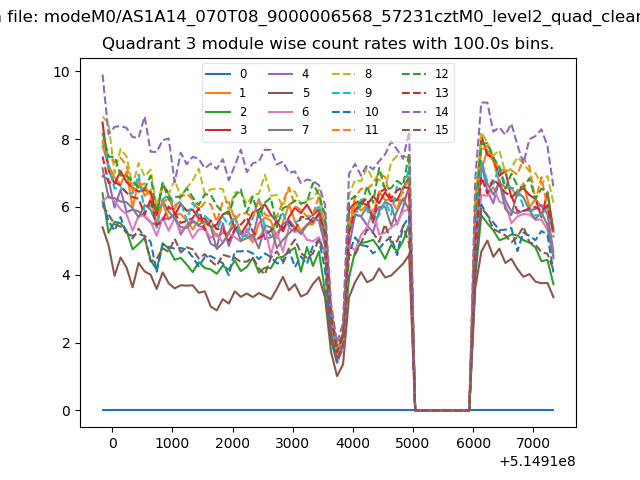
| Module-wise count rates for Quadrant C Data is divided into 100 sec bins |
 |
 |
| Module-wise count rates for Quadrant D Data is divided into 100 sec bins |
 |
 |
| Parameter | Plot |
|---|---|
| CZT HV Monitor | 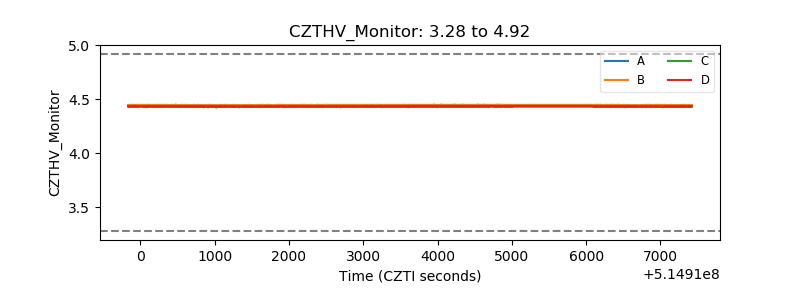 |
| D_VDD | 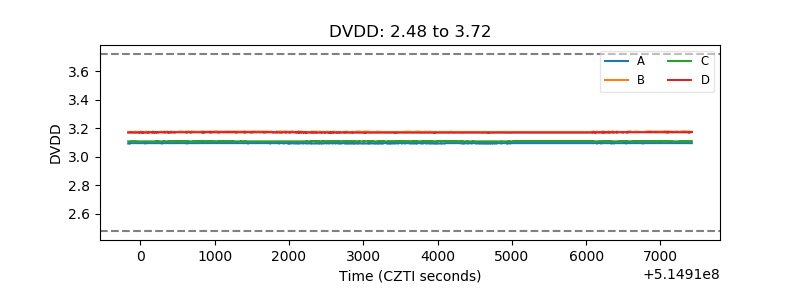 |
| Temperature 1 | 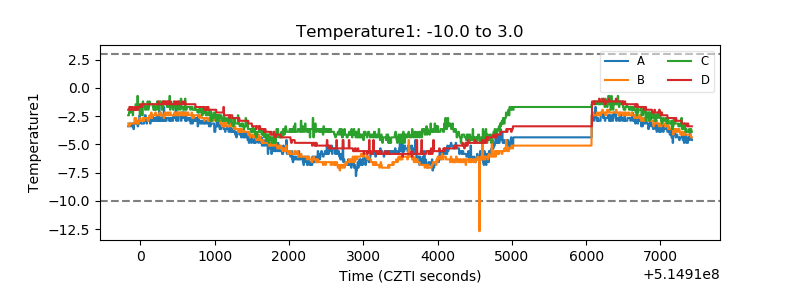 |
| Veto HV Monitor | 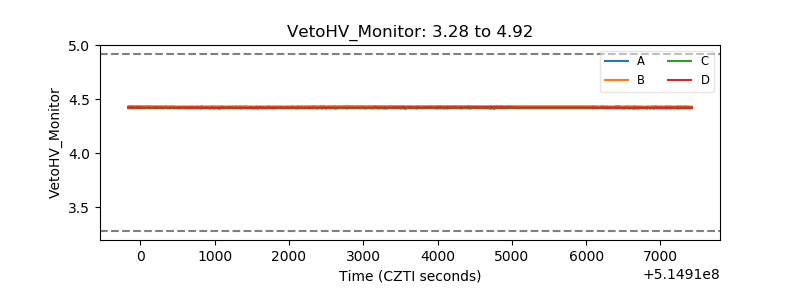 |
| Veto LLD | 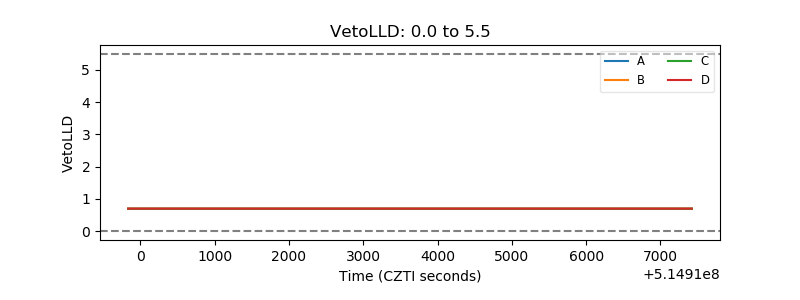 |
| Alpha Counter | 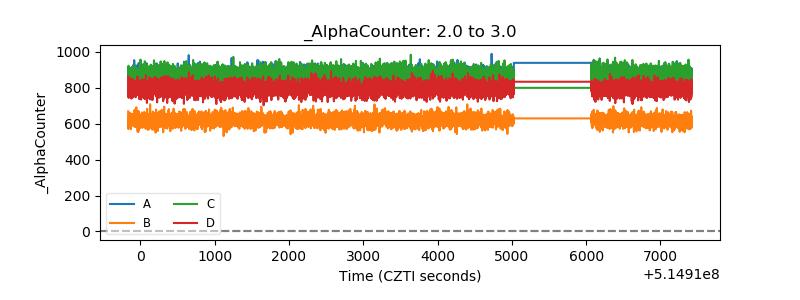 |
| _CPM_Rate | 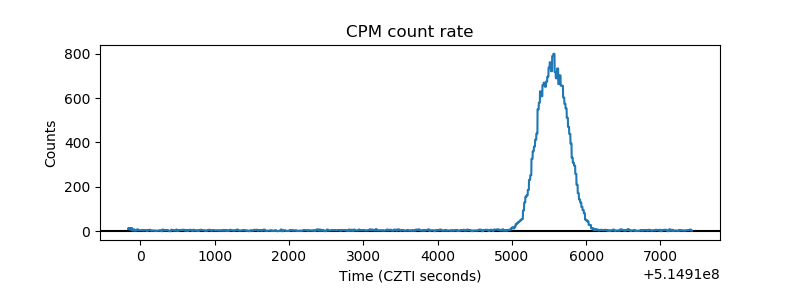 |
| CZT Counter | 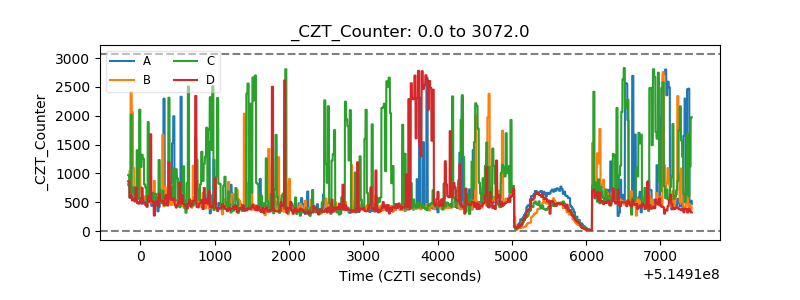 |
| +2.5 Volts monitor |  |
| +5 Volts monitor |  |
| _ROLL_ROT | 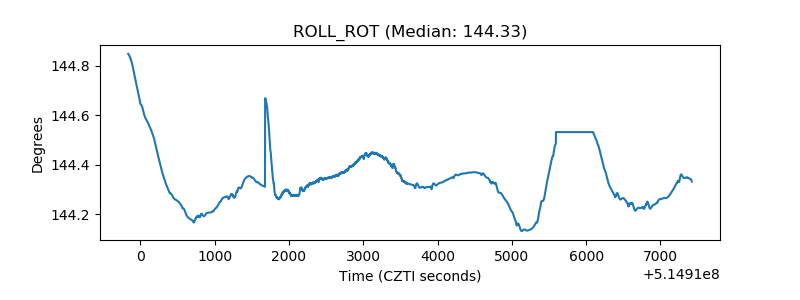 |
| _Roll_DEC | 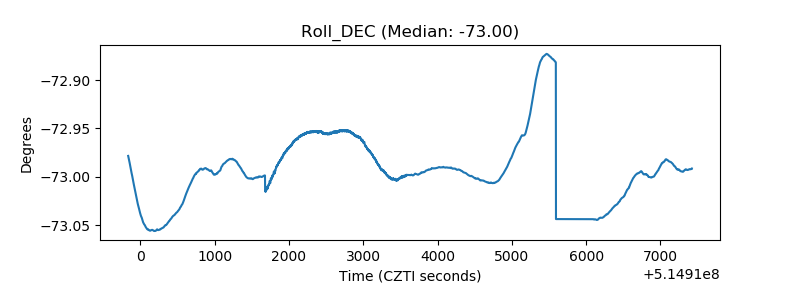 |
| _Roll_RA | 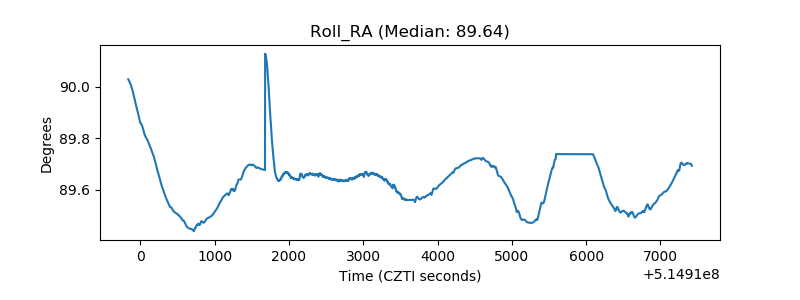 |
| Veto Counter | 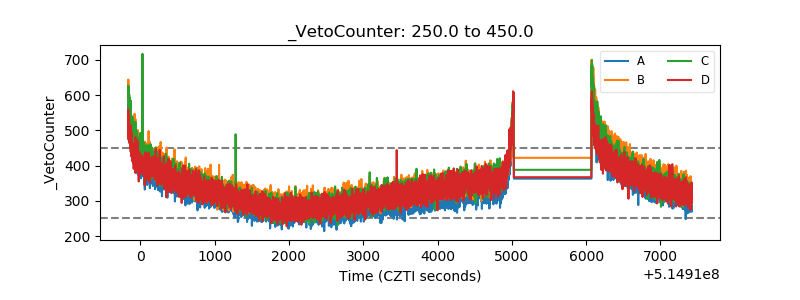 |