| Param | Original file | Final file |
|---|---|---|
| Filename | modeM0/AS1A14_070T08_9000006568_57234cztM0_level2.fits | modeM0/AS1A14_070T08_9000006568_57234cztM0_level2_quad_clean.evt |
| Size (bytes) | 408,228,480 | 86,659,200 |
| Size | 389.3 MB | 82.6 MB |
| Events in quadrant A | 2,899,027 | 571,153 |
| Events in quadrant B | 3,394,521 | 607,885 |
| Events in quadrant C | 4,579,178 | 512,969 |
| Events in quadrant D | 3,750,903 | 494,313 |
| Mode M9 | |||
|---|---|---|---|
| Quadrant | BADHDUFLAG | Total packets | Discarded packets |
| A | 0 | 21 | 0 |
| B | 0 | 22 | 0 |
| C | 0 | 22 | 0 |
| D | 0 | 22 | 0 |
| Mode SS | |||
|---|---|---|---|
| Quadrant | BADHDUFLAG | Total packets | Discarded packets |
| A | 0 | 128 | 0 |
| B | 0 | 128 | 0 |
| C | 0 | 128 | 0 |
| D | 0 | 128 | 0 |
| Mode M0 | |||
|---|---|---|---|
| Quadrant | BADHDUFLAG | Total packets | Discarded packets |
| A | 0 | 13104 | 2 |
| B | 0 | 14610 | 2 |
| C | 0 | 18138 | 2 |
| D | 0 | 15877 | 2 |
| Quadrant | Total seconds | Saturated seconds | Saturation percentage |
|---|---|---|---|
| A | 6267 | 39 | 0.622307% |
| B | 6267 | 222 | 3.542365% |
| C | 6267 | 403 | 6.430509% |
| D | 6267 | 231 | 3.685974% |
Noise dominated data is calculated using 1-second bins in cleaned event files. If a bin has >2000 counts, and if more than 50% of those come from <1% of pixels, then it is considered to be noise-dominated and hence unusable.
| Quadrant | # 1 sec bins | Bins with >0 counts | Bins with >2000 counts | High rate bins dominated by noise | Noise dominated (total time) | Noise dominated (detector-on time) | Marked lightcurve |
|---|---|---|---|---|---|---|---|
| A | 7732 | 6554 | 12 | 12 | 0.16% | 0.18% | 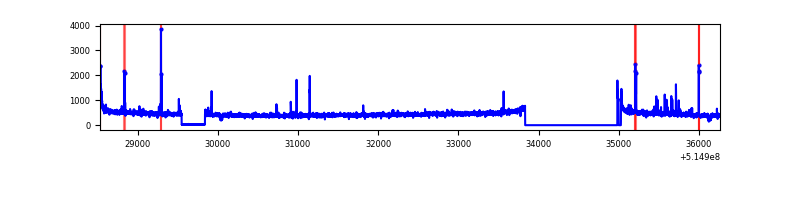 |
| B | 7732 | 6554 | 114 | 114 | 1.47% | 1.74% | 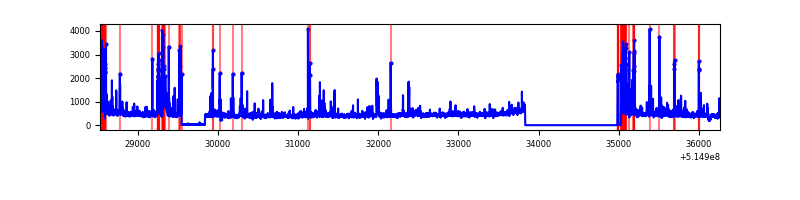 |
| C | 7731 | 6552 | 320 | 320 | 4.14% | 4.88% | 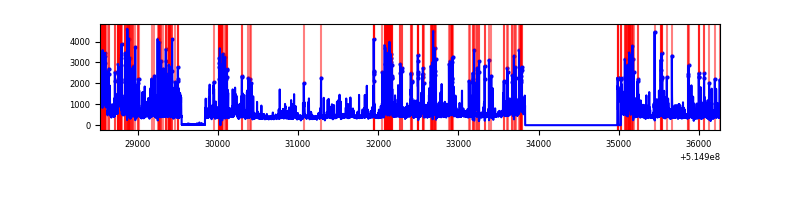 |
| D | 7732 | 6554 | 208 | 208 | 2.69% | 3.17% | 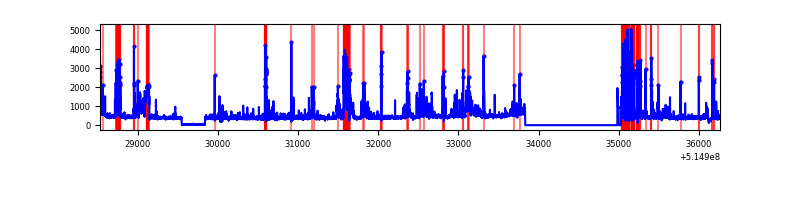 |
Top three noisy pixels from each quadrant. If the there are fewer than three noisy pixels in the level2.evt file, extra rows are filled as -1
| Pixel properties | Quadrant properties | ||||||
|---|---|---|---|---|---|---|---|
| Quadrant | DetID | PixID | Counts | Sigma | Mean | Median | Sigma |
| A | 0 | 128 | 130968 | 790.31 | 669 | 651 | 164.9 |
| A | 10 | 251 | 48469 | 289.99 | 669 | 651 | 164.9 |
| A | 3 | 14 | 36186 | 215.5 | 669 | 651 | 164.9 |
| B | 10 | 16 | 345894 | 2467.31 | 652 | 628 | 139.9 |
| B | 7 | 252 | 192739 | 1372.85 | 652 | 628 | 139.9 |
| B | 0 | 245 | 53502 | 377.84 | 652 | 628 | 139.9 |
| C | 15 | 224 | 1903504 | 11187.46 | 620 | 612 | 170.1 |
| C | 14 | 254 | 149366 | 874.55 | 620 | 612 | 170.1 |
| C | 12 | 250 | 26449 | 151.9 | 620 | 612 | 170.1 |
| D | 9 | 102 | 369477 | 2062.34 | 624 | 595 | 178.9 |
| D | 8 | 240 | 346491 | 1933.83 | 624 | 595 | 178.9 |
| D | 12 | 128 | 163724 | 912.02 | 624 | 595 | 178.9 |
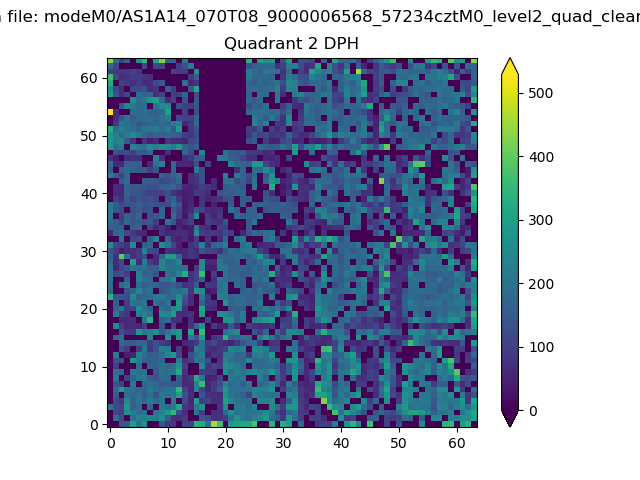
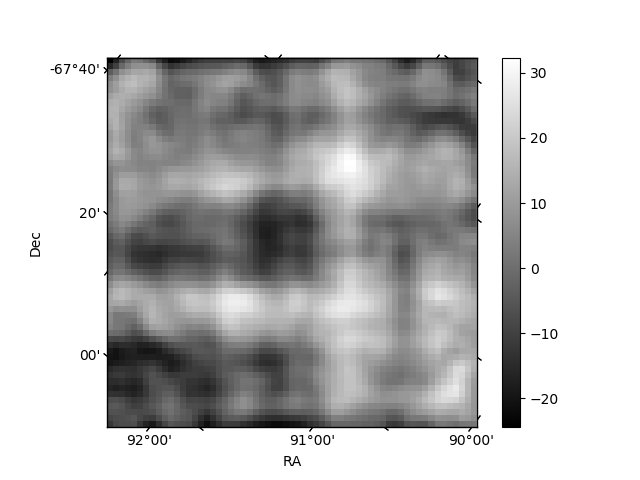
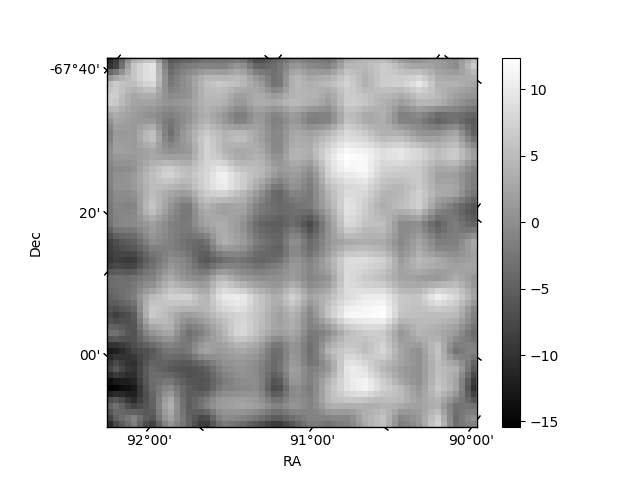
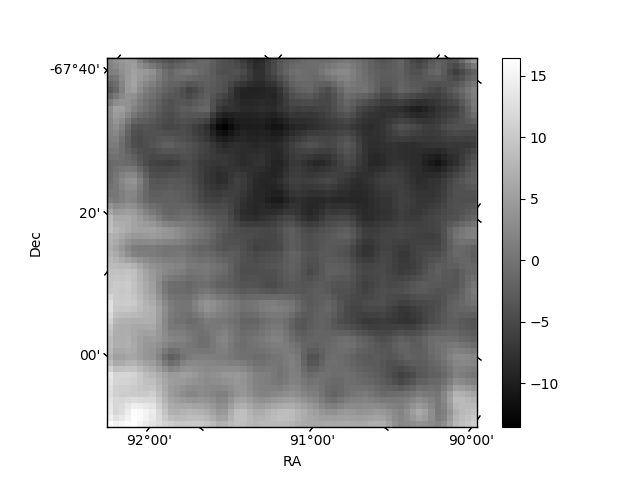
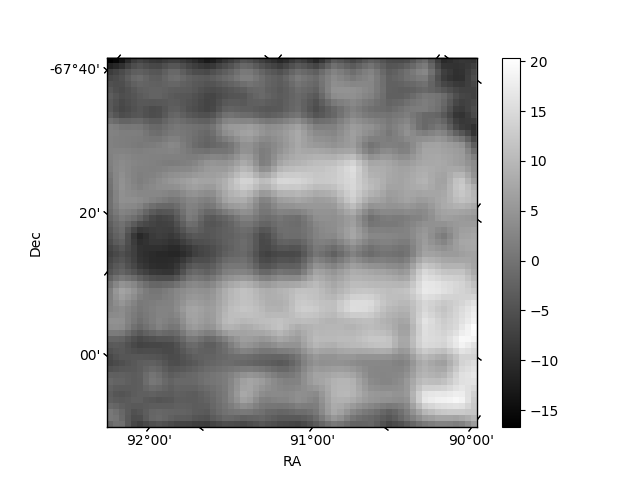
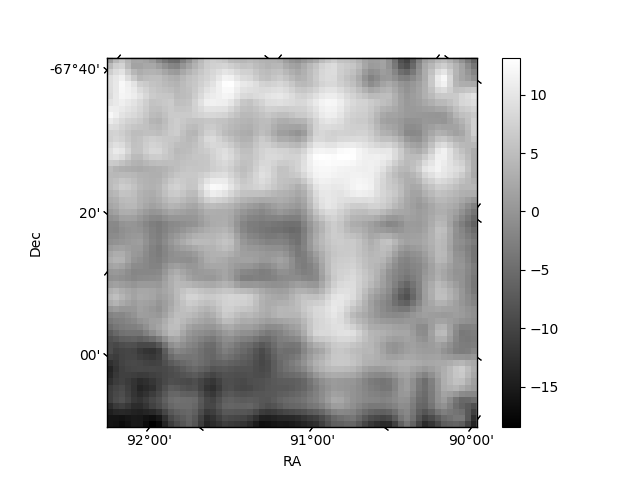
Histogram calculated using DETX and DETY for each event in the final _common_clean file
| Quadrant A | 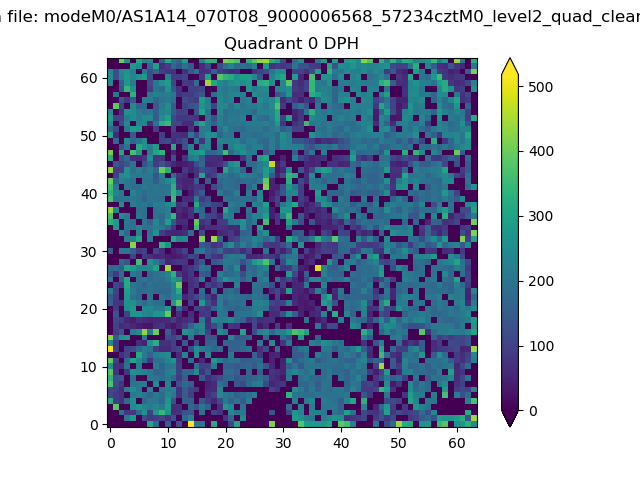 |
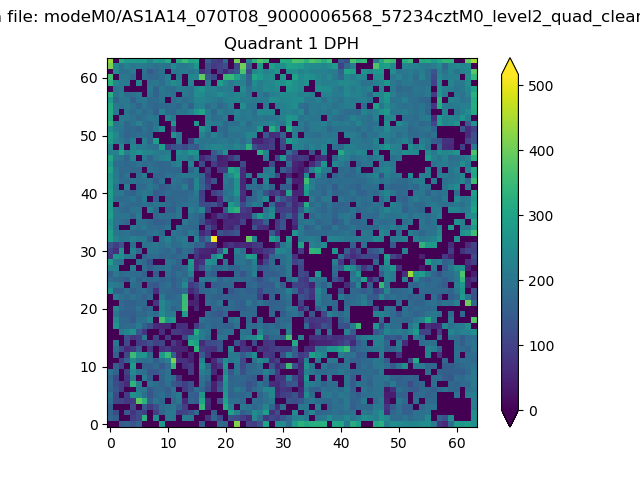 |
Quadrant B |
|---|---|---|---|
| Quadrant D | 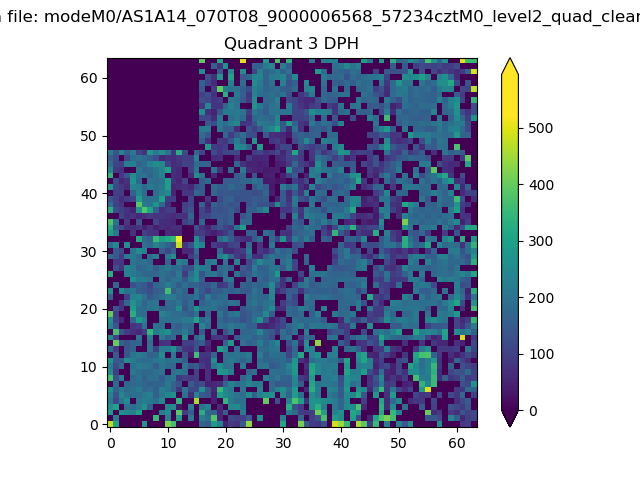 |
 |
Quadrant C |
| Plot type | Count rate plots | Images |
|---|---|---|
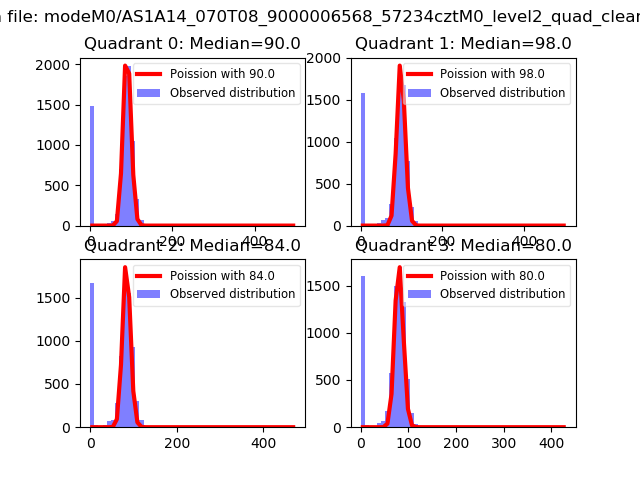
| Comparison with Poisson distribution Blue bars denote a histogram of data divided into 1 sec bins. Red curve is a Poisson curve with rate = median count rate of data. |
 |
 |
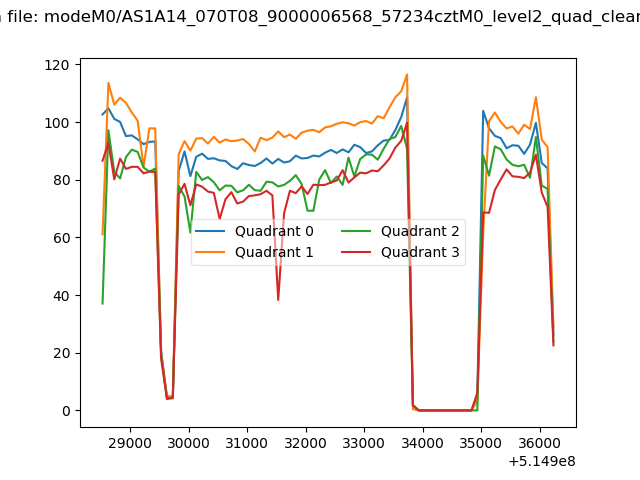
| Quadrant-wise count rates Data is divided into 100 sec bins |
 |
|
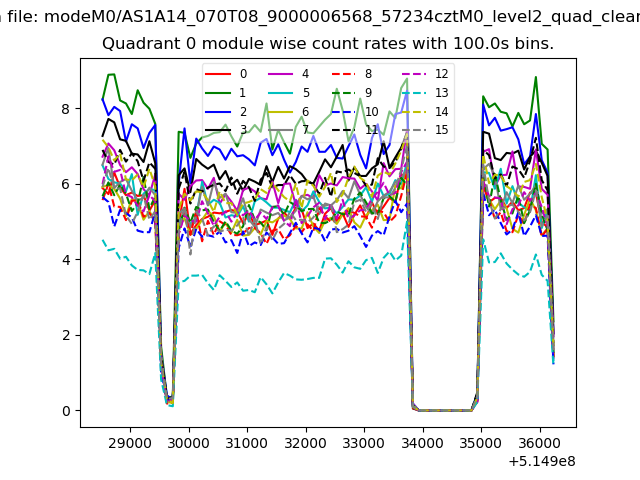
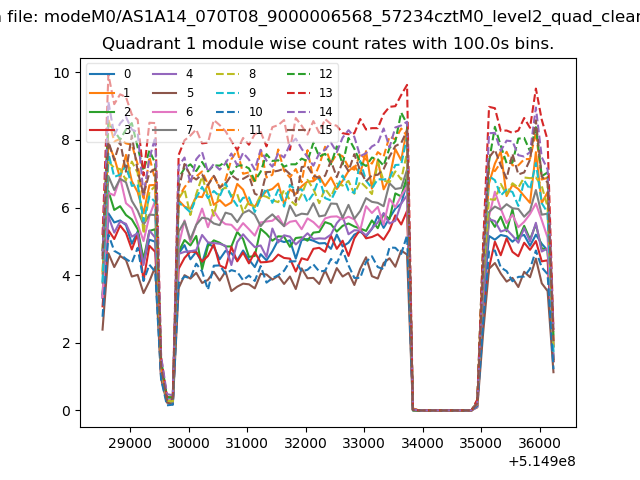
| Module-wise count rates for Quadrant A Data is divided into 100 sec bins |
 |
 |
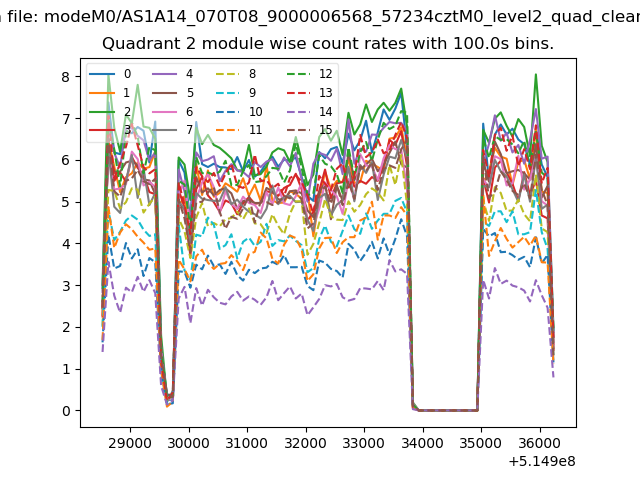
| Module-wise count rates for Quadrant B Data is divided into 100 sec bins |
 |
 |
| Module-wise count rates for Quadrant C Data is divided into 100 sec bins |
 |
 |
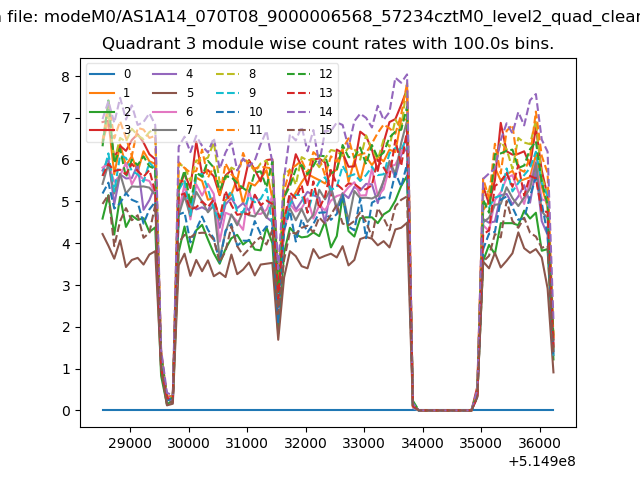
| Module-wise count rates for Quadrant D Data is divided into 100 sec bins |
 |
 |
| Parameter | Plot |
|---|---|
| CZT HV Monitor | 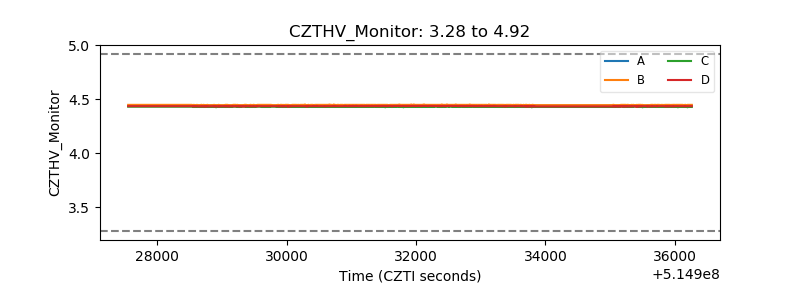 |
| D_VDD | 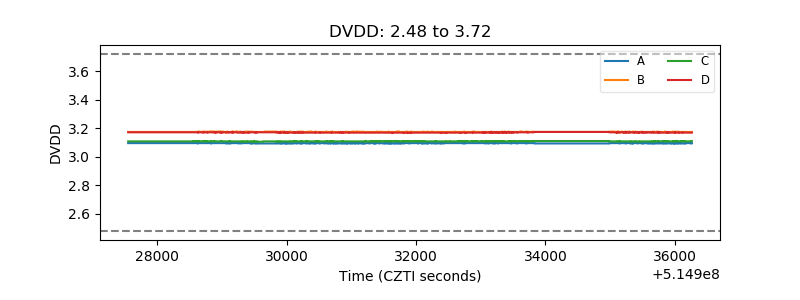 |
| Temperature 1 | 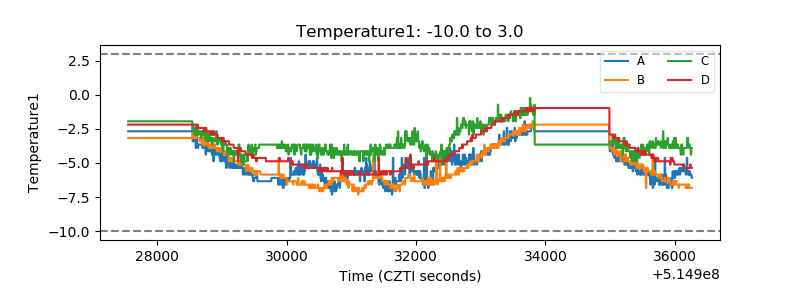 |
| Veto HV Monitor | 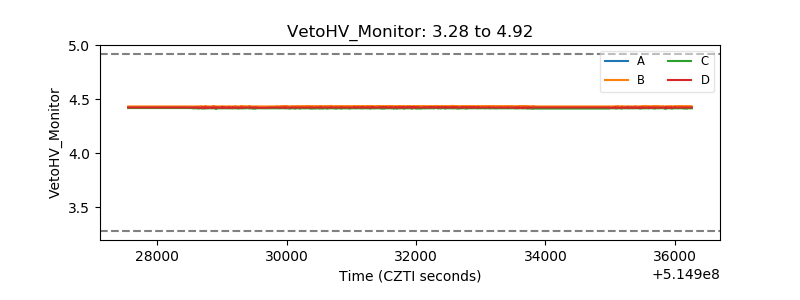 |
| Veto LLD | 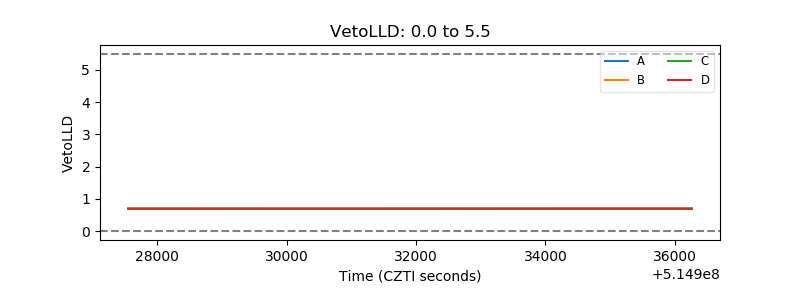 |
| Alpha Counter | 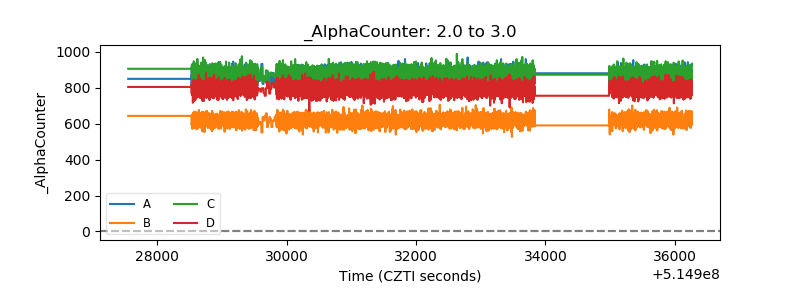 |
| _CPM_Rate | 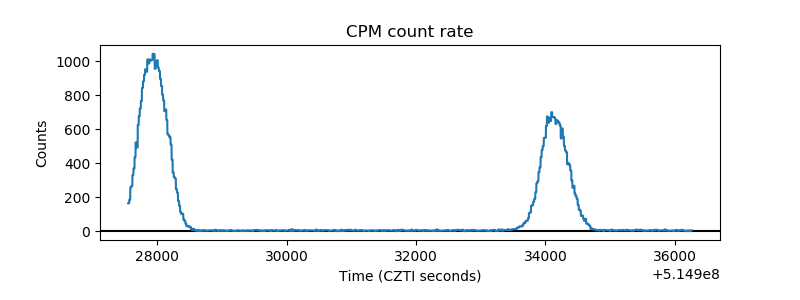 |
| CZT Counter | 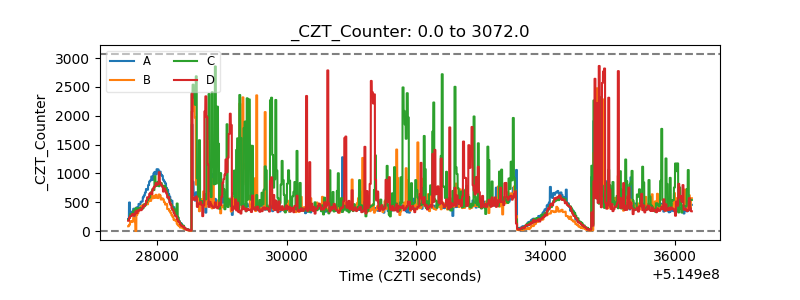 |
| +2.5 Volts monitor |  |
| +5 Volts monitor |  |
| _ROLL_ROT | 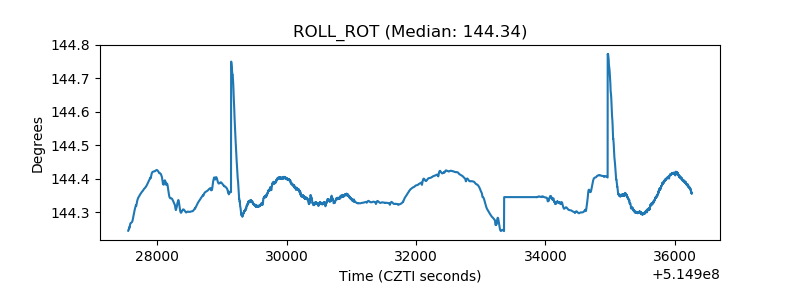 |
| _Roll_DEC | 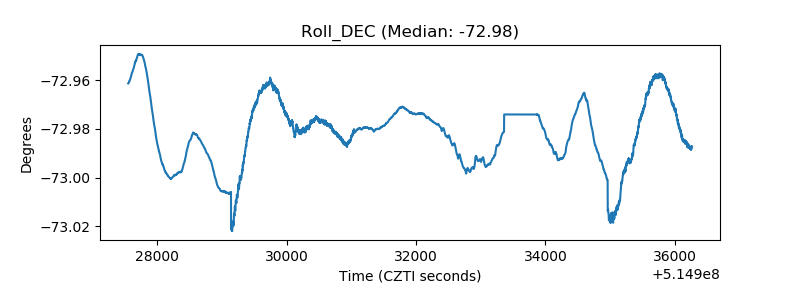 |
| _Roll_RA | 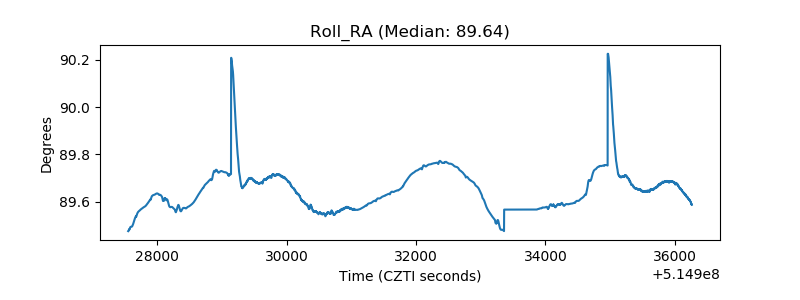 |
| Veto Counter | 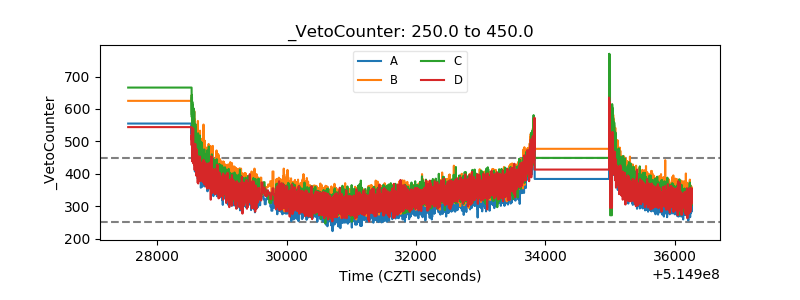 |