| Param | Original file | Final file |
|---|---|---|
| Filename | modeM0/AS1A14_070T08_9000006568_57236cztM0_level2.fits | modeM0/AS1A14_070T08_9000006568_57236cztM0_level2_quad_clean.evt |
| Size (bytes) | 412,061,760 | 87,094,080 |
| Size | 393.0 MB | 83.1 MB |
| Events in quadrant A | 3,976,472 | 566,118 |
| Events in quadrant B | 3,337,796 | 600,309 |
| Events in quadrant C | 3,991,088 | 508,123 |
| Events in quadrant D | 3,416,928 | 486,563 |
| Mode M9 | |||
|---|---|---|---|
| Quadrant | BADHDUFLAG | Total packets | Discarded packets |
| A | 0 | 14 | 0 |
| B | 0 | 15 | 0 |
| C | 0 | 15 | 0 |
| D | 0 | 15 | 0 |
| Mode SS | |||
|---|---|---|---|
| Quadrant | BADHDUFLAG | Total packets | Discarded packets |
| A | 0 | 140 | 0 |
| B | 0 | 140 | 0 |
| C | 0 | 140 | 0 |
| D | 0 | 140 | 0 |
| Mode M0 | |||
|---|---|---|---|
| Quadrant | BADHDUFLAG | Total packets | Discarded packets |
| A | 0 | 16889 | 3 |
| B | 0 | 15023 | 2 |
| C | 0 | 16957 | 2 |
| D | 0 | 15202 | 2 |
| Quadrant | Total seconds | Saturated seconds | Saturation percentage |
|---|---|---|---|
| A | 6822 | 185 | 2.711815% |
| B | 6822 | 176 | 2.579889% |
| C | 6822 | 187 | 2.741132% |
| D | 6822 | 89 | 1.304603% |
Noise dominated data is calculated using 1-second bins in cleaned event files. If a bin has >2000 counts, and if more than 50% of those come from <1% of pixels, then it is considered to be noise-dominated and hence unusable.
| Quadrant | # 1 sec bins | Bins with >0 counts | Bins with >2000 counts | High rate bins dominated by noise | Noise dominated (total time) | Noise dominated (detector-on time) | Marked lightcurve |
|---|---|---|---|---|---|---|---|
| A | 7946 | 7108 | 102 | 102 | 1.28% | 1.44% | 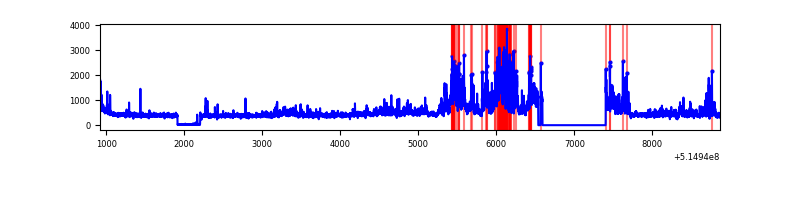 |
| B | 7946 | 7107 | 77 | 77 | 0.97% | 1.08% | 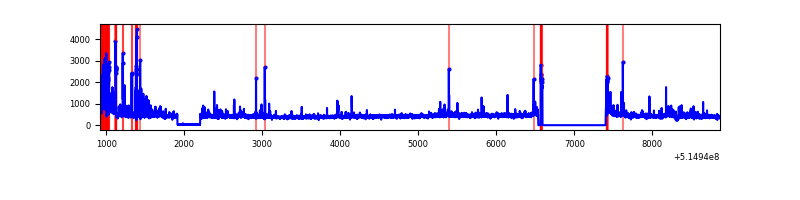 |
| C | 7946 | 7102 | 130 | 130 | 1.64% | 1.83% | 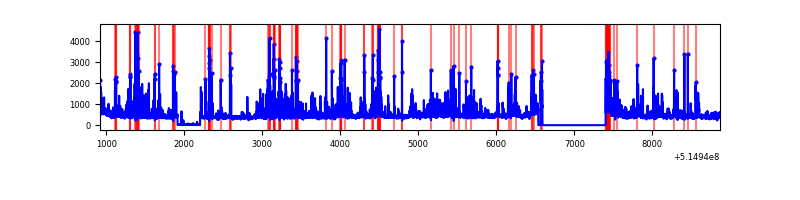 |
| D | 7946 | 7108 | 65 | 65 | 0.82% | 0.91% | 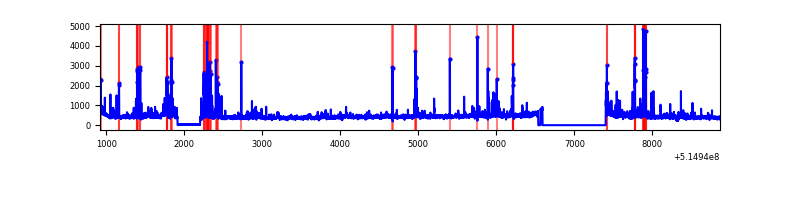 |
Top three noisy pixels from each quadrant. If the there are fewer than three noisy pixels in the level2.evt file, extra rows are filled as -1
| Pixel properties | Quadrant properties | ||||||
|---|---|---|---|---|---|---|---|
| Quadrant | DetID | PixID | Counts | Sigma | Mean | Median | Sigma |
| A | 7 | 64 | 1149152 | 6539.91 | 707 | 689 | 175.6 |
| A | 10 | 251 | 41331 | 231.43 | 707 | 689 | 175.6 |
| A | 9 | 129 | 17161 | 93.8 | 707 | 689 | 175.6 |
| B | 10 | 16 | 343035 | 2319.55 | 695 | 670 | 147.6 |
| B | 10 | 247 | 71685 | 481.13 | 695 | 670 | 147.6 |
| B | 5 | 185 | 68001 | 456.17 | 695 | 670 | 147.6 |
| C | 15 | 224 | 1221704 | 6497.61 | 680 | 671 | 187.9 |
| C | 14 | 254 | 69954 | 368.68 | 680 | 671 | 187.9 |
| C | 9 | 237 | 34221 | 178.53 | 680 | 671 | 187.9 |
| D | 8 | 240 | 303818 | 1556.97 | 681 | 649 | 194.7 |
| D | 8 | 160 | 108593 | 554.36 | 681 | 649 | 194.7 |
| D | 9 | 1 | 87972 | 448.46 | 681 | 649 | 194.7 |
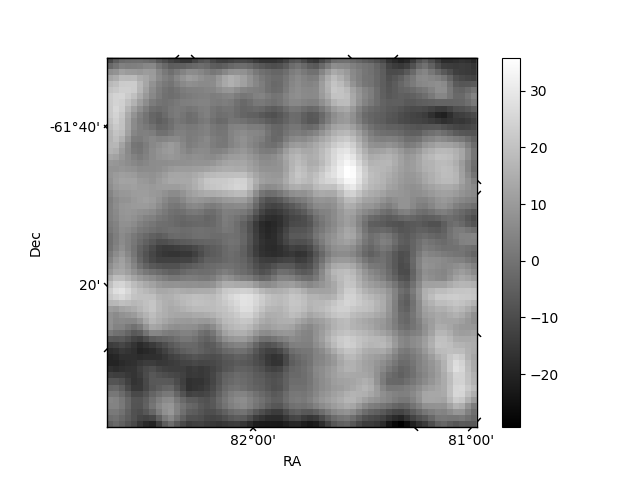
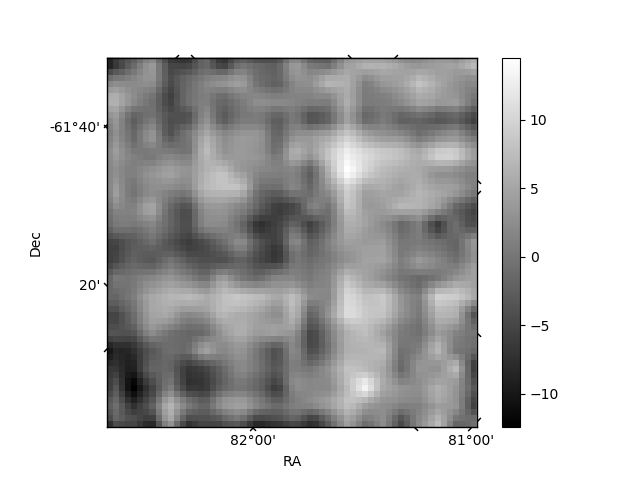
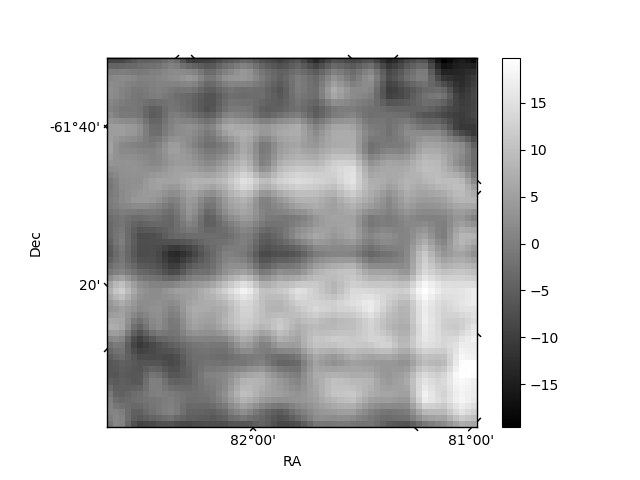
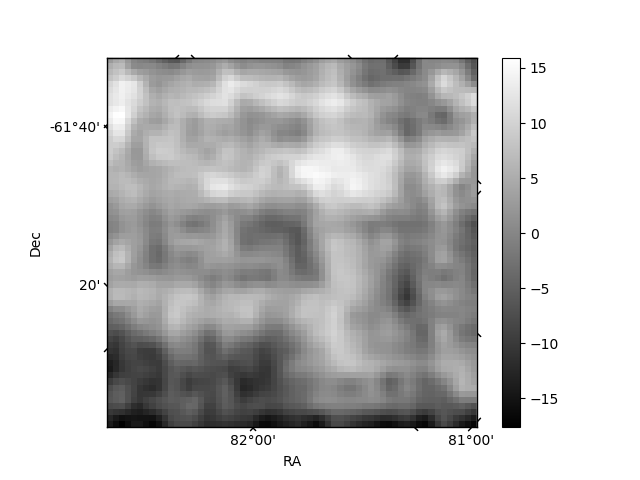
Histogram calculated using DETX and DETY for each event in the final _common_clean file
| Quadrant A | 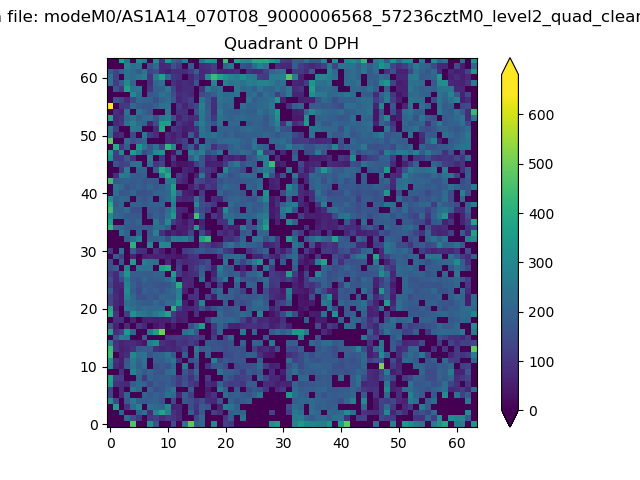 |
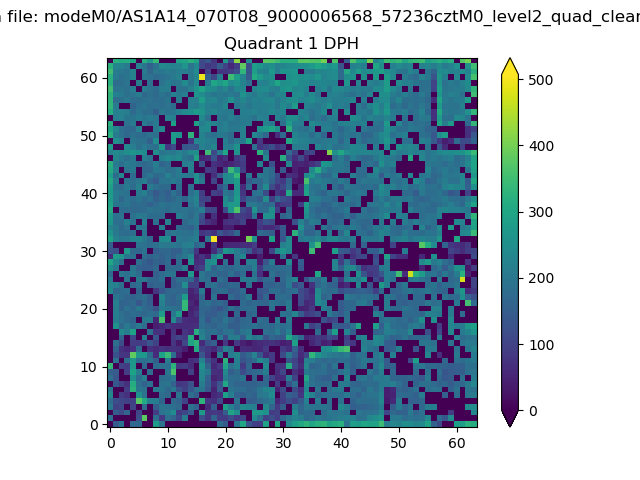 |
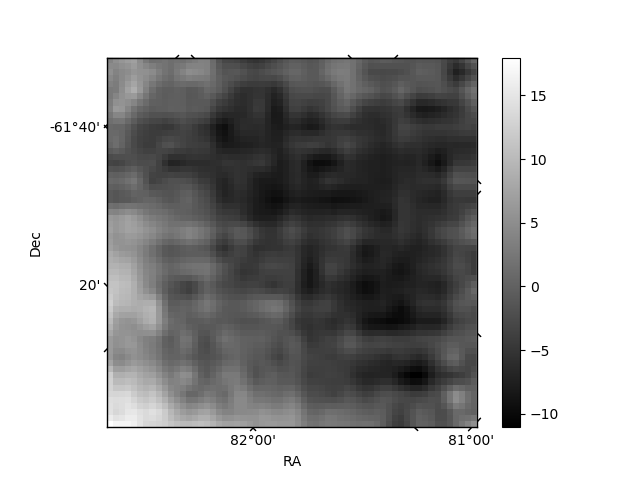
Quadrant B |
|---|---|---|---|
| Quadrant D | 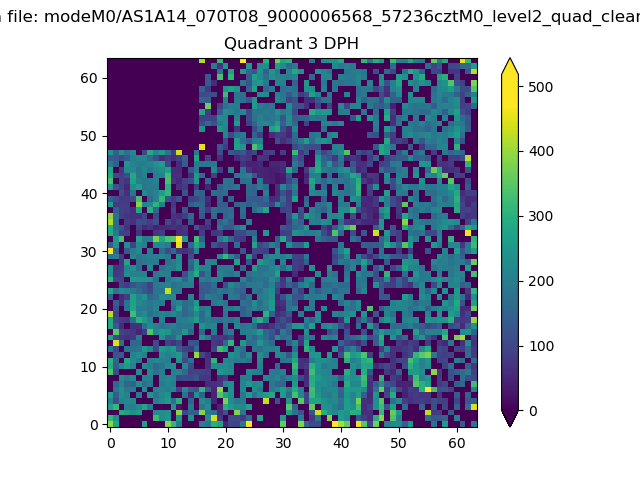 |
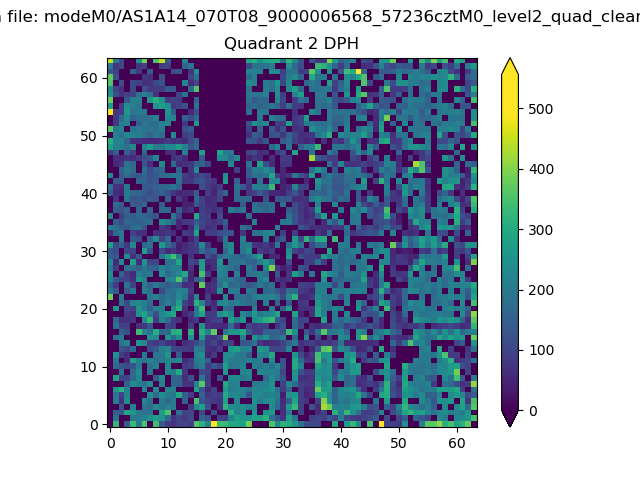 |
Quadrant C |
| Plot type | Count rate plots | Images |
|---|---|---|
| Comparison with Poisson distribution Blue bars denote a histogram of data divided into 1 sec bins. Red curve is a Poisson curve with rate = median count rate of data. |
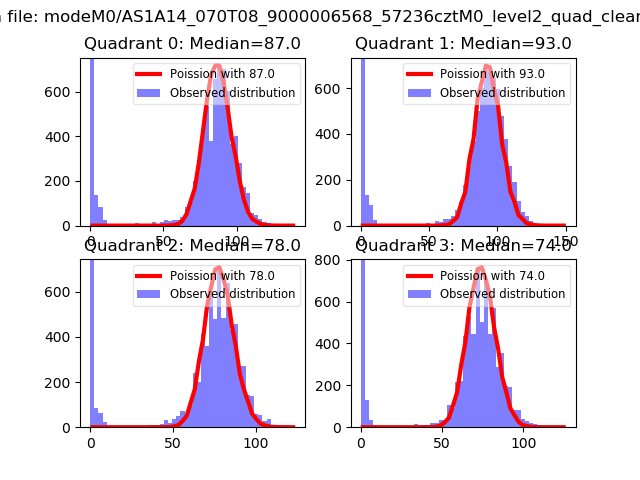 |
 |
| Quadrant-wise count rates Data is divided into 100 sec bins |
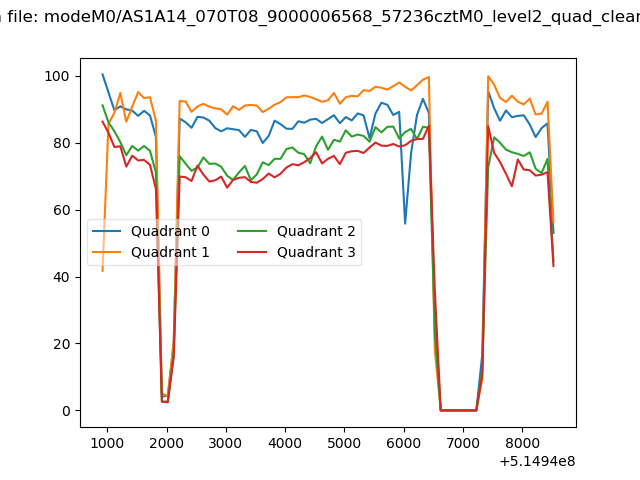 |
|
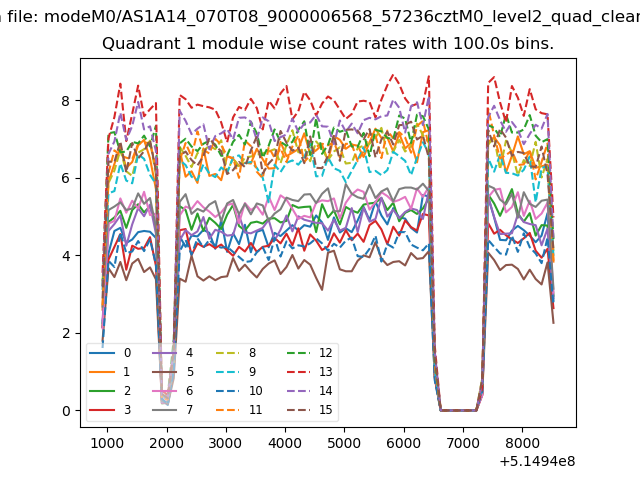
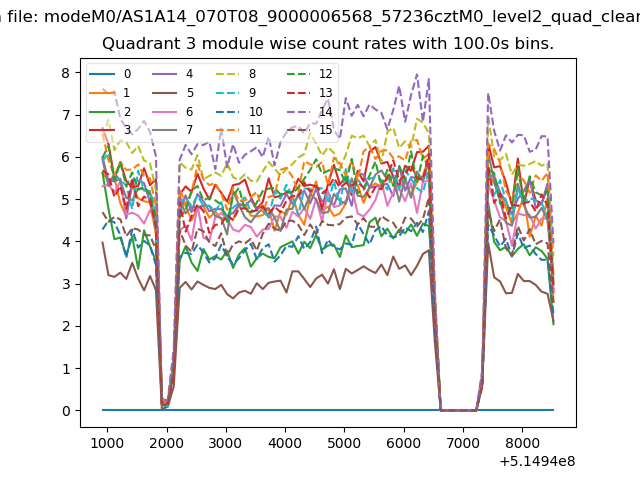
| Module-wise count rates for Quadrant A Data is divided into 100 sec bins |
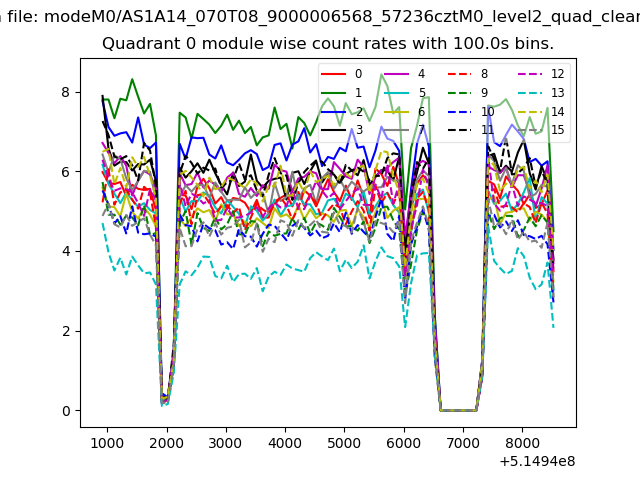 |
 |
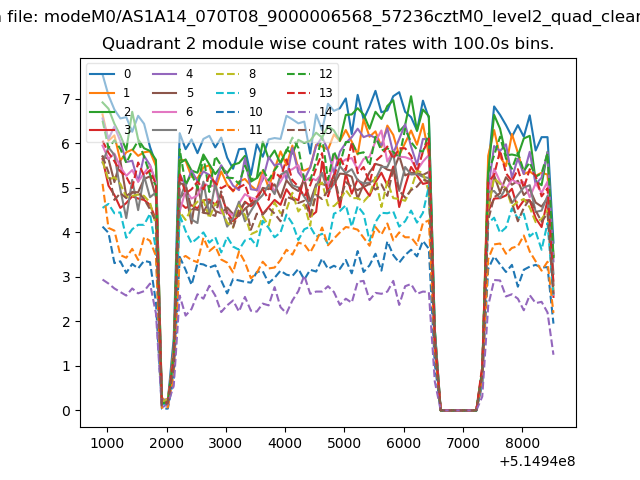
| Module-wise count rates for Quadrant B Data is divided into 100 sec bins |
 |
 |
| Module-wise count rates for Quadrant C Data is divided into 100 sec bins |
 |
 |
| Module-wise count rates for Quadrant D Data is divided into 100 sec bins |
 |
 |
| Parameter | Plot |
|---|---|
| CZT HV Monitor | 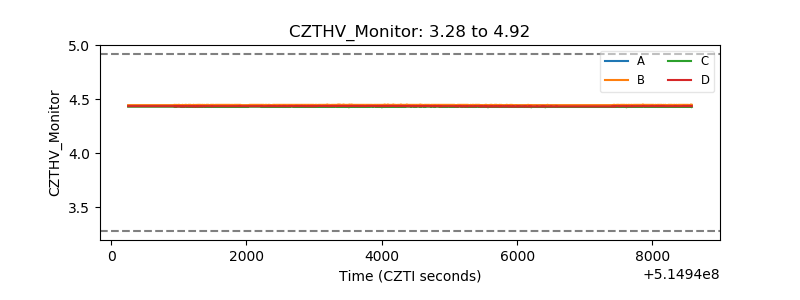 |
| D_VDD | 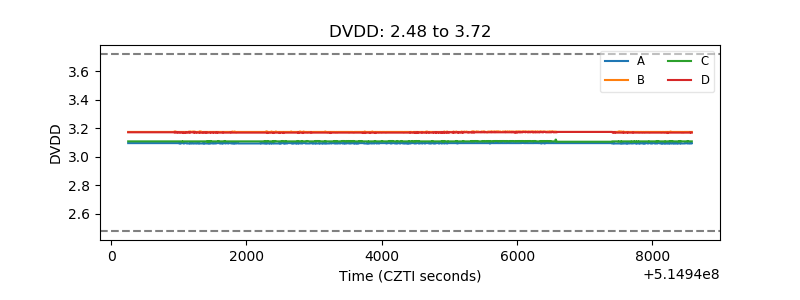 |
| Temperature 1 | 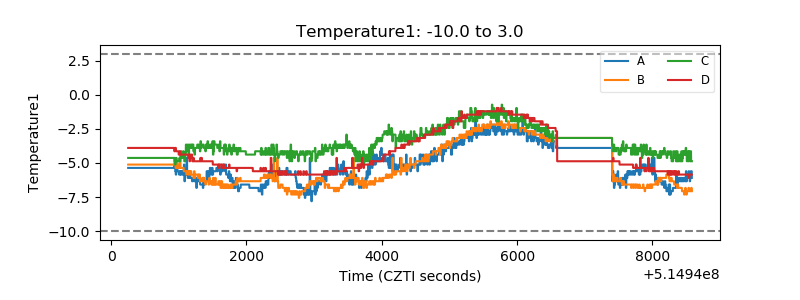 |
| Veto HV Monitor | 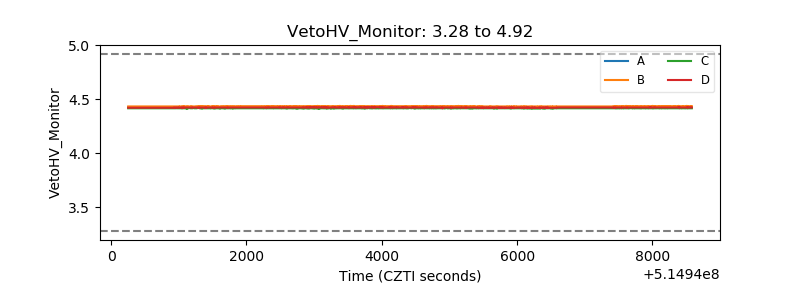 |
| Veto LLD | 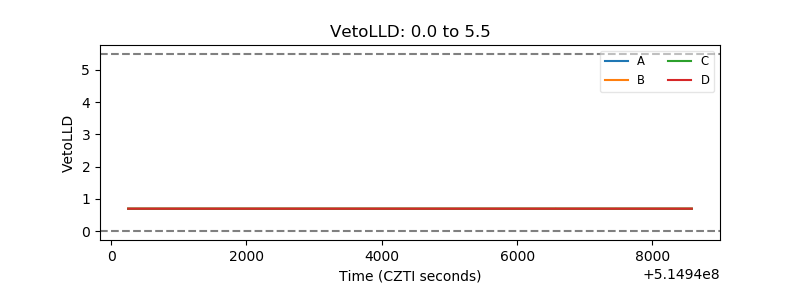 |
| Alpha Counter | 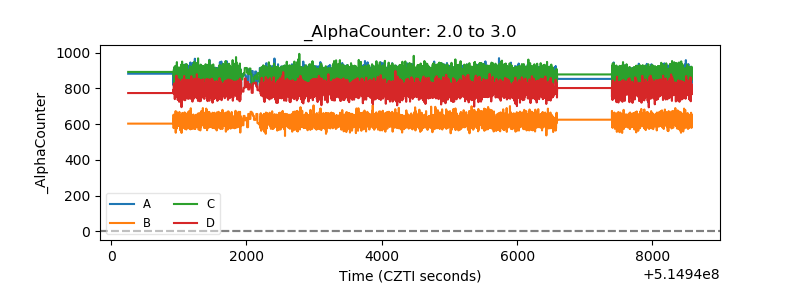 |
| _CPM_Rate | 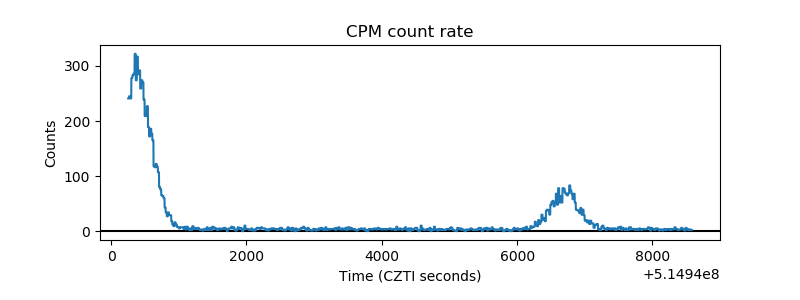 |
| CZT Counter | 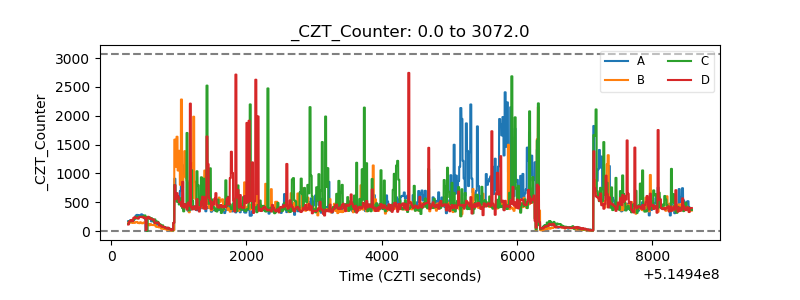 |
| +2.5 Volts monitor | 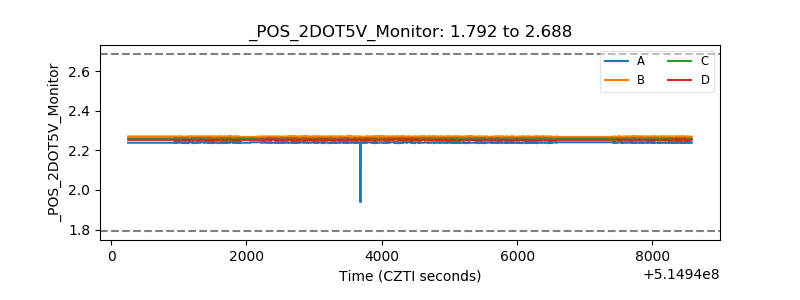 |
| +5 Volts monitor |  |
| _ROLL_ROT | 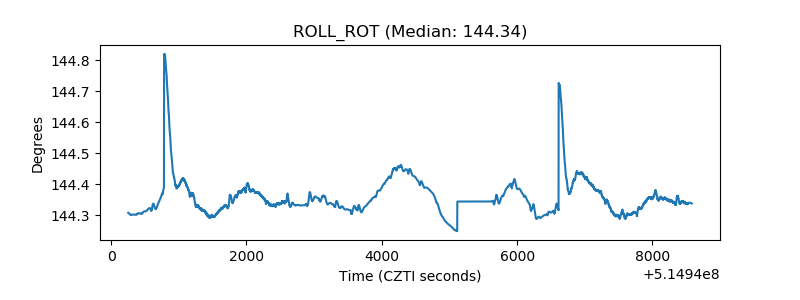 |
| _Roll_DEC | 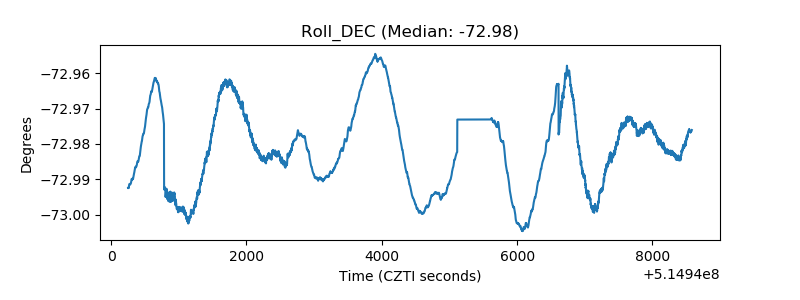 |
| _Roll_RA | 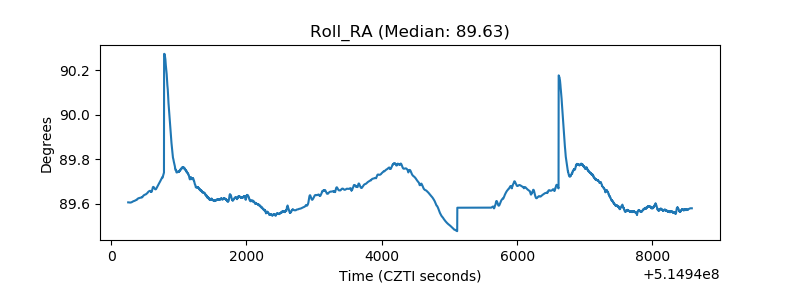 |
| Veto Counter | 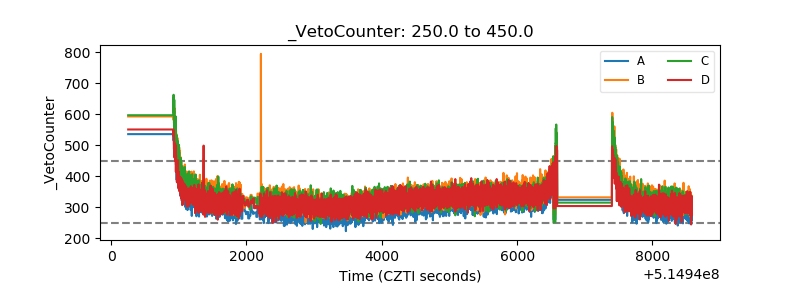 |