| Param | Original file | Final file |
|---|---|---|
| Filename | modeM0/AS1A14_070T08_9000006568_57237cztM0_level2.fits | modeM0/AS1A14_070T08_9000006568_57237cztM0_level2_quad_clean.evt |
| Size (bytes) | 569,629,440 | 102,922,560 |
| Size | 543.2 MB | 98.2 MB |
| Events in quadrant A | 5,600,494 | 652,028 |
| Events in quadrant B | 4,130,484 | 715,488 |
| Events in quadrant C | 6,294,871 | 588,137 |
| Events in quadrant D | 4,399,723 | 569,675 |
| Mode M9 | |||
|---|---|---|---|
| Quadrant | BADHDUFLAG | Total packets | Discarded packets |
| A | 0 | 9 | 0 |
| B | 0 | 9 | 0 |
| C | 0 | 9 | 0 |
| D | 0 | 9 | 0 |
| Mode SS | |||
|---|---|---|---|
| Quadrant | BADHDUFLAG | Total packets | Discarded packets |
| A | 0 | 176 | 0 |
| B | 0 | 176 | 0 |
| C | 0 | 176 | 0 |
| D | 0 | 176 | 0 |
| Mode M0 | |||
|---|---|---|---|
| Quadrant | BADHDUFLAG | Total packets | Discarded packets |
| A | 0 | 22998 | 3 |
| B | 0 | 18591 | 4 |
| C | 0 | 24793 | 3 |
| D | 0 | 19427 | 3 |
| Quadrant | Total seconds | Saturated seconds | Saturation percentage |
|---|---|---|---|
| A | 8497 | 571 | 6.720019% |
| B | 8497 | 321 | 3.777804% |
| C | 8497 | 815 | 9.591621% |
| D | 8497 | 222 | 2.612687% |
Noise dominated data is calculated using 1-second bins in cleaned event files. If a bin has >2000 counts, and if more than 50% of those come from <1% of pixels, then it is considered to be noise-dominated and hence unusable.
| Quadrant | # 1 sec bins | Bins with >0 counts | Bins with >2000 counts | High rate bins dominated by noise | Noise dominated (total time) | Noise dominated (detector-on time) | Marked lightcurve |
|---|---|---|---|---|---|---|---|
| A | 9751 | 8785 | 266 | 266 | 2.73% | 3.03% | 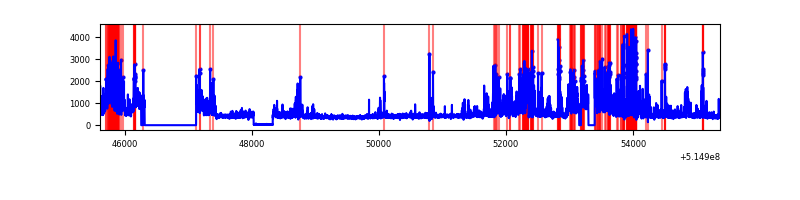 |
| B | 9751 | 8784 | 30 | 30 | 0.31% | 0.34% | 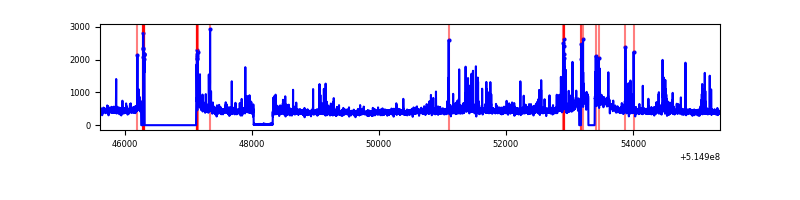 |
| C | 9751 | 8783 | 506 | 506 | 5.19% | 5.76% | 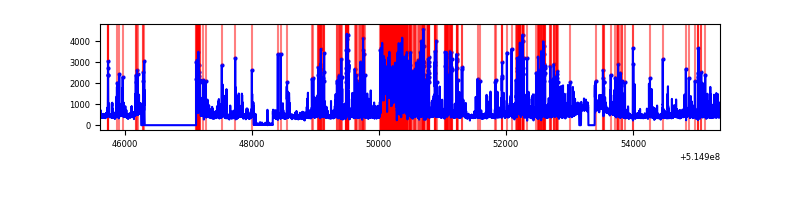 |
| D | 9751 | 8785 | 111 | 111 | 1.14% | 1.26% | 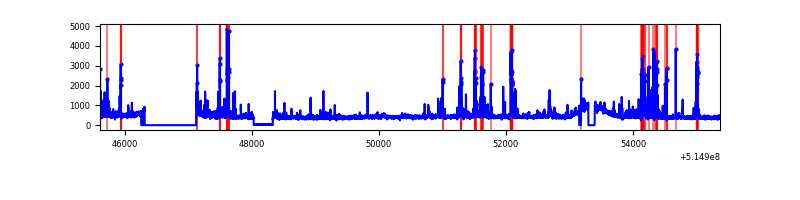 |
Top three noisy pixels from each quadrant. If the there are fewer than three noisy pixels in the level2.evt file, extra rows are filled as -1
| Pixel properties | Quadrant properties | ||||||
|---|---|---|---|---|---|---|---|
| Quadrant | DetID | PixID | Counts | Sigma | Mean | Median | Sigma |
| A | 7 | 64 | 1958144 | 8895.79 | 901 | 878 | 220.0 |
| A | 4 | 13 | 74896 | 336.41 | 901 | 878 | 220.0 |
| A | 4 | 236 | 16435 | 70.71 | 901 | 878 | 220.0 |
| B | 10 | 16 | 134609 | 696.48 | 903 | 869 | 192.0 |
| B | 0 | 213 | 75009 | 386.1 | 903 | 869 | 192.0 |
| B | 10 | 247 | 70308 | 361.62 | 903 | 869 | 192.0 |
| C | 15 | 224 | 1252287 | 5393.41 | 860 | 850 | 232.0 |
| C | 12 | 254 | 1139738 | 4908.35 | 860 | 850 | 232.0 |
| C | 12 | 252 | 159815 | 685.1 | 860 | 850 | 232.0 |
| D | 9 | 1 | 239233 | 973.96 | 883 | 843 | 244.8 |
| D | 3 | 12 | 147217 | 598.02 | 883 | 843 | 244.8 |
| D | 8 | 240 | 123636 | 501.68 | 883 | 843 | 244.8 |
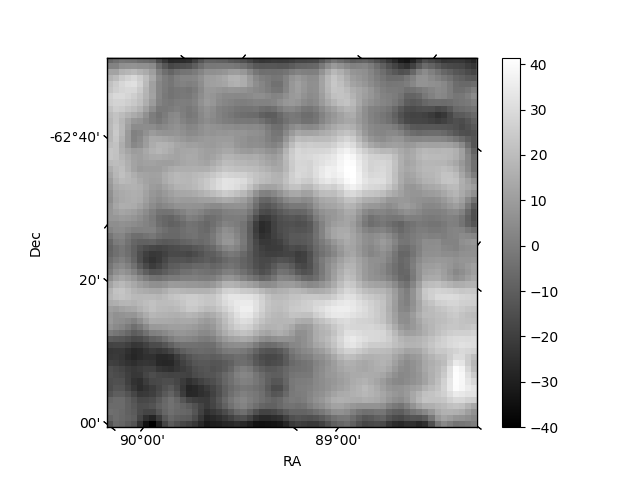
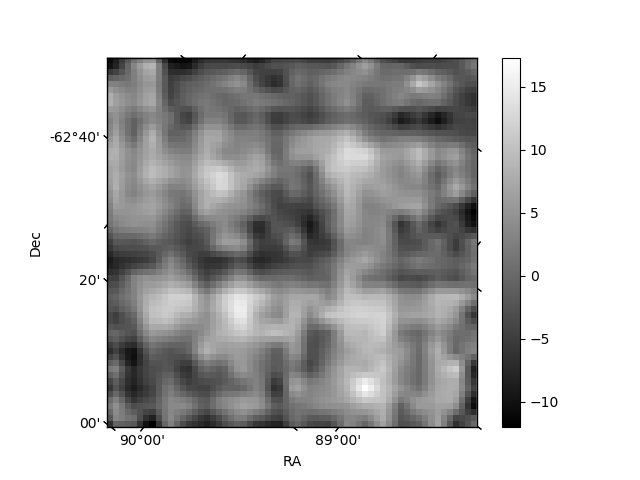
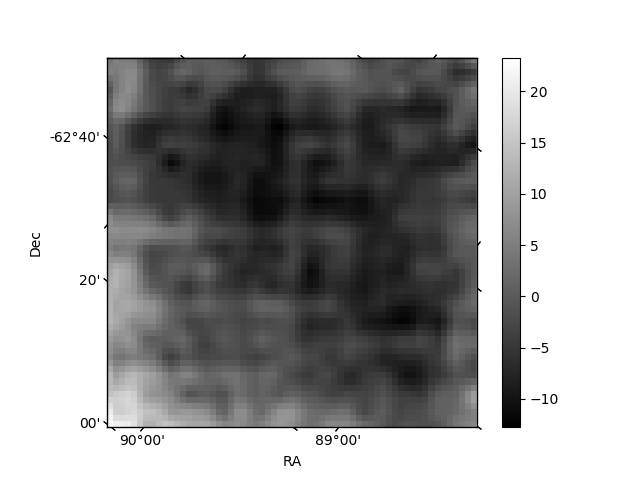
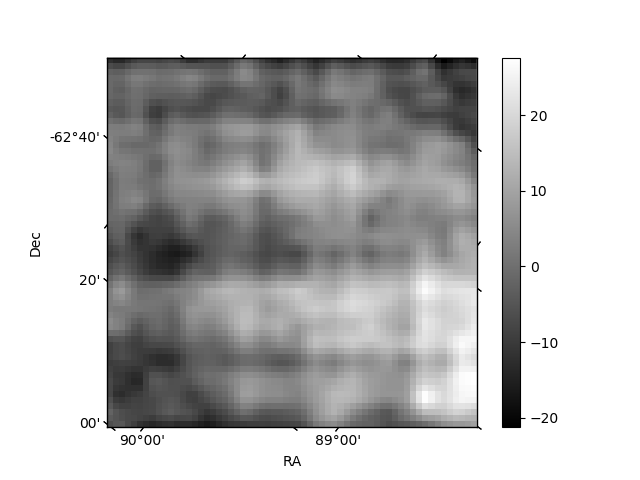
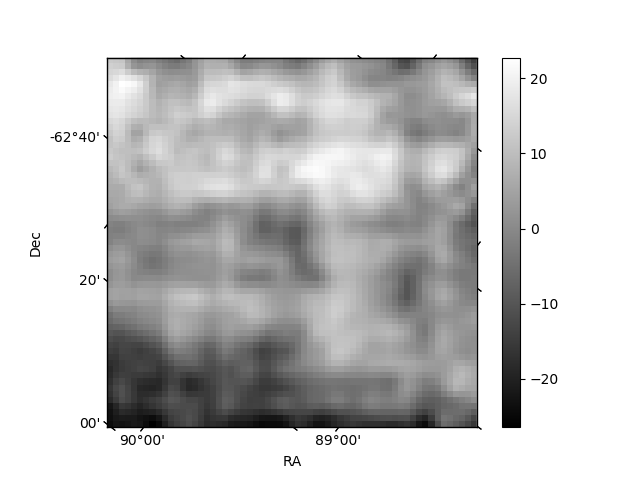
Histogram calculated using DETX and DETY for each event in the final _common_clean file
| Quadrant A | 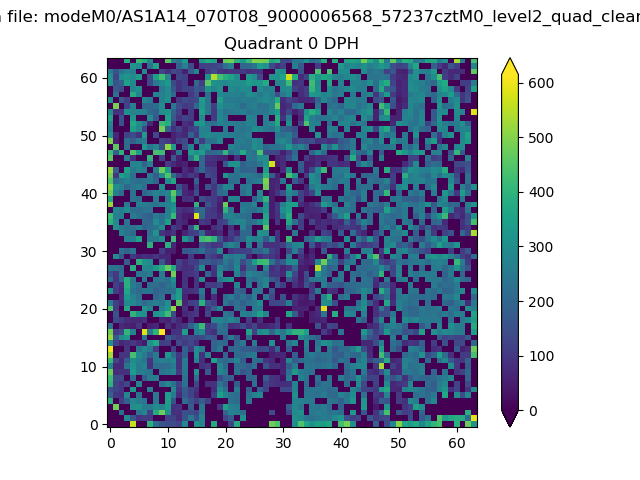 |
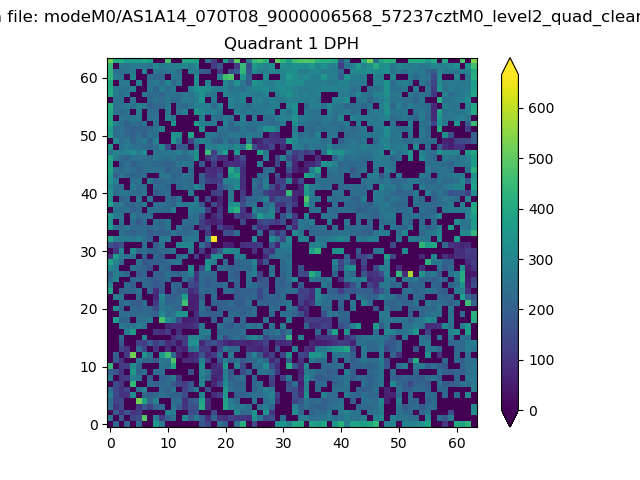 |
Quadrant B |
|---|---|---|---|
| Quadrant D | 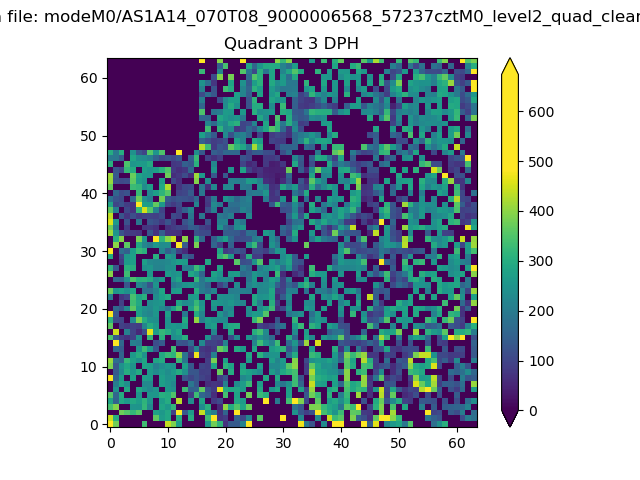 |
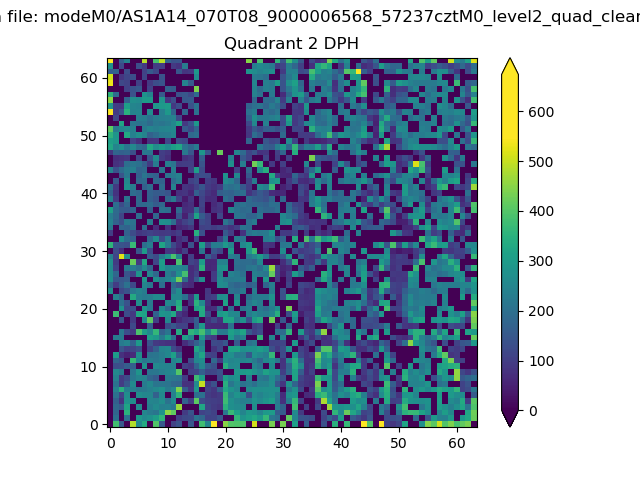 |
Quadrant C |
| Plot type | Count rate plots | Images |
|---|---|---|
| Comparison with Poisson distribution Blue bars denote a histogram of data divided into 1 sec bins. Red curve is a Poisson curve with rate = median count rate of data. |
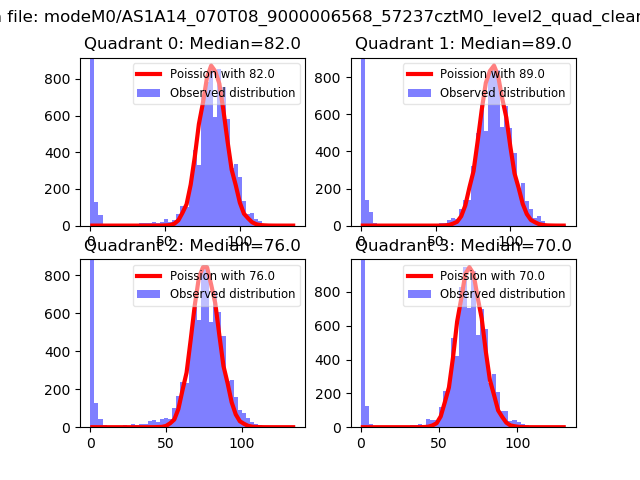 |
 |
| Quadrant-wise count rates Data is divided into 100 sec bins |
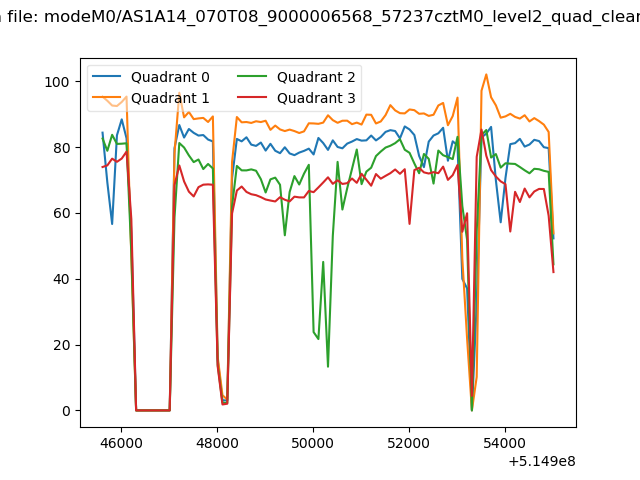 |
|
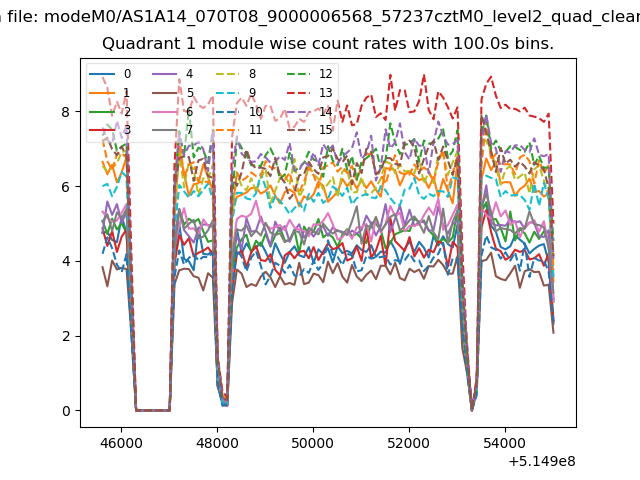
| Module-wise count rates for Quadrant A Data is divided into 100 sec bins |
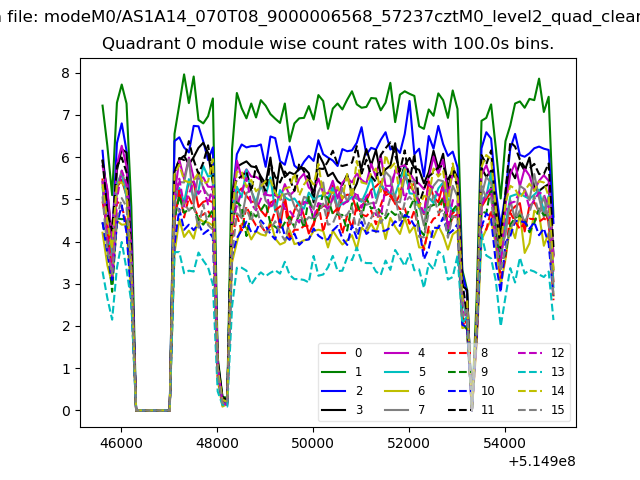 |
 |
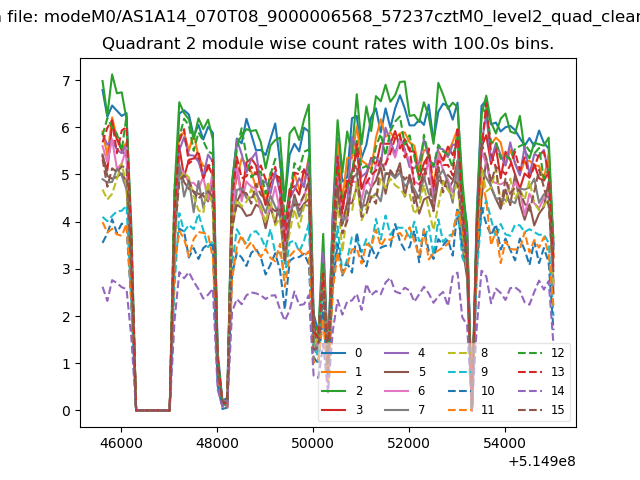
| Module-wise count rates for Quadrant B Data is divided into 100 sec bins |
 |
 |
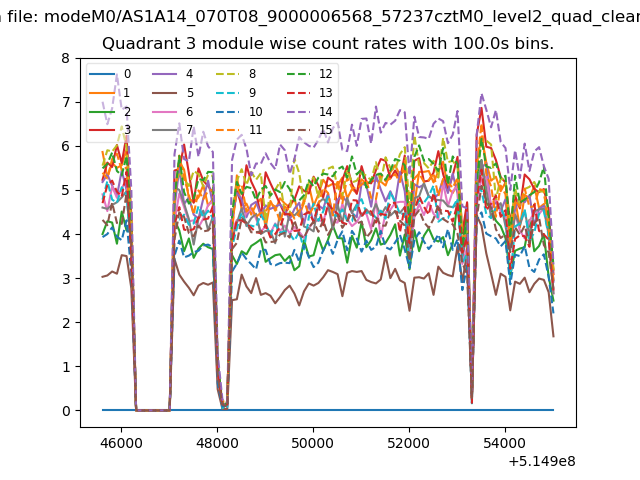
| Module-wise count rates for Quadrant C Data is divided into 100 sec bins |
 |
 |
| Module-wise count rates for Quadrant D Data is divided into 100 sec bins |
 |
 |
| Parameter | Plot |
|---|---|
| CZT HV Monitor | 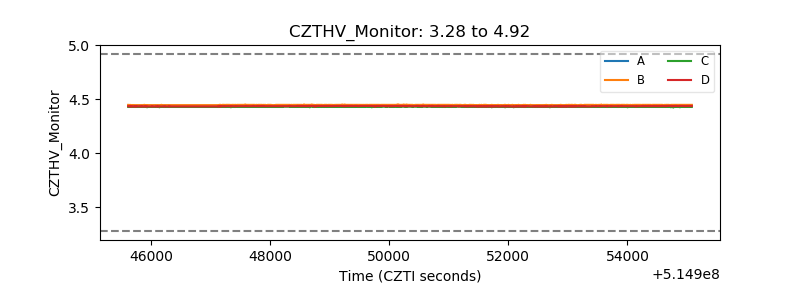 |
| D_VDD | 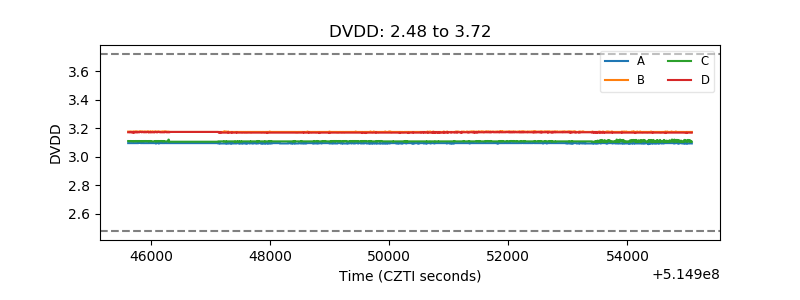 |
| Temperature 1 | 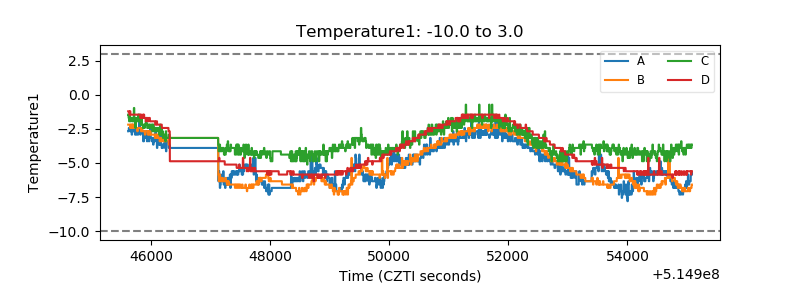 |
| Veto HV Monitor | 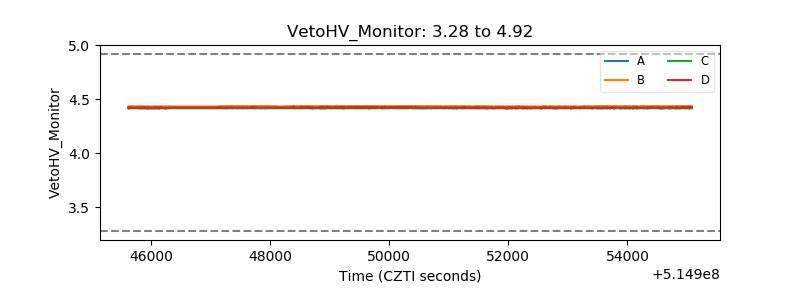 |
| Veto LLD | 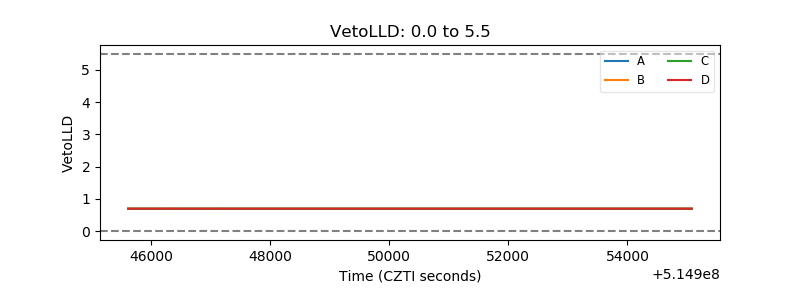 |
| Alpha Counter | 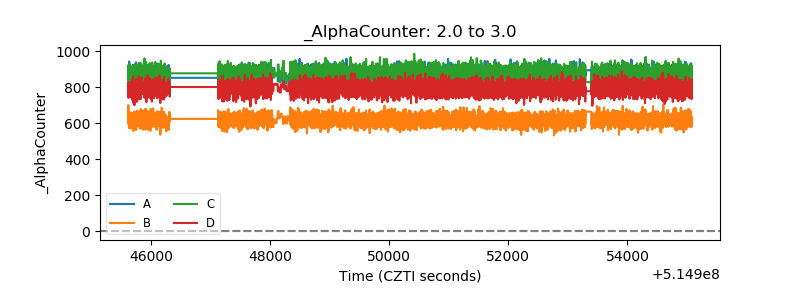 |
| _CPM_Rate | 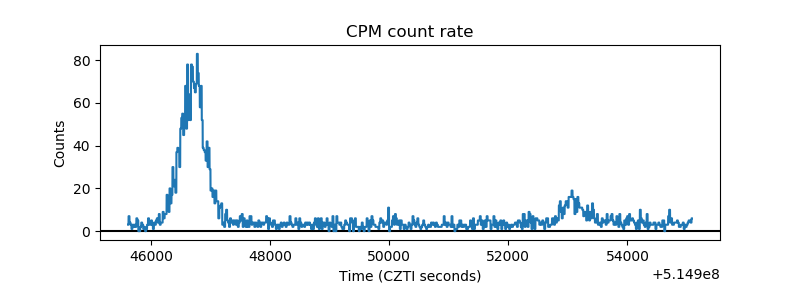 |
| CZT Counter | 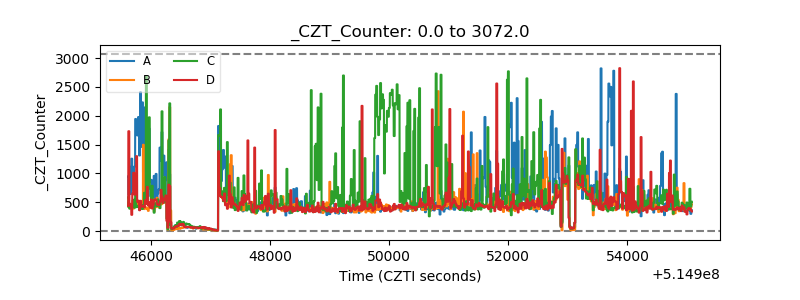 |
| +2.5 Volts monitor | 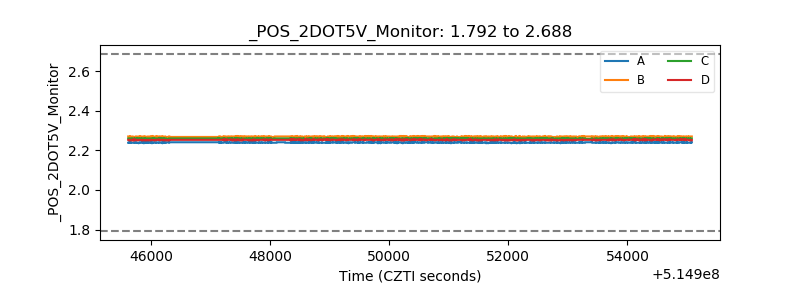 |
| +5 Volts monitor |  |
| _ROLL_ROT | 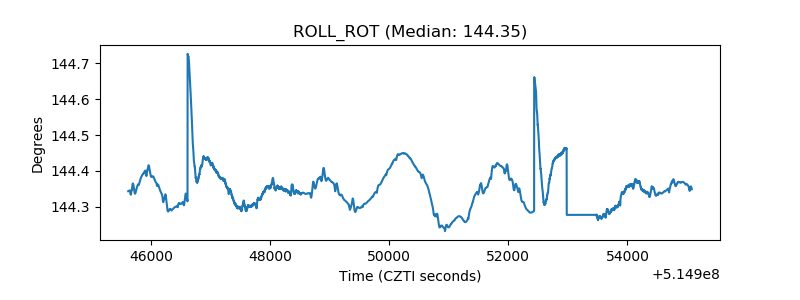 |
| _Roll_DEC | 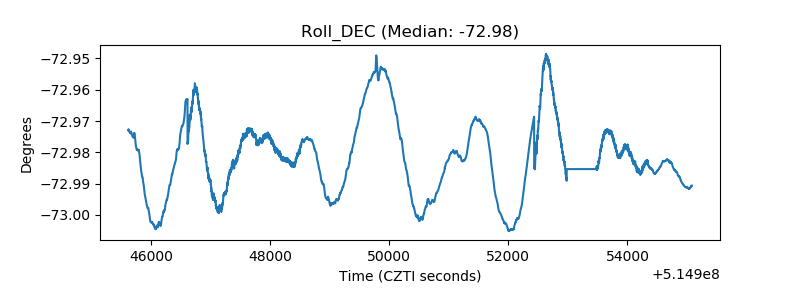 |
| _Roll_RA | 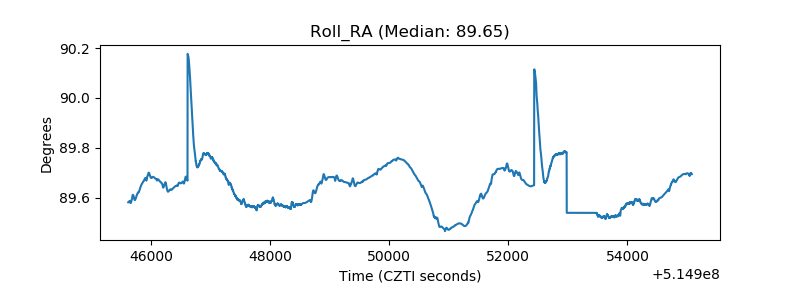 |
| Veto Counter | 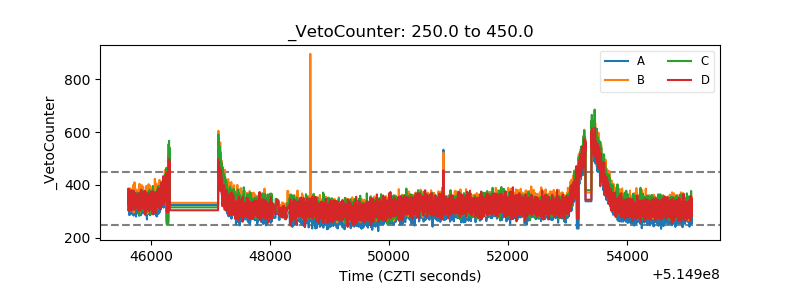 |