| Param | Original file | Final file |
|---|---|---|
| Filename | modeM0/AS1A14_070T08_9000006568_57242cztM0_level2.fits | modeM0/AS1A14_070T08_9000006568_57242cztM0_level2_quad_clean.evt |
| Size (bytes) | 1,361,157,120 | 262,805,760 |
| Size | 1.3 GB | 250.6 MB |
| Events in quadrant A | 9,309,735 | 1,762,951 |
| Events in quadrant B | 8,890,840 | 1,885,091 |
| Events in quadrant C | 20,734,376 | 1,387,673 |
| Events in quadrant D | 9,951,943 | 1,588,252 |
| Mode M9 | |||
|---|---|---|---|
| Quadrant | BADHDUFLAG | Total packets | Discarded packets |
| A | 0 | 11 | 0 |
| B | 0 | 11 | 0 |
| C | 0 | 11 | 0 |
| D | 0 | 11 | 0 |
| Mode SS | |||
|---|---|---|---|
| Quadrant | BADHDUFLAG | Total packets | Discarded packets |
| A | 0 | 390 | 0 |
| B | 0 | 390 | 0 |
| C | 0 | 390 | 0 |
| D | 0 | 390 | 0 |
| Mode M0 | |||
|---|---|---|---|
| Quadrant | BADHDUFLAG | Total packets | Discarded packets |
| A | 0 | 42348 | 2 |
| B | 0 | 40937 | 2 |
| C | 0 | 75248 | 2 |
| D | 0 | 42975 | 2 |
| Quadrant | Total seconds | Saturated seconds | Saturation percentage |
|---|---|---|---|
| A | 19348 | 475 | 2.455034% |
| B | 19348 | 533 | 2.754807% |
| C | 19349 | 4058 | 20.972660% |
| D | 19349 | 445 | 2.299860% |
Noise dominated data is calculated using 1-second bins in cleaned event files. If a bin has >2000 counts, and if more than 50% of those come from <1% of pixels, then it is considered to be noise-dominated and hence unusable.
| Quadrant | # 1 sec bins | Bins with >0 counts | Bins with >2000 counts | High rate bins dominated by noise | Noise dominated (total time) | Noise dominated (detector-on time) | Marked lightcurve |
|---|---|---|---|---|---|---|---|
| A | 20408 | 19349 | 80 | 80 | 0.39% | 0.41% | 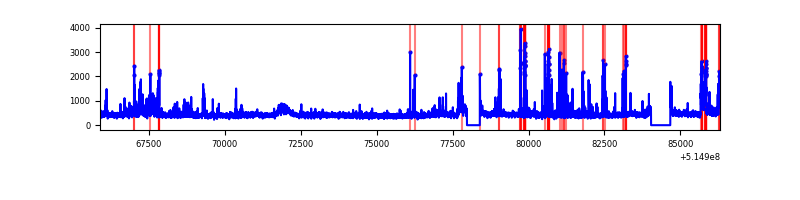 |
| B | 20408 | 19348 | 58 | 58 | 0.28% | 0.30% | 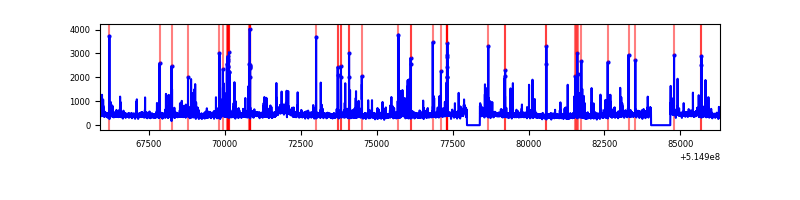 |
| C | 20409 | 19349 | 3003 | 3003 | 14.71% | 15.52% | 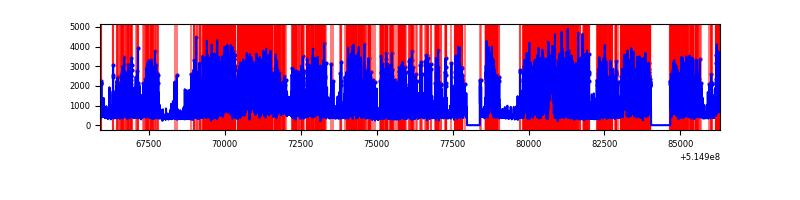 |
| D | 20409 | 19350 | 124 | 124 | 0.61% | 0.64% | 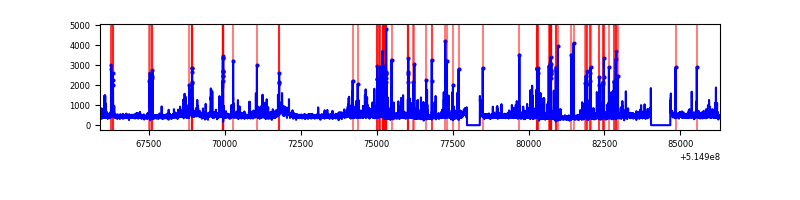 |
Top three noisy pixels from each quadrant. If the there are fewer than three noisy pixels in the level2.evt file, extra rows are filled as -1
| Pixel properties | Quadrant properties | ||||||
|---|---|---|---|---|---|---|---|
| Quadrant | DetID | PixID | Counts | Sigma | Mean | Median | Sigma |
| A | 7 | 64 | 1203583 | 2372.85 | 2056 | 2006 | 506.4 |
| A | 10 | 251 | 58358 | 111.28 | 2056 | 2006 | 506.4 |
| A | 4 | 13 | 33109 | 61.42 | 2056 | 2006 | 506.4 |
| B | 7 | 252 | 163357 | 373.0 | 2023 | 1942 | 432.8 |
| B | 0 | 245 | 153510 | 350.24 | 2023 | 1942 | 432.8 |
| B | 10 | 247 | 150641 | 343.61 | 2023 | 1942 | 432.8 |
| C | 15 | 224 | 10014395 | 20318.19 | 1828 | 1807 | 492.8 |
| C | 12 | 254 | 2917274 | 5916.25 | 1828 | 1807 | 492.8 |
| C | 12 | 252 | 283293 | 571.21 | 1828 | 1807 | 492.8 |
| D | 2 | 172 | 572437 | 1020.44 | 1995 | 1906 | 559.1 |
| D | 7 | 96 | 417481 | 743.29 | 1995 | 1906 | 559.1 |
| D | 8 | 240 | 206076 | 365.17 | 1995 | 1906 | 559.1 |
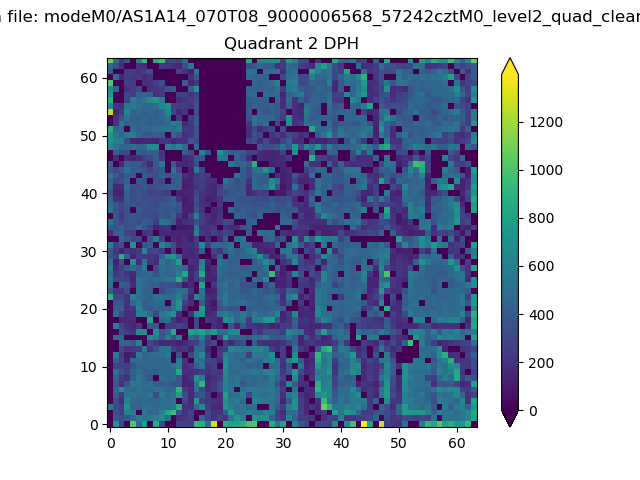
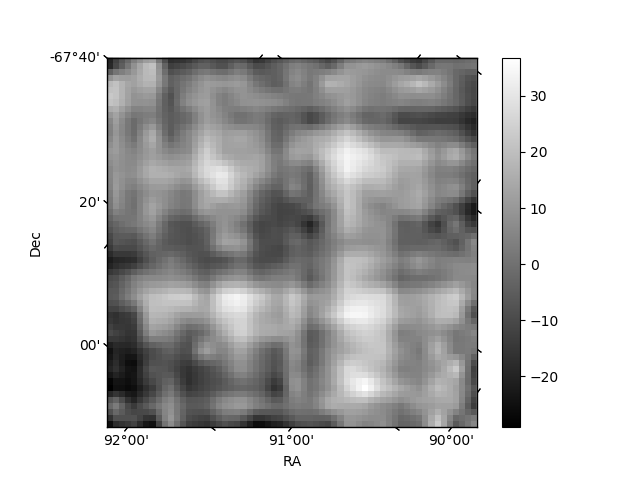
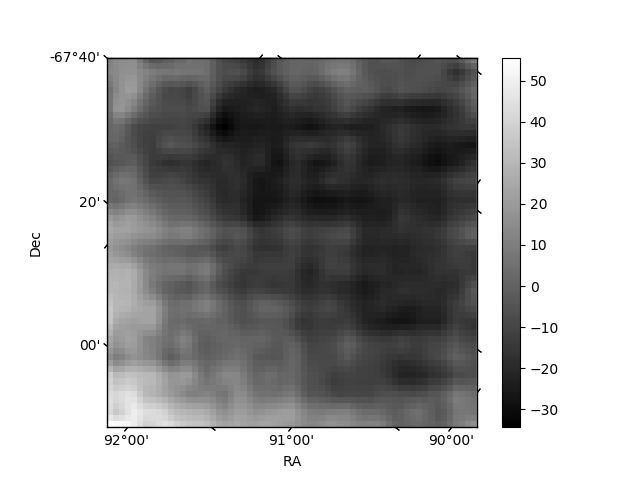
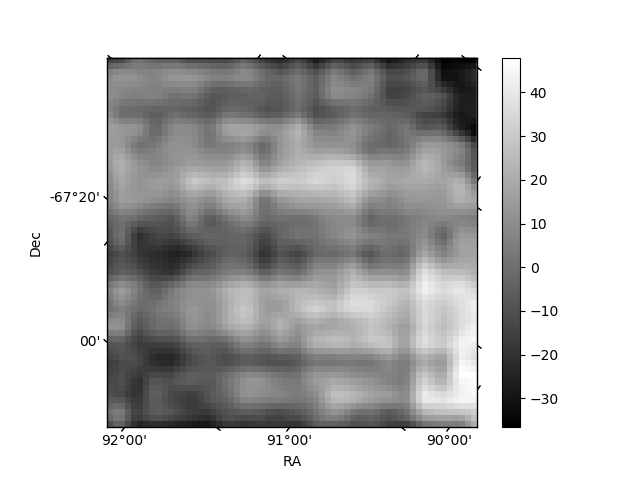
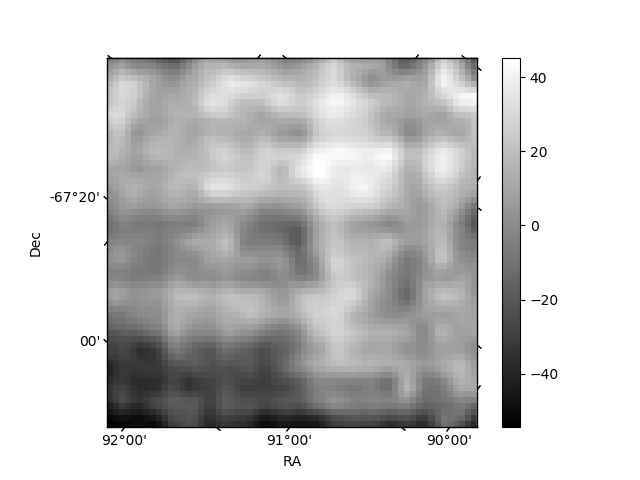
Histogram calculated using DETX and DETY for each event in the final _common_clean file
| Quadrant A | 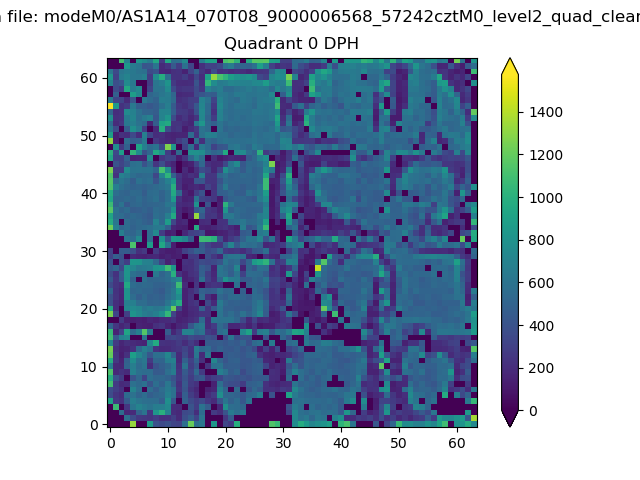 |
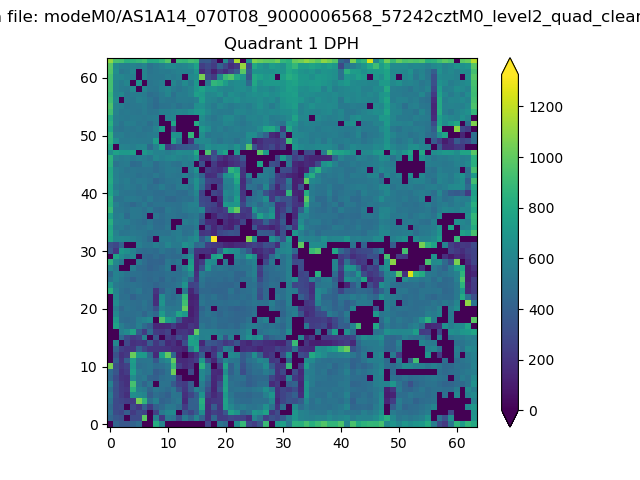 |
Quadrant B |
|---|---|---|---|
| Quadrant D | 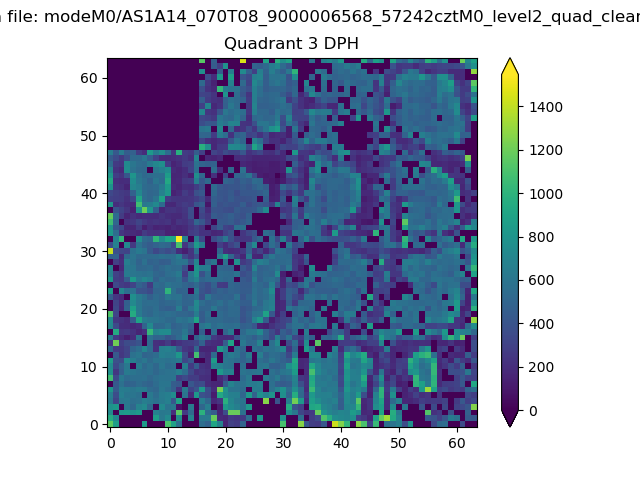 |
 |
Quadrant C |
| Plot type | Count rate plots | Images |
|---|---|---|
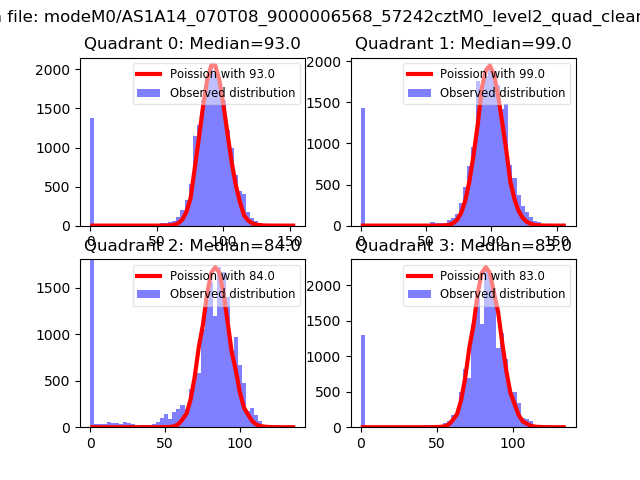
| Comparison with Poisson distribution Blue bars denote a histogram of data divided into 1 sec bins. Red curve is a Poisson curve with rate = median count rate of data. |
 |
 |
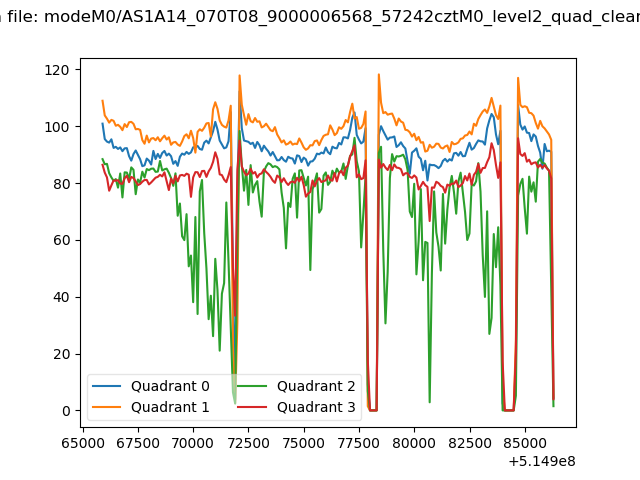
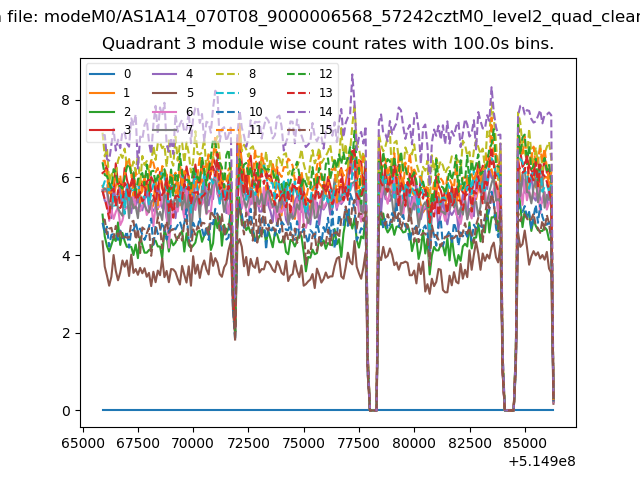
| Quadrant-wise count rates Data is divided into 100 sec bins |
 |
|
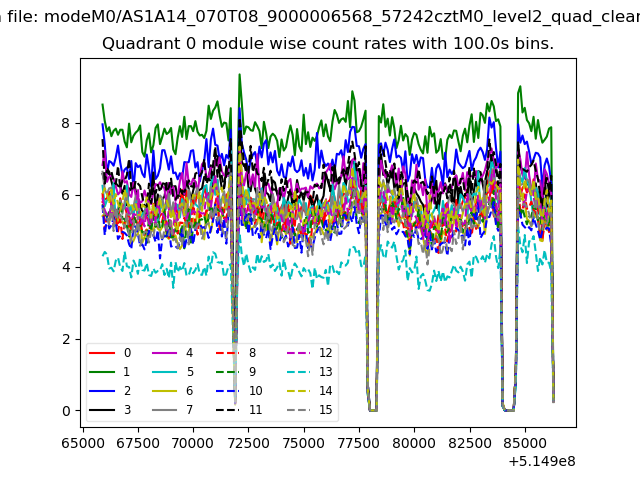
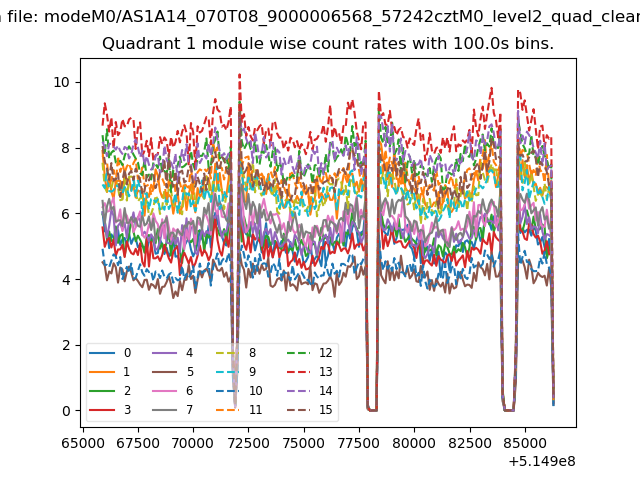
| Module-wise count rates for Quadrant A Data is divided into 100 sec bins |
 |
 |
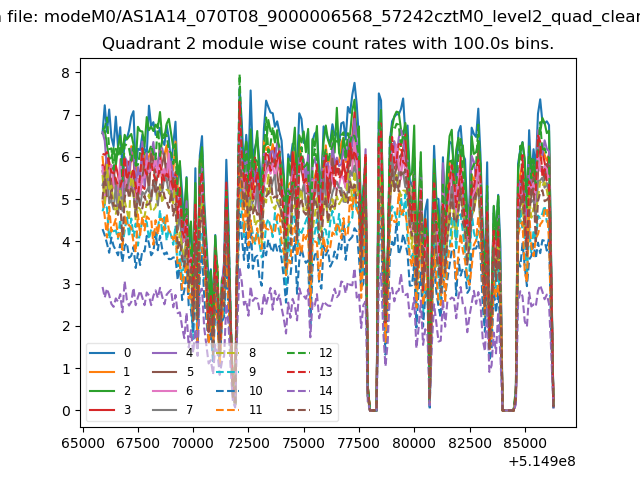
| Module-wise count rates for Quadrant B Data is divided into 100 sec bins |
 |
 |
| Module-wise count rates for Quadrant C Data is divided into 100 sec bins |
 |
 |
| Module-wise count rates for Quadrant D Data is divided into 100 sec bins |
 |
 |
| Parameter | Plot |
|---|---|
| CZT HV Monitor | 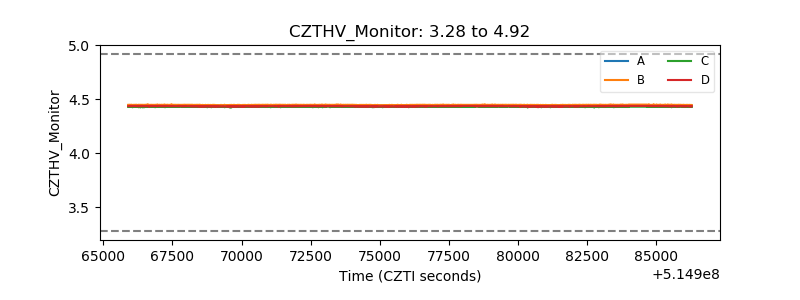 |
| D_VDD | 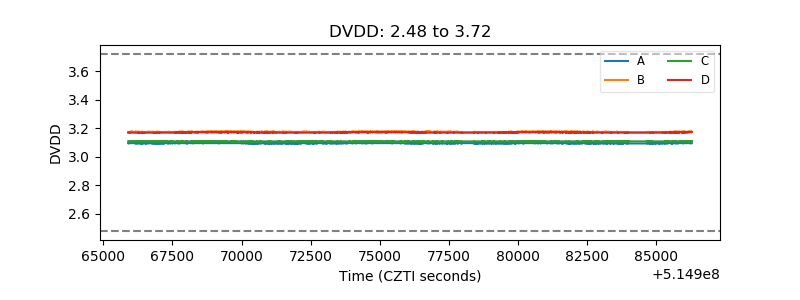 |
| Temperature 1 | 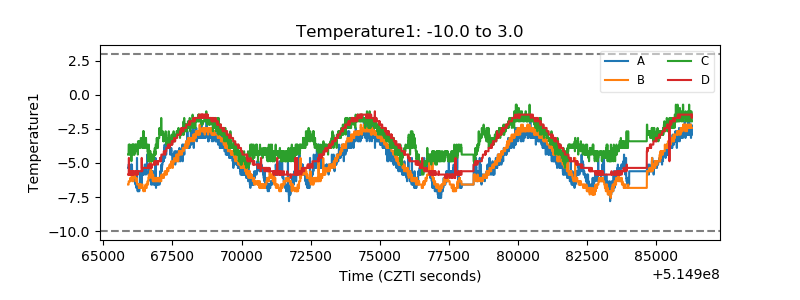 |
| Veto HV Monitor | 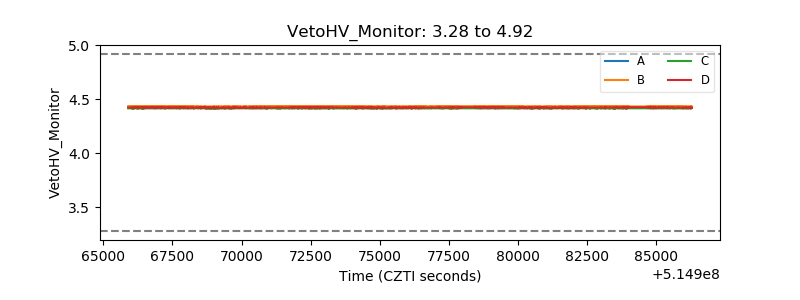 |
| Veto LLD | 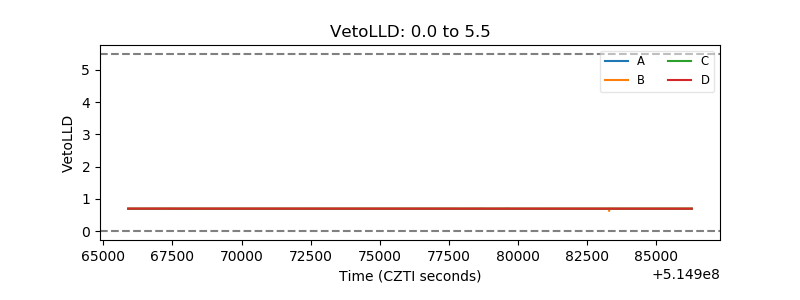 |
| Alpha Counter | 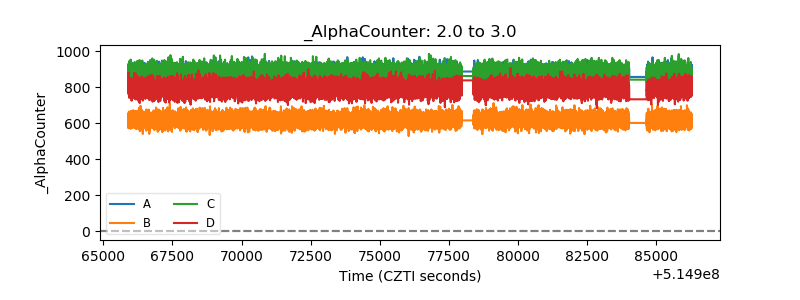 |
| _CPM_Rate | 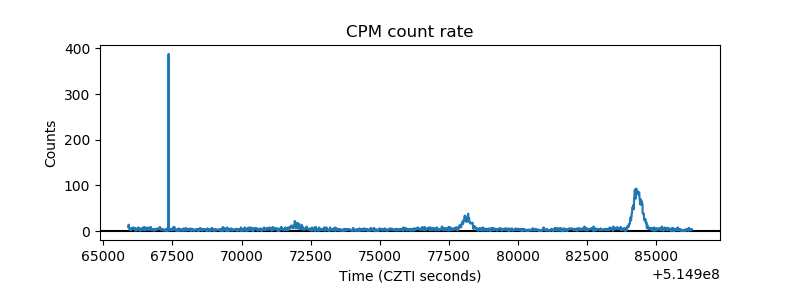 |
| CZT Counter | 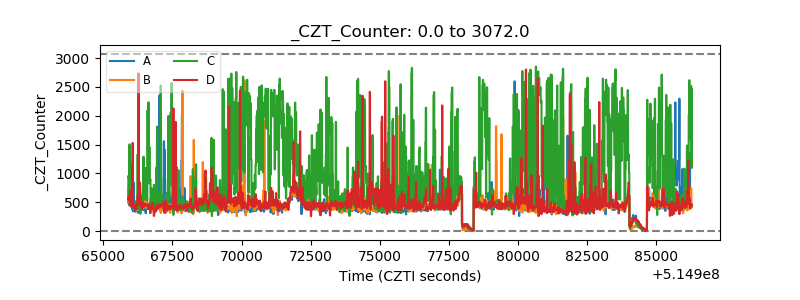 |
| +2.5 Volts monitor |  |
| +5 Volts monitor |  |
| _ROLL_ROT | 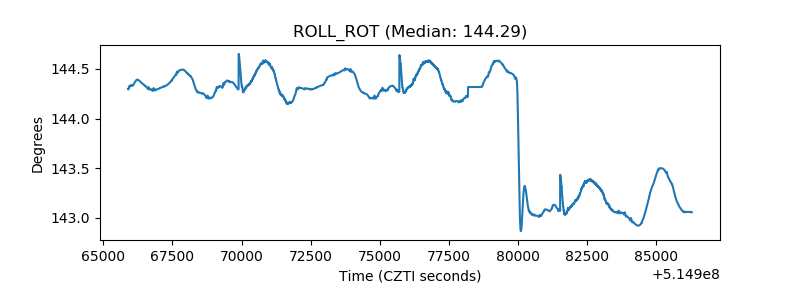 |
| _Roll_DEC | 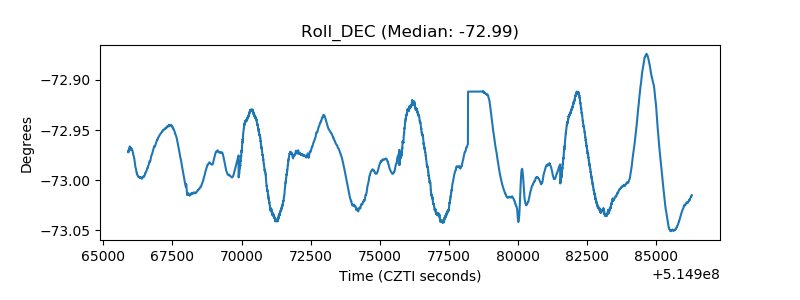 |
| _Roll_RA | 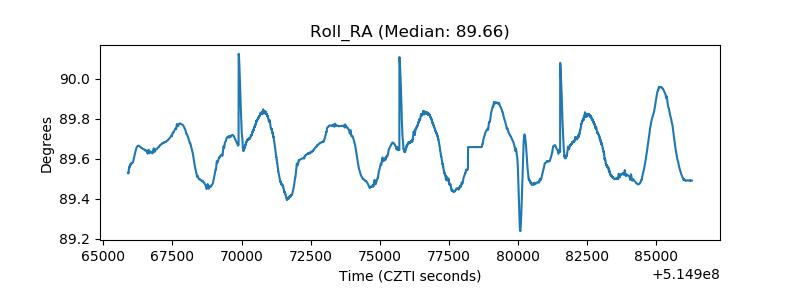 |
| Veto Counter | 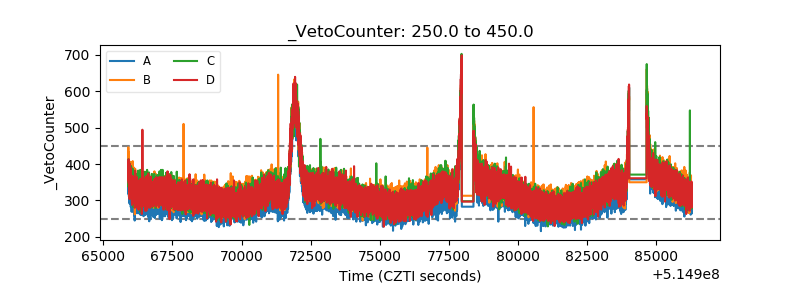 |