| Param | Original file | Final file |
|---|---|---|
| Filename | modeM0/AS1A14_070T08_9000006568_57246cztM0_level2.fits | modeM0/AS1A14_070T08_9000006568_57246cztM0_level2_quad_clean.evt |
| Size (bytes) | 419,005,440 | 87,393,600 |
| Size | 399.6 MB | 83.3 MB |
| Events in quadrant A | 4,480,110 | 554,635 |
| Events in quadrant B | 3,569,782 | 612,434 |
| Events in quadrant C | 4,091,010 | 536,754 |
| Events in quadrant D | 2,902,671 | 523,205 |
| Mode M9 | |||
|---|---|---|---|
| Quadrant | BADHDUFLAG | Total packets | Discarded packets |
| A | 0 | 11 | 0 |
| B | 0 | 11 | 0 |
| C | 0 | 11 | 0 |
| D | 0 | 11 | 0 |
| Mode SS | |||
|---|---|---|---|
| Quadrant | BADHDUFLAG | Total packets | Discarded packets |
| A | 0 | 122 | 0 |
| B | 0 | 122 | 0 |
| C | 0 | 122 | 0 |
| D | 0 | 122 | 0 |
| Mode M0 | |||
|---|---|---|---|
| Quadrant | BADHDUFLAG | Total packets | Discarded packets |
| A | 0 | 17513 | 1 |
| B | 0 | 14920 | 1 |
| C | 0 | 16565 | 1 |
| D | 0 | 12999 | 1 |
| Quadrant | Total seconds | Saturated seconds | Saturation percentage |
|---|---|---|---|
| A | 5999 | 374 | 6.234372% |
| B | 6000 | 221 | 3.683333% |
| C | 6000 | 245 | 4.083333% |
| D | 6000 | 32 | 0.533333% |
Noise dominated data is calculated using 1-second bins in cleaned event files. If a bin has >2000 counts, and if more than 50% of those come from <1% of pixels, then it is considered to be noise-dominated and hence unusable.
| Quadrant | # 1 sec bins | Bins with >0 counts | Bins with >2000 counts | High rate bins dominated by noise | Noise dominated (total time) | Noise dominated (detector-on time) | Marked lightcurve |
|---|---|---|---|---|---|---|---|
| A | 7114 | 6000 | 336 | 336 | 4.72% | 5.60% | 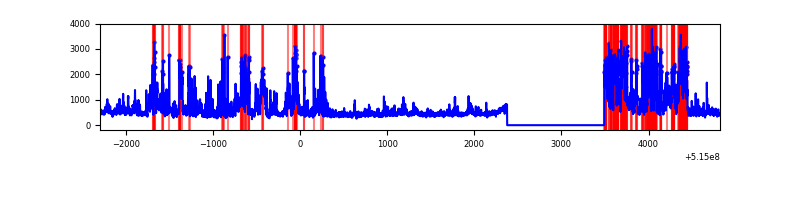 |
| B | 7115 | 6001 | 152 | 152 | 2.14% | 2.53% | 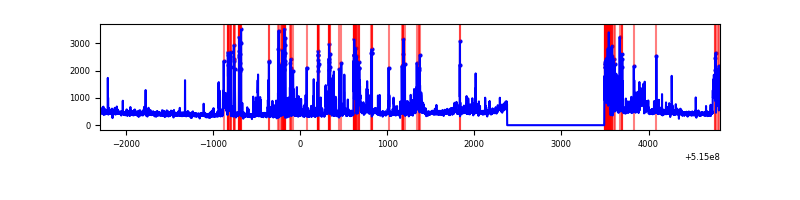 |
| C | 7115 | 6000 | 209 | 209 | 2.94% | 3.48% | 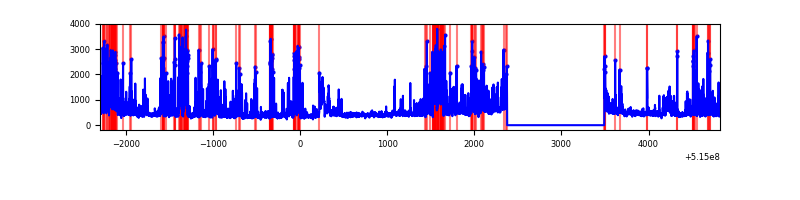 |
| D | 7115 | 6001 | 31 | 31 | 0.44% | 0.52% | 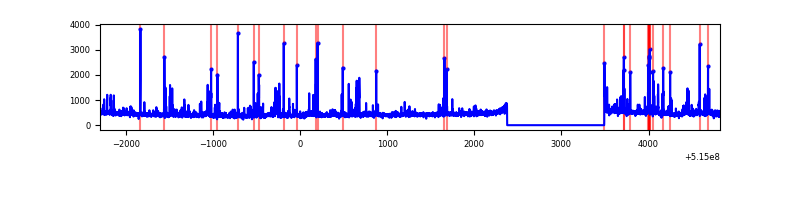 |
Top three noisy pixels from each quadrant. If the there are fewer than three noisy pixels in the level2.evt file, extra rows are filled as -1
| Pixel properties | Quadrant properties | ||||||
|---|---|---|---|---|---|---|---|
| Quadrant | DetID | PixID | Counts | Sigma | Mean | Median | Sigma |
| A | 7 | 64 | 1987451 | 12808.97 | 622 | 605 | 155.1 |
| A | 4 | 13 | 39099 | 248.16 | 622 | 605 | 155.1 |
| A | 3 | 46 | 14737 | 91.1 | 622 | 605 | 155.1 |
| B | 5 | 185 | 554700 | 4156.58 | 618 | 596 | 133.3 |
| B | 10 | 16 | 147547 | 1102.35 | 618 | 596 | 133.3 |
| B | 7 | 252 | 146684 | 1095.87 | 618 | 596 | 133.3 |
| C | 15 | 224 | 1314575 | 8021.44 | 597 | 591 | 163.8 |
| C | 12 | 252 | 184513 | 1122.78 | 597 | 591 | 163.8 |
| C | 12 | 254 | 100452 | 609.62 | 597 | 591 | 163.8 |
| D | 3 | 224 | 121813 | 710.11 | 604 | 578 | 170.7 |
| D | 8 | 240 | 73568 | 427.53 | 604 | 578 | 170.7 |
| D | 7 | 96 | 60176 | 349.08 | 604 | 578 | 170.7 |
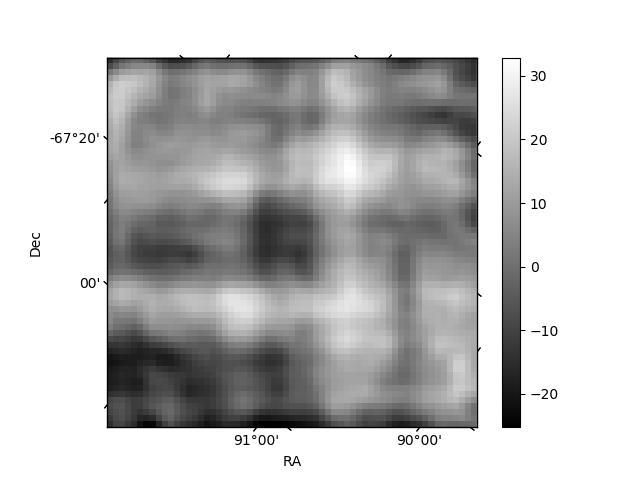
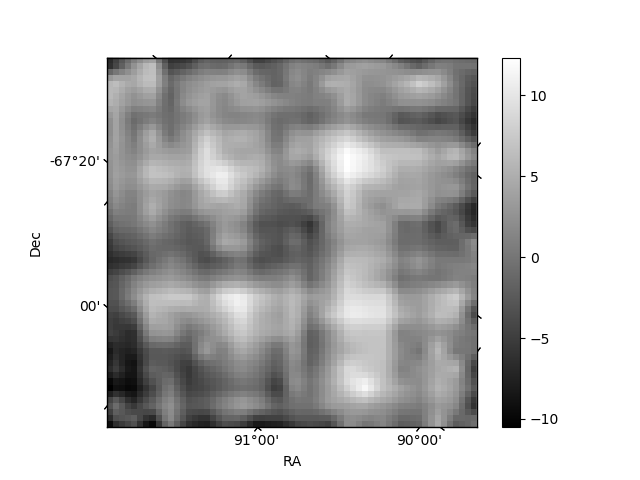
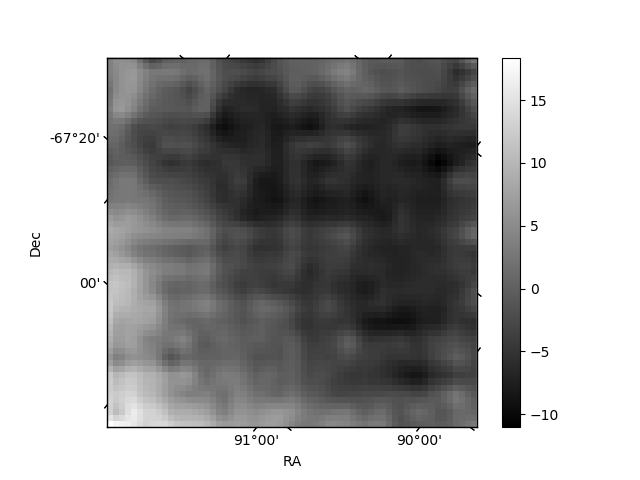
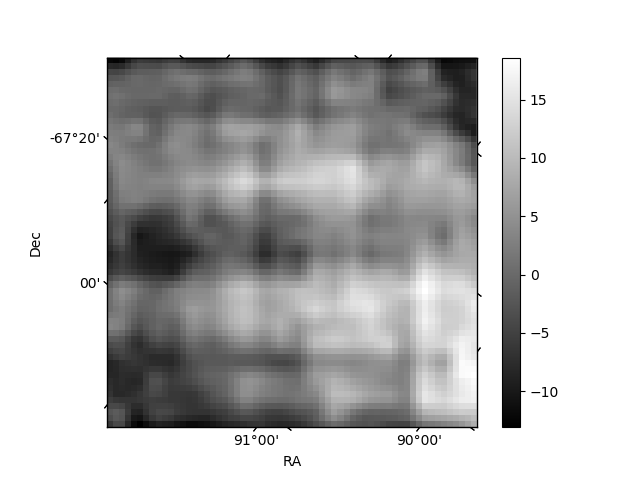
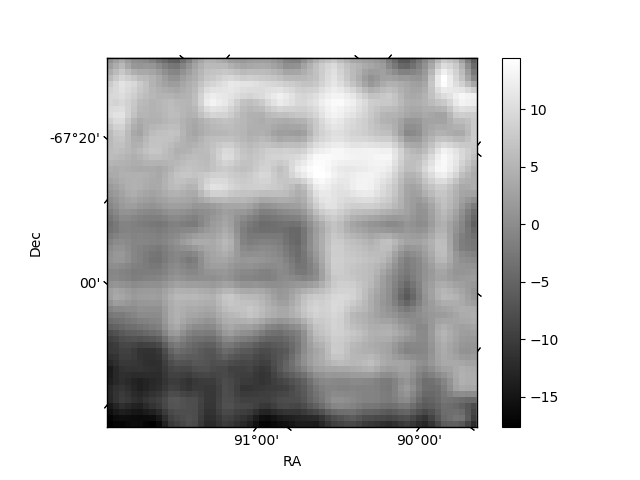
Histogram calculated using DETX and DETY for each event in the final _common_clean file
| Quadrant A | 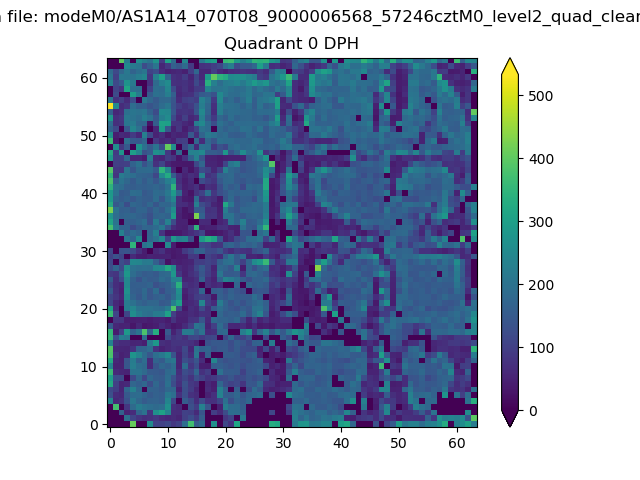 |
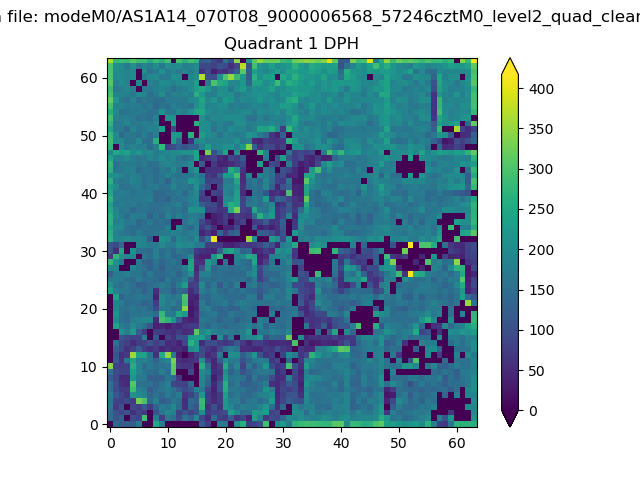 |
Quadrant B |
|---|---|---|---|
| Quadrant D | 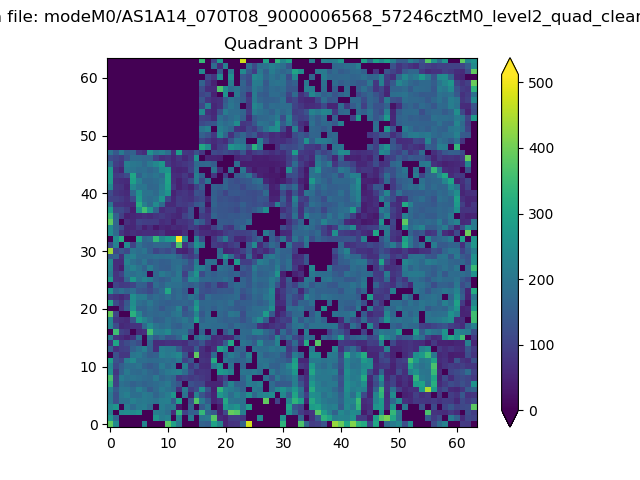 |
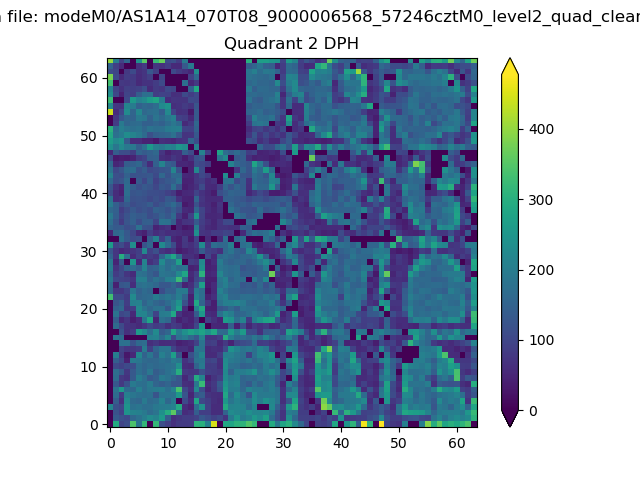 |
Quadrant C |
| Plot type | Count rate plots | Images |
|---|---|---|
| Comparison with Poisson distribution Blue bars denote a histogram of data divided into 1 sec bins. Red curve is a Poisson curve with rate = median count rate of data. |
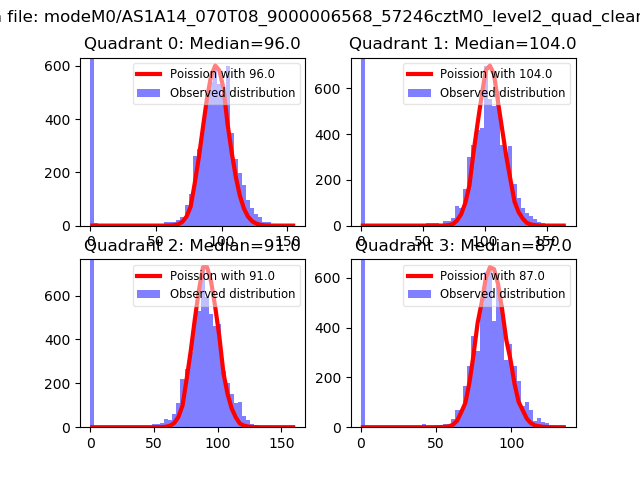 |
 |
| Quadrant-wise count rates Data is divided into 100 sec bins |
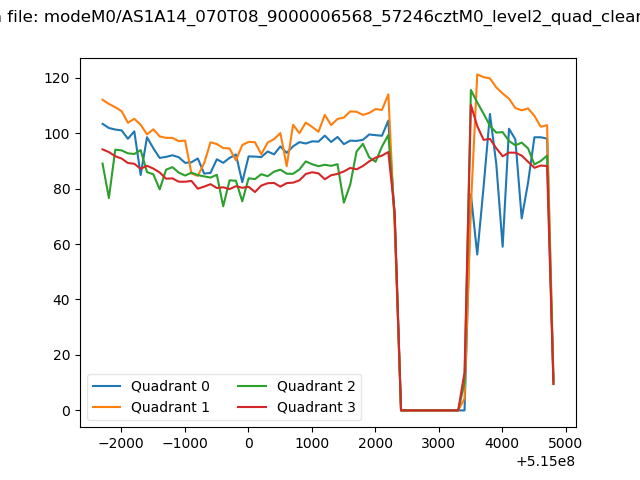 |
|
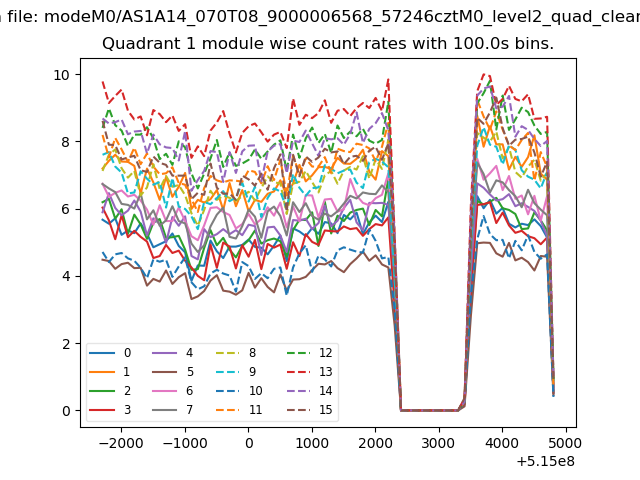
| Module-wise count rates for Quadrant A Data is divided into 100 sec bins |
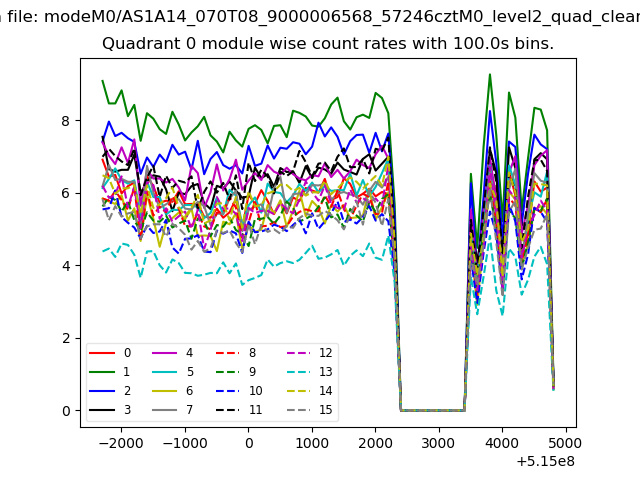 |
 |
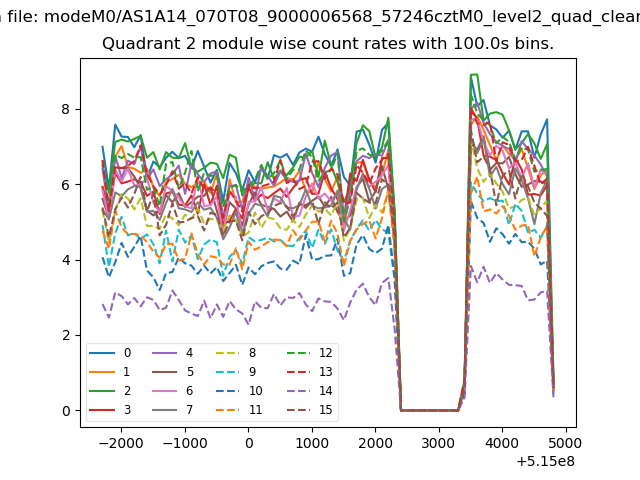
| Module-wise count rates for Quadrant B Data is divided into 100 sec bins |
 |
 |
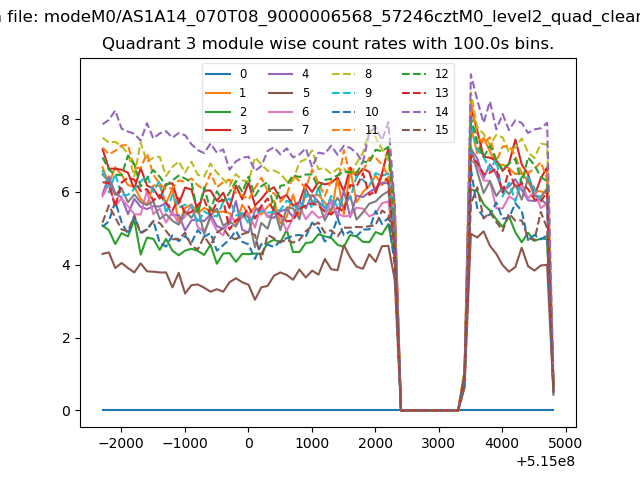
| Module-wise count rates for Quadrant C Data is divided into 100 sec bins |
 |
 |
| Module-wise count rates for Quadrant D Data is divided into 100 sec bins |
 |
 |
| Parameter | Plot |
|---|---|
| CZT HV Monitor | 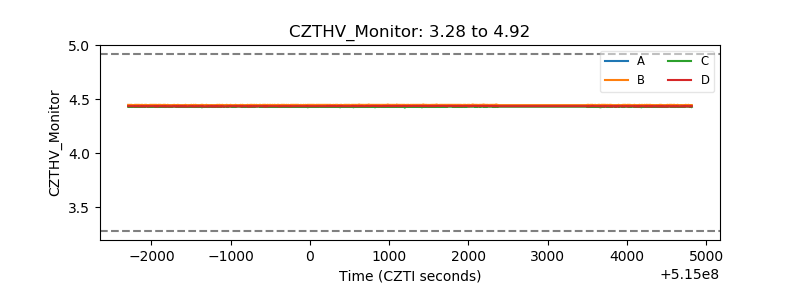 |
| D_VDD | 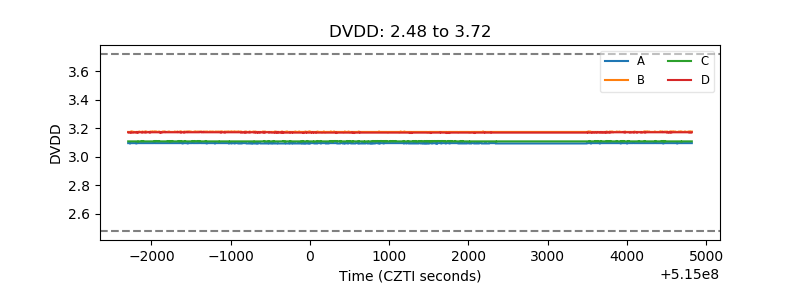 |
| Temperature 1 | 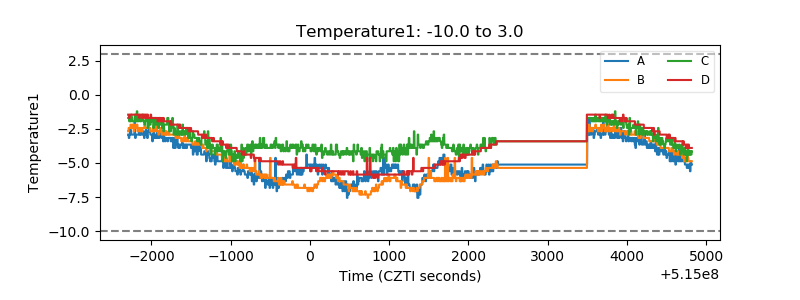 |
| Veto HV Monitor |  |
| Veto LLD | 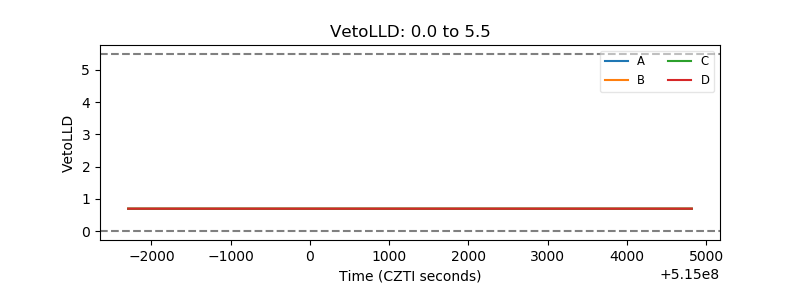 |
| Alpha Counter | 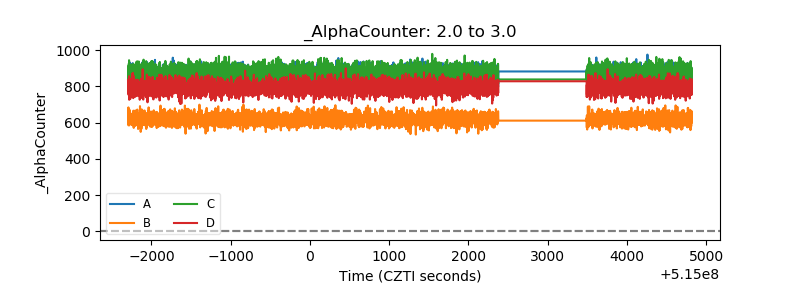 |
| _CPM_Rate | 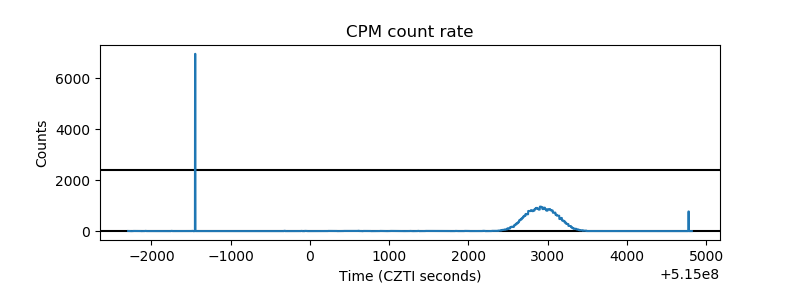 |
| CZT Counter | 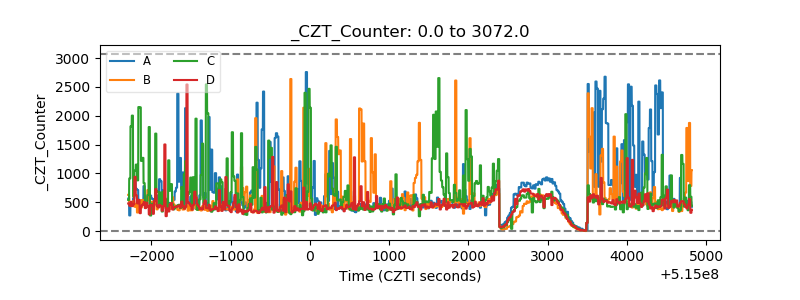 |
| +2.5 Volts monitor | 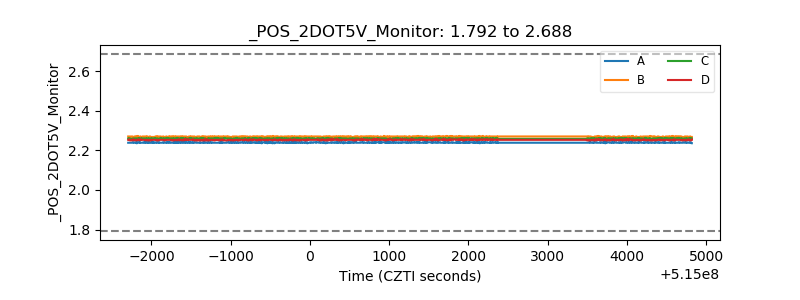 |
| +5 Volts monitor | 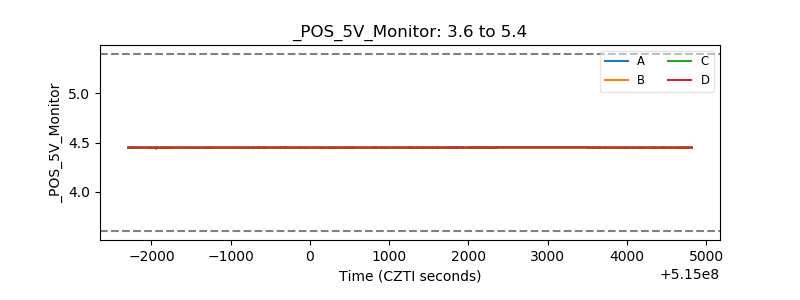 |
| _ROLL_ROT | 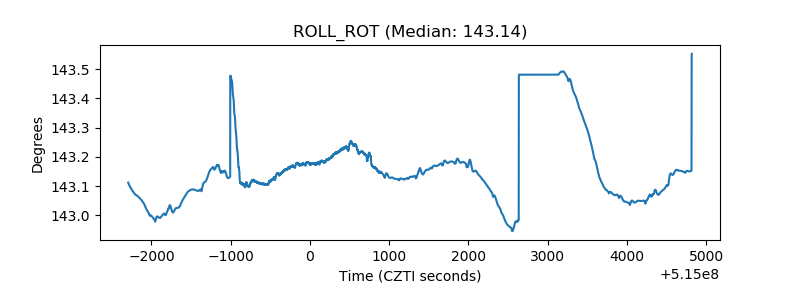 |
| _Roll_DEC | 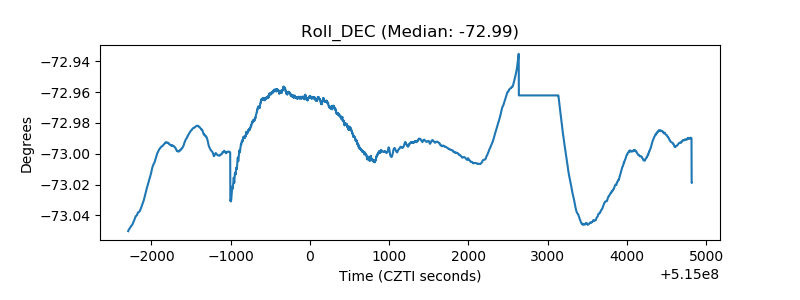 |
| _Roll_RA | 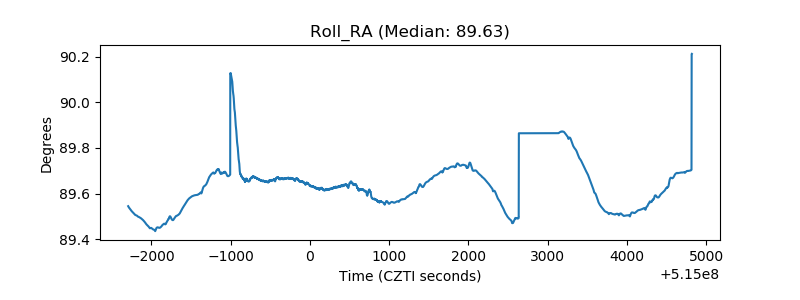 |
| Veto Counter | 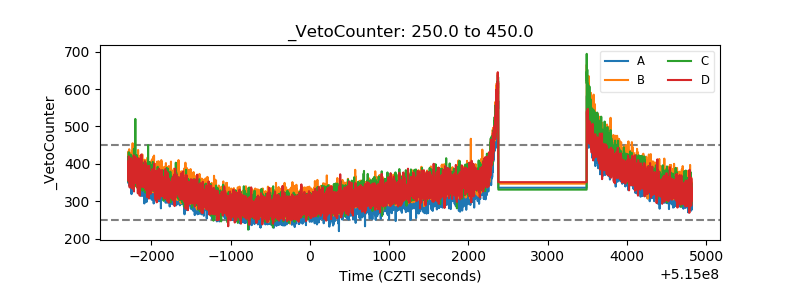 |