| Param | Original file | Final file |
|---|---|---|
| Filename | modeM0/AS1A14_070T08_9000006568_57251cztM0_level2.fits | modeM0/AS1A14_070T08_9000006568_57251cztM0_level2_quad_clean.evt |
| Size (bytes) | 490,852,800 | 99,803,520 |
| Size | 468.1 MB | 95.2 MB |
| Events in quadrant A | 3,737,353 | 672,968 |
| Events in quadrant B | 5,579,520 | 639,232 |
| Events in quadrant C | 5,032,920 | 609,915 |
| Events in quadrant D | 3,262,540 | 600,319 |
| Mode M9 | |||
|---|---|---|---|
| Quadrant | BADHDUFLAG | Total packets | Discarded packets |
| A | 0 | 16 | 0 |
| B | 0 | 16 | 0 |
| C | 0 | 16 | 0 |
| D | 0 | 16 | 0 |
| Mode SS | |||
|---|---|---|---|
| Quadrant | BADHDUFLAG | Total packets | Discarded packets |
| A | 0 | 148 | 0 |
| B | 0 | 148 | 0 |
| C | 0 | 148 | 0 |
| D | 0 | 148 | 0 |
| Mode M0 | |||
|---|---|---|---|
| Quadrant | BADHDUFLAG | Total packets | Discarded packets |
| A | 0 | 16345 | 2 |
| B | 0 | 21860 | 2 |
| C | 0 | 20292 | 2 |
| D | 0 | 15212 | 2 |
| Quadrant | Total seconds | Saturated seconds | Saturation percentage |
|---|---|---|---|
| A | 7171 | 52 | 0.725143% |
| B | 7171 | 985 | 13.735881% |
| C | 7171 | 412 | 5.745363% |
| D | 7171 | 33 | 0.460187% |
Noise dominated data is calculated using 1-second bins in cleaned event files. If a bin has >2000 counts, and if more than 50% of those come from <1% of pixels, then it is considered to be noise-dominated and hence unusable.
| Quadrant | # 1 sec bins | Bins with >0 counts | Bins with >2000 counts | High rate bins dominated by noise | Noise dominated (total time) | Noise dominated (detector-on time) | Marked lightcurve |
|---|---|---|---|---|---|---|---|
| A | 8771 | 7173 | 23 | 23 | 0.26% | 0.32% | 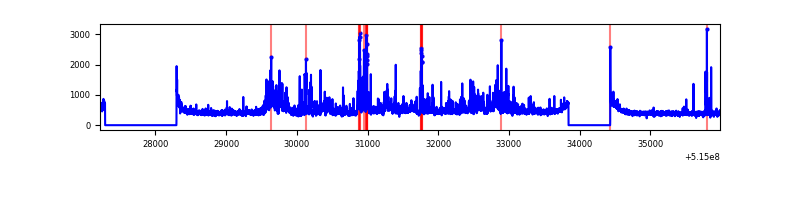 |
| B | 8771 | 7173 | 773 | 773 | 8.81% | 10.78% | 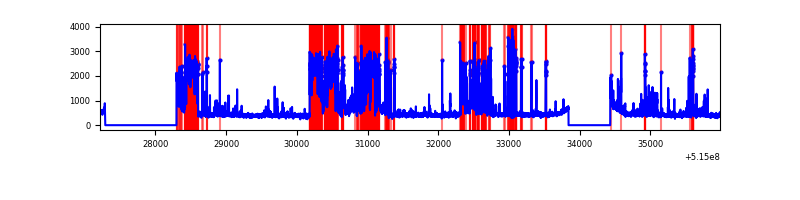 |
| C | 8771 | 7173 | 341 | 341 | 3.89% | 4.75% | 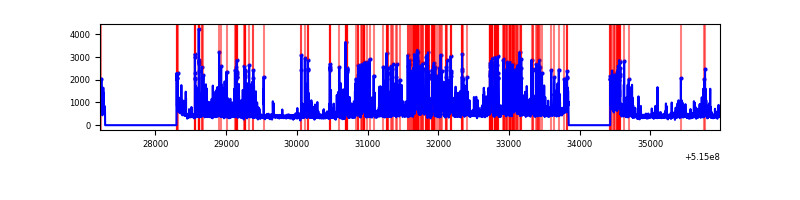 |
| D | 8771 | 7173 | 20 | 20 | 0.23% | 0.28% | 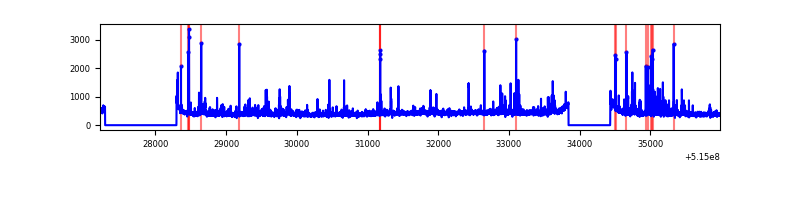 |
Top three noisy pixels from each quadrant. If the there are fewer than three noisy pixels in the level2.evt file, extra rows are filled as -1
| Pixel properties | Quadrant properties | ||||||
|---|---|---|---|---|---|---|---|
| Quadrant | DetID | PixID | Counts | Sigma | Mean | Median | Sigma |
| A | 7 | 64 | 733351 | 3992.1 | 749 | 728 | 183.5 |
| A | 4 | 13 | 64280 | 346.3 | 749 | 728 | 183.5 |
| A | 10 | 251 | 15401 | 79.95 | 749 | 728 | 183.5 |
| B | 5 | 185 | 2158652 | 14420.51 | 707 | 682 | 149.6 |
| B | 4 | 201 | 275557 | 1836.84 | 707 | 682 | 149.6 |
| B | 10 | 16 | 118672 | 788.46 | 707 | 682 | 149.6 |
| C | 15 | 224 | 2019186 | 10505.9 | 709 | 702 | 192.1 |
| C | 14 | 254 | 136619 | 707.43 | 709 | 702 | 192.1 |
| C | 12 | 252 | 32434 | 165.16 | 709 | 702 | 192.1 |
| D | 2 | 120 | 107275 | 520.5 | 723 | 691 | 204.8 |
| D | 3 | 224 | 93399 | 452.73 | 723 | 691 | 204.8 |
| D | 5 | 173 | 56637 | 273.21 | 723 | 691 | 204.8 |
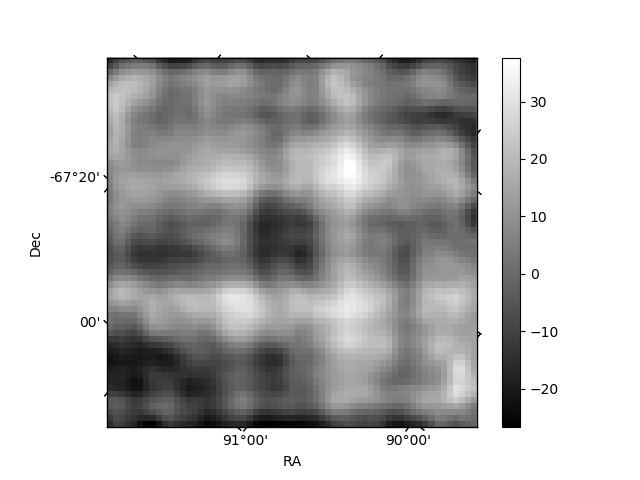
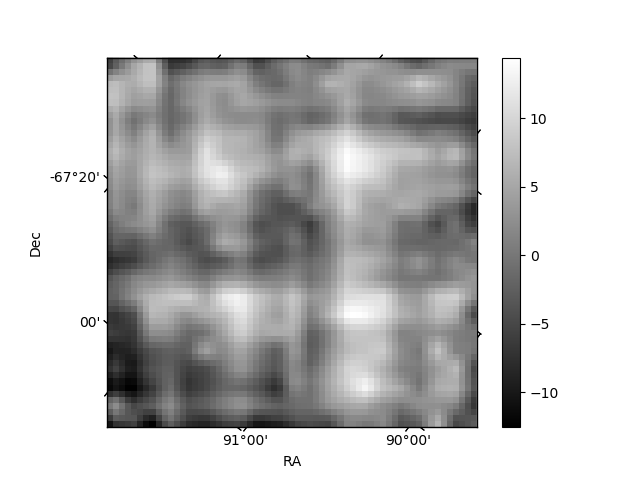
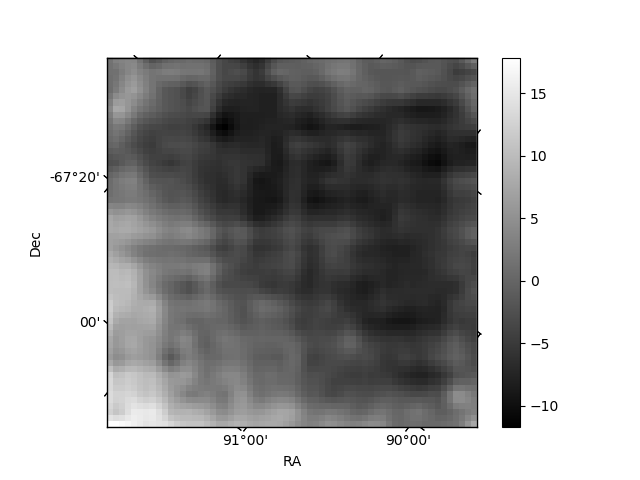
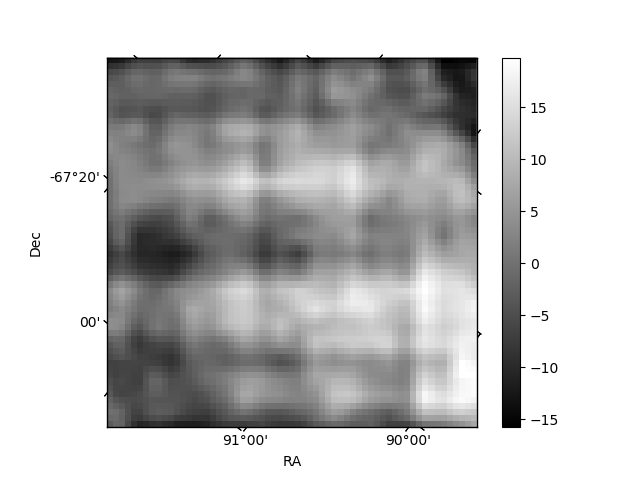
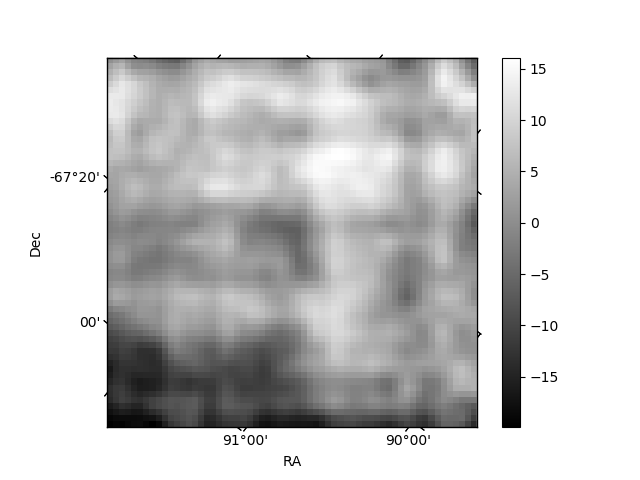
Histogram calculated using DETX and DETY for each event in the final _common_clean file
| Quadrant A | 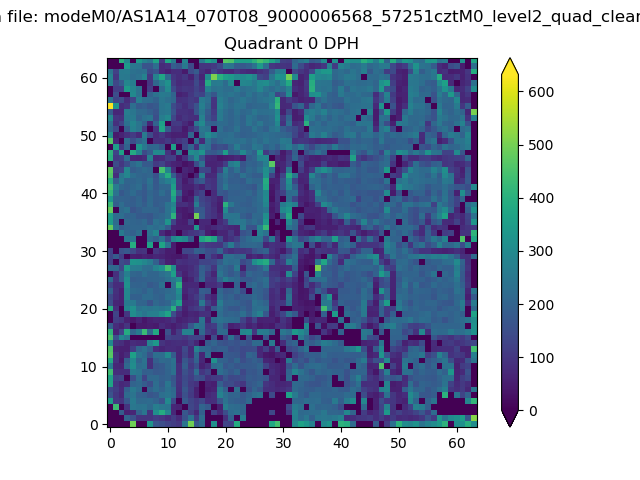 |
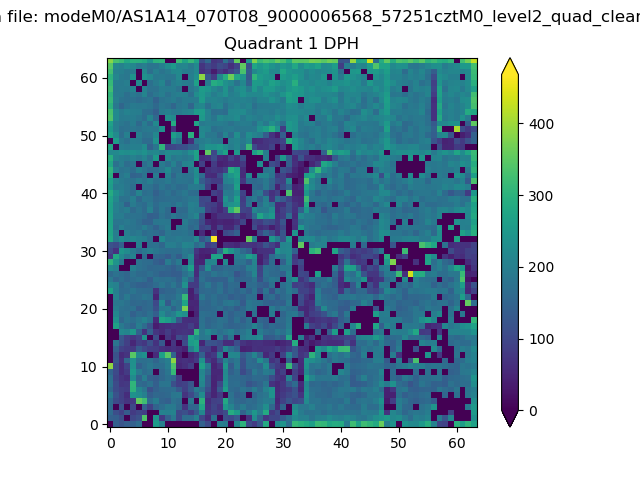 |
Quadrant B |
|---|---|---|---|
| Quadrant D | 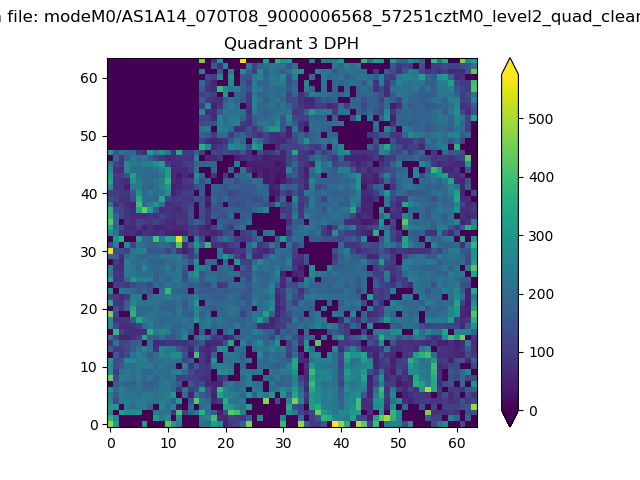 |
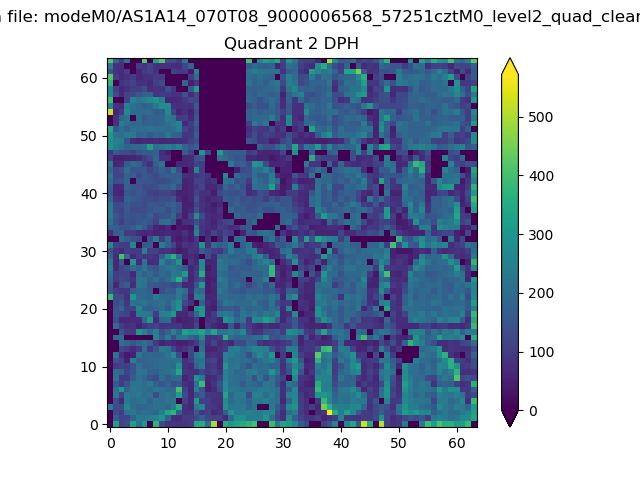 |
Quadrant C |
| Plot type | Count rate plots | Images |
|---|---|---|
| Comparison with Poisson distribution Blue bars denote a histogram of data divided into 1 sec bins. Red curve is a Poisson curve with rate = median count rate of data. |
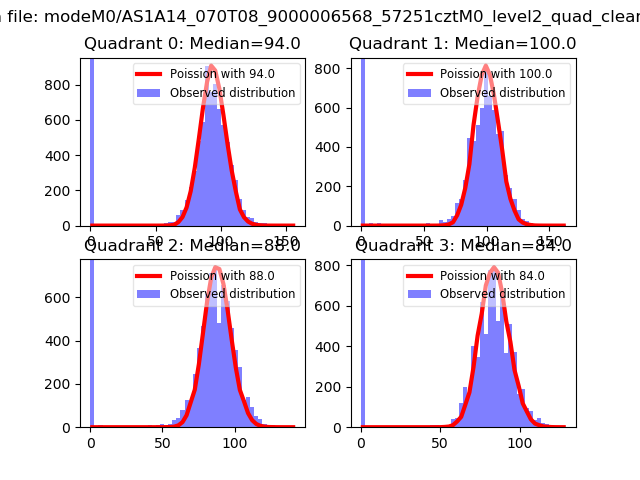 |
 |
| Quadrant-wise count rates Data is divided into 100 sec bins |
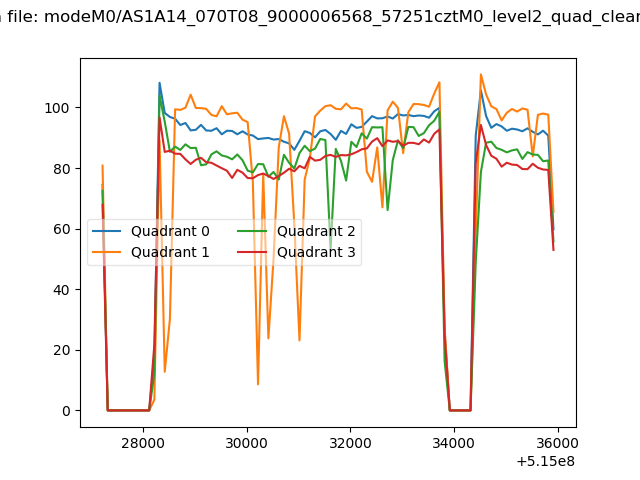 |
|
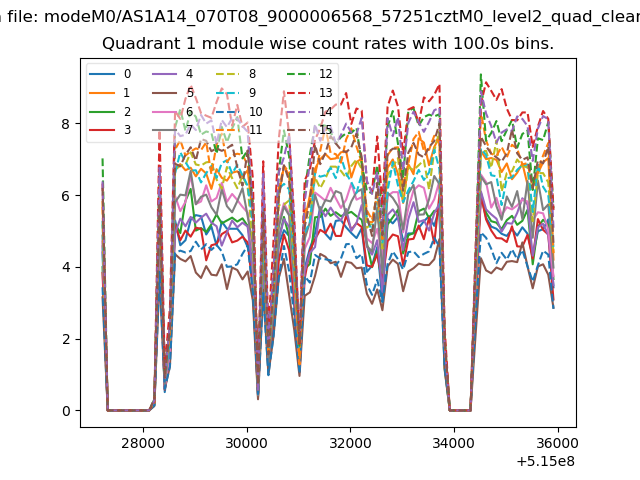
| Module-wise count rates for Quadrant A Data is divided into 100 sec bins |
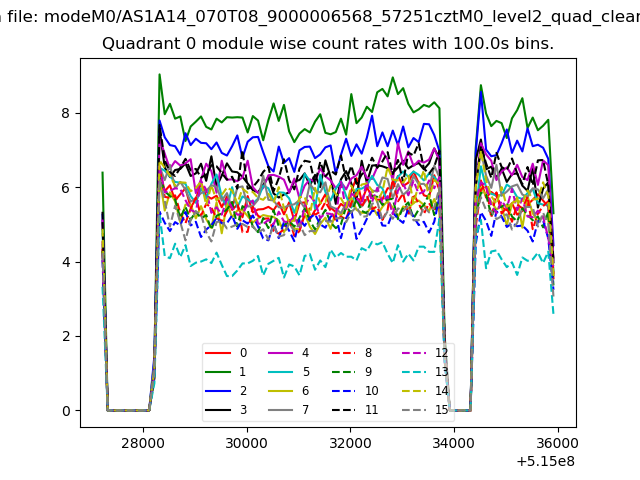 |
 |
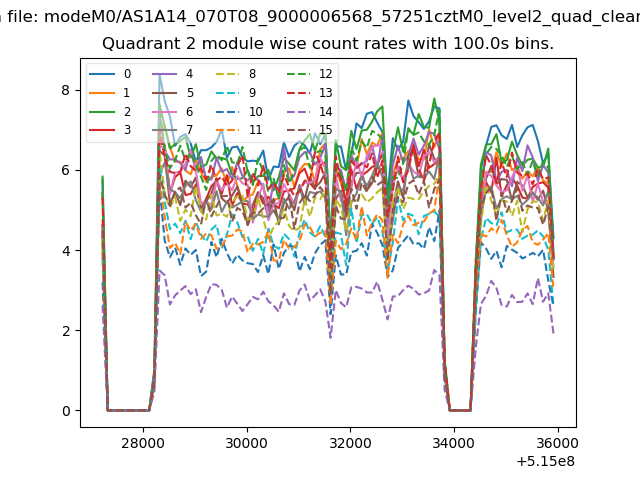
| Module-wise count rates for Quadrant B Data is divided into 100 sec bins |
 |
 |
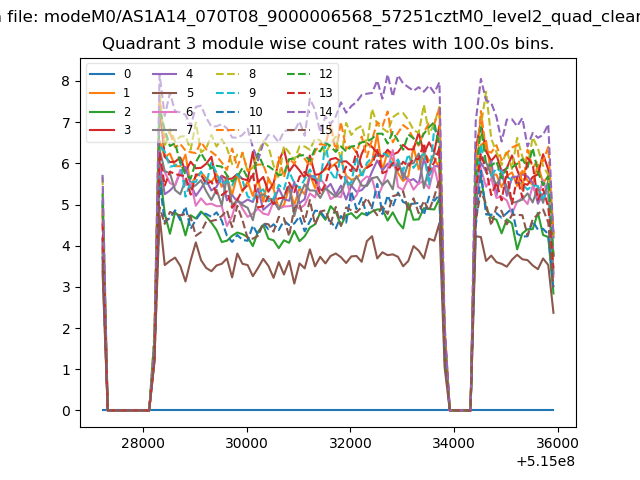
| Module-wise count rates for Quadrant C Data is divided into 100 sec bins |
 |
 |
| Module-wise count rates for Quadrant D Data is divided into 100 sec bins |
 |
 |
| Parameter | Plot |
|---|---|
| CZT HV Monitor | 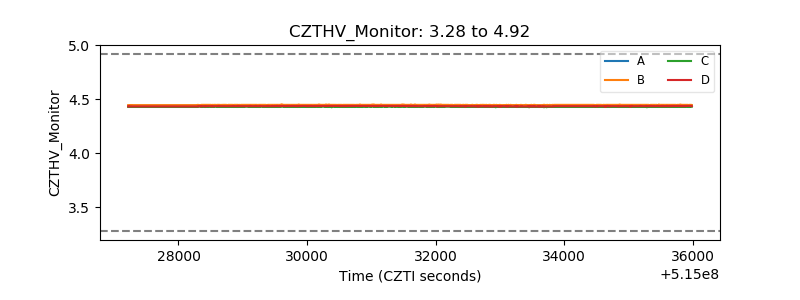 |
| D_VDD | 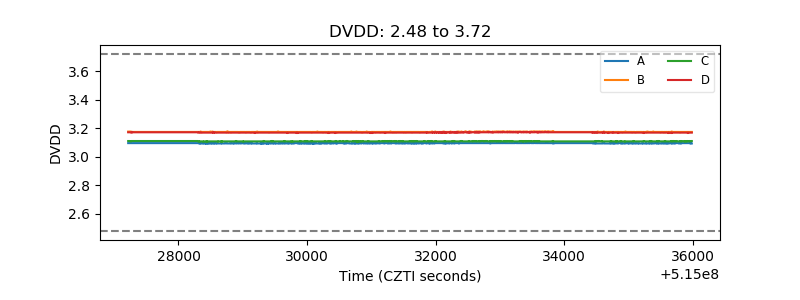 |
| Temperature 1 | 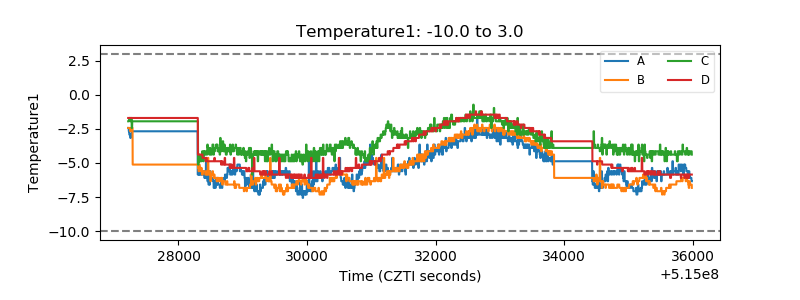 |
| Veto HV Monitor | 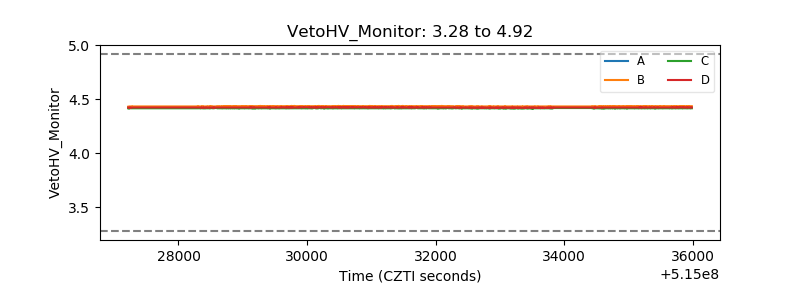 |
| Veto LLD | 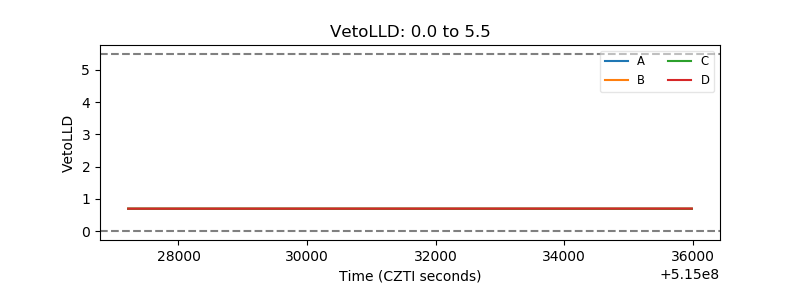 |
| Alpha Counter | 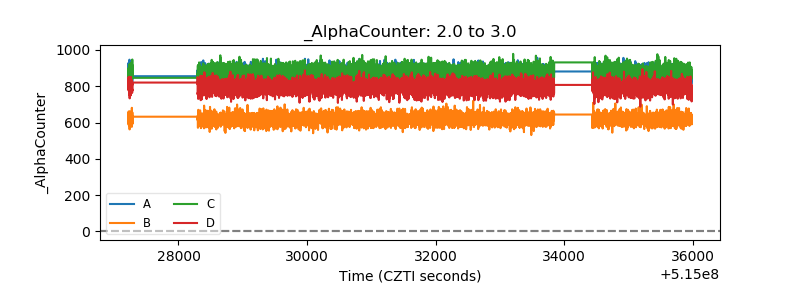 |
| _CPM_Rate | 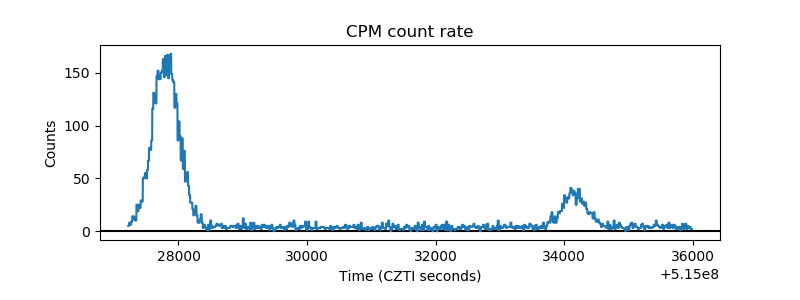 |
| CZT Counter | 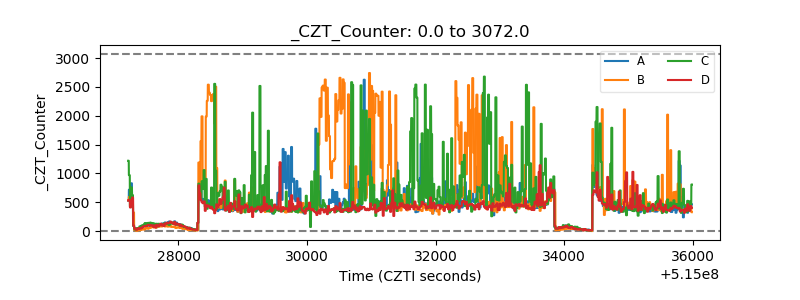 |
| +2.5 Volts monitor |  |
| +5 Volts monitor |  |
| _ROLL_ROT | 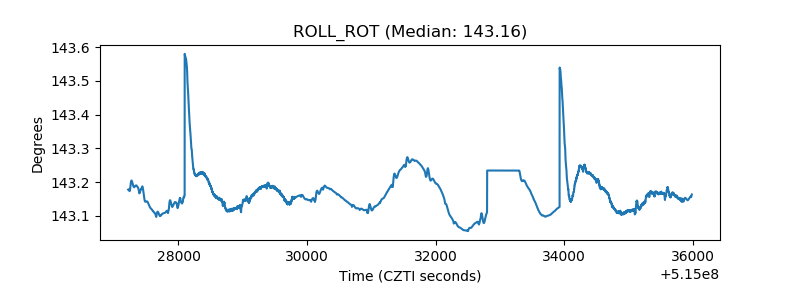 |
| _Roll_DEC | 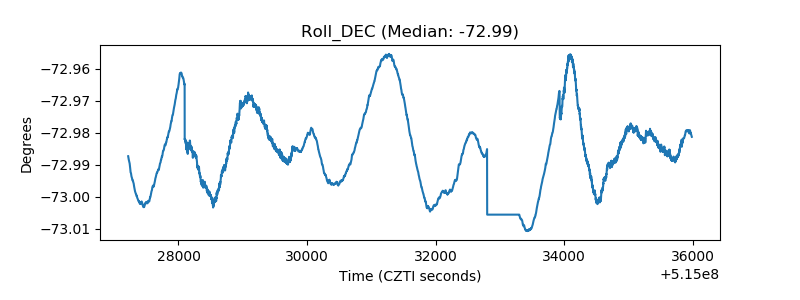 |
| _Roll_RA | 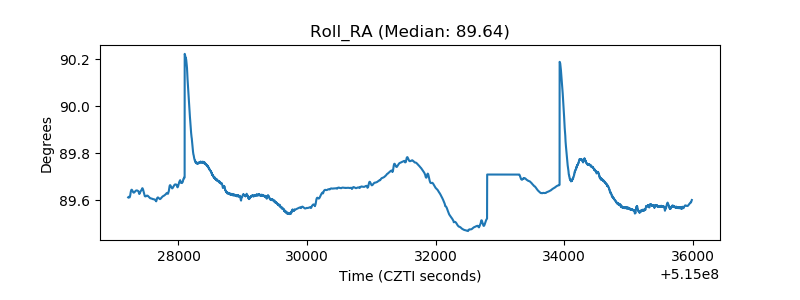 |
| Veto Counter | 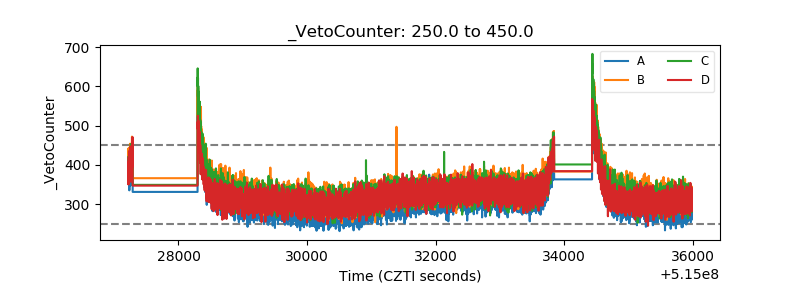 |