| Param | Original file | Final file |
|---|---|---|
| Filename | modeM0/AS1A14_070T08_9000006568_57253cztM0_level2.fits | modeM0/AS1A14_070T08_9000006568_57253cztM0_level2_quad_clean.evt |
| Size (bytes) | 435,548,160 | 104,817,600 |
| Size | 415.4 MB | 100.0 MB |
| Events in quadrant A | 3,432,853 | 682,171 |
| Events in quadrant B | 3,362,235 | 737,362 |
| Events in quadrant C | 4,832,840 | 632,212 |
| Events in quadrant D | 3,919,759 | 607,576 |
| Mode SS | |||
|---|---|---|---|
| Quadrant | BADHDUFLAG | Total packets | Discarded packets |
| A | 0 | 148 | 0 |
| B | 0 | 148 | 0 |
| C | 0 | 148 | 0 |
| D | 0 | 148 | 0 |
| Mode M0 | |||
|---|---|---|---|
| Quadrant | BADHDUFLAG | Total packets | Discarded packets |
| A | 0 | 15916 | 0 |
| B | 0 | 15607 | 0 |
| C | 0 | 19715 | 0 |
| D | 0 | 17209 | 0 |
| Quadrant | Total seconds | Saturated seconds | Saturation percentage |
|---|---|---|---|
| A | 7392 | 73 | 0.987554% |
| B | 7392 | 65 | 0.879329% |
| C | 7393 | 296 | 4.003787% |
| D | 7393 | 106 | 1.433789% |
Noise dominated data is calculated using 1-second bins in cleaned event files. If a bin has >2000 counts, and if more than 50% of those come from <1% of pixels, then it is considered to be noise-dominated and hence unusable.
| Quadrant | # 1 sec bins | Bins with >0 counts | Bins with >2000 counts | High rate bins dominated by noise | Noise dominated (total time) | Noise dominated (detector-on time) | Marked lightcurve |
|---|---|---|---|---|---|---|---|
| A | 7392 | 7392 | 65 | 65 | 0.88% | 0.88% | 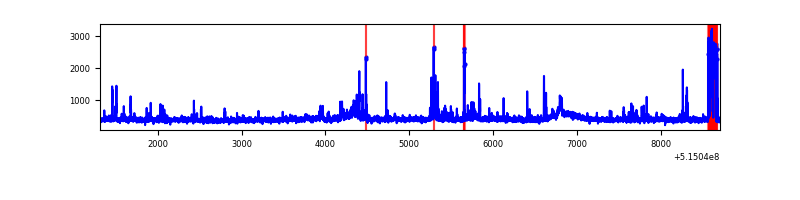 |
| B | 7392 | 7392 | 37 | 37 | 0.50% | 0.50% | 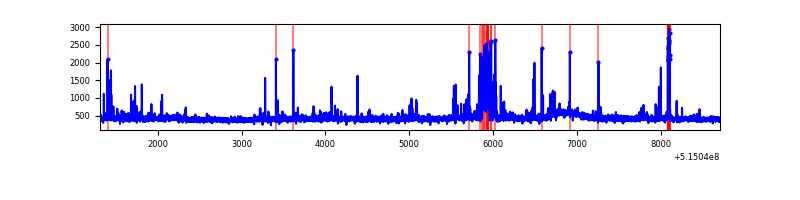 |
| C | 7393 | 7393 | 261 | 261 | 3.53% | 3.53% | 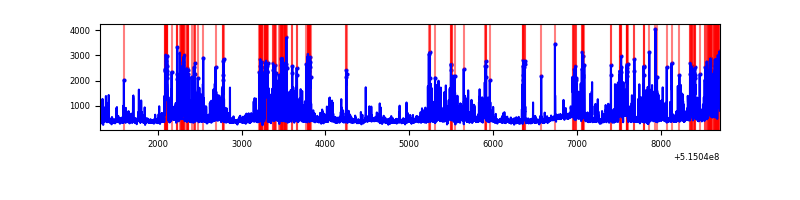 |
| D | 7393 | 7393 | 118 | 118 | 1.60% | 1.60% | 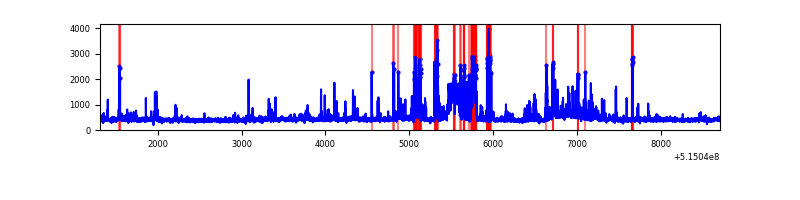 |
Top three noisy pixels from each quadrant. If the there are fewer than three noisy pixels in the level2.evt file, extra rows are filled as -1
| Pixel properties | Quadrant properties | ||||||
|---|---|---|---|---|---|---|---|
| Quadrant | DetID | PixID | Counts | Sigma | Mean | Median | Sigma |
| A | 10 | 251 | 201613 | 1070.78 | 760 | 740 | 187.6 |
| A | 4 | 13 | 168364 | 893.54 | 760 | 740 | 187.6 |
| A | 7 | 64 | 99078 | 524.2 | 760 | 740 | 187.6 |
| B | 7 | 252 | 116224 | 708.63 | 759 | 729 | 163.0 |
| B | 9 | 251 | 45812 | 276.61 | 759 | 729 | 163.0 |
| B | 10 | 16 | 34739 | 208.67 | 759 | 729 | 163.0 |
| C | 15 | 224 | 1667239 | 8333.97 | 737 | 729 | 200.0 |
| C | 14 | 246 | 104126 | 517.07 | 737 | 729 | 200.0 |
| C | 14 | 254 | 83057 | 411.71 | 737 | 729 | 200.0 |
| D | 2 | 120 | 607442 | 2937.23 | 735 | 703 | 206.6 |
| D | 2 | 249 | 188856 | 910.85 | 735 | 703 | 206.6 |
| D | 7 | 96 | 78971 | 378.9 | 735 | 703 | 206.6 |
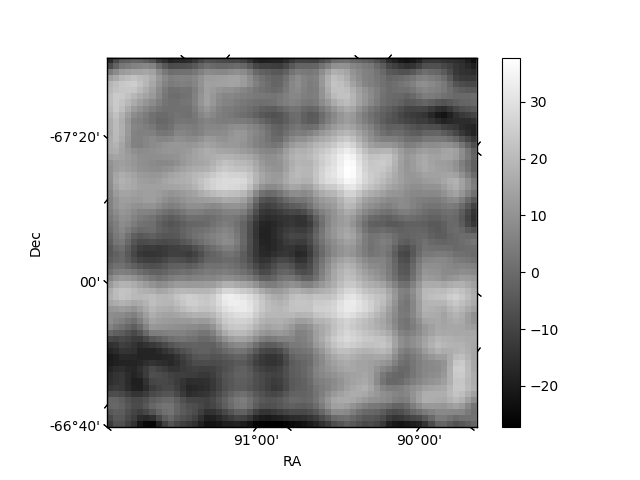
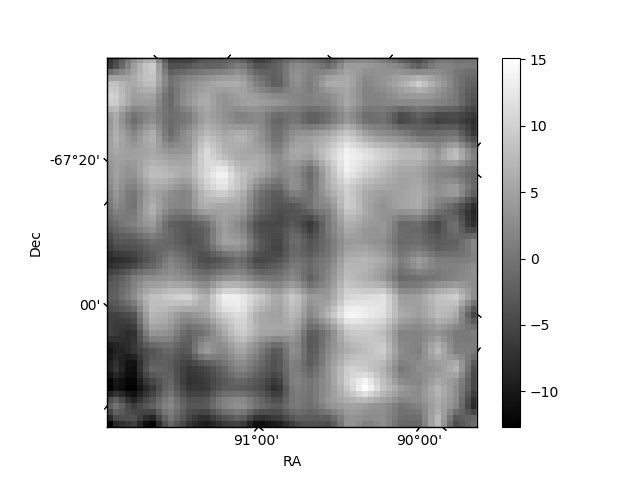
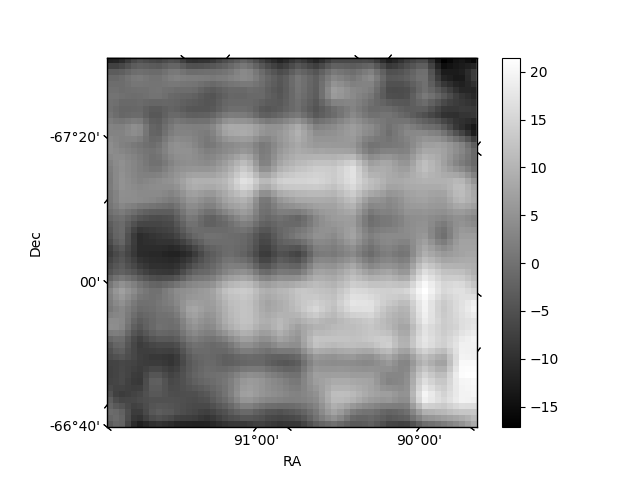
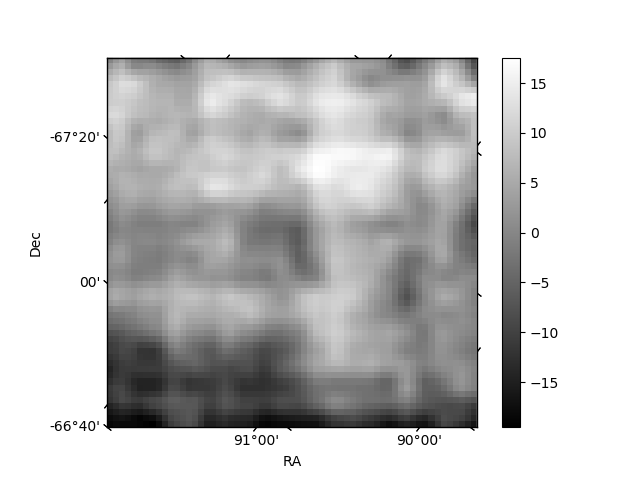
Histogram calculated using DETX and DETY for each event in the final _common_clean file
| Quadrant A | 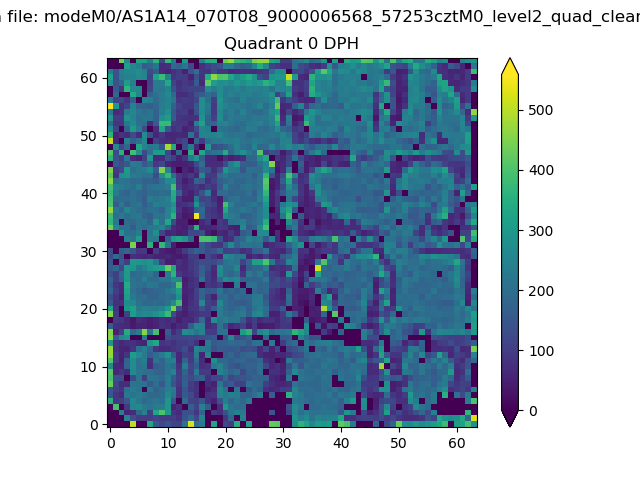 |
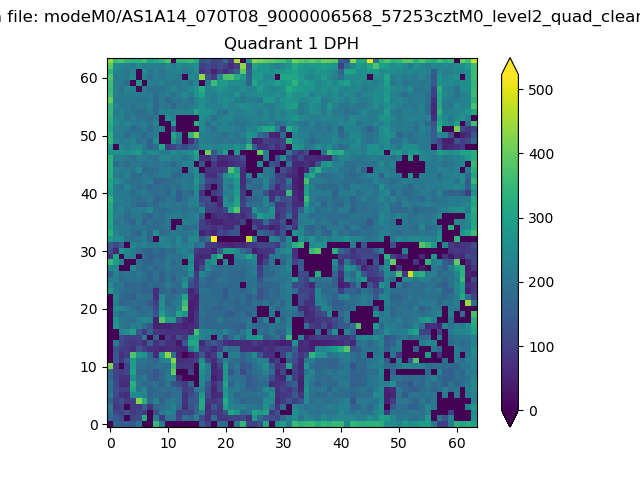 |
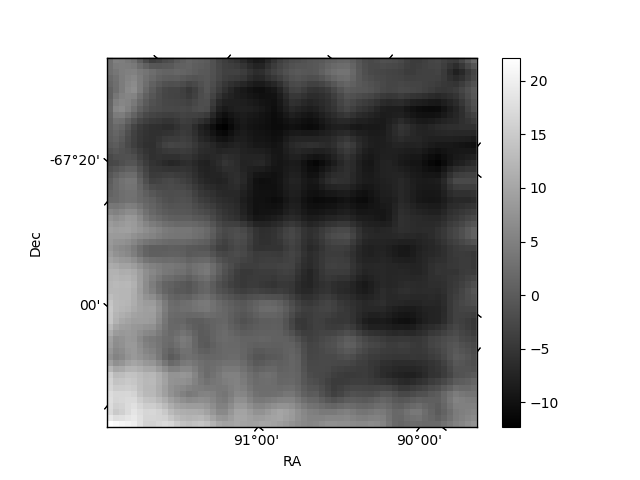
Quadrant B |
|---|---|---|---|
| Quadrant D | 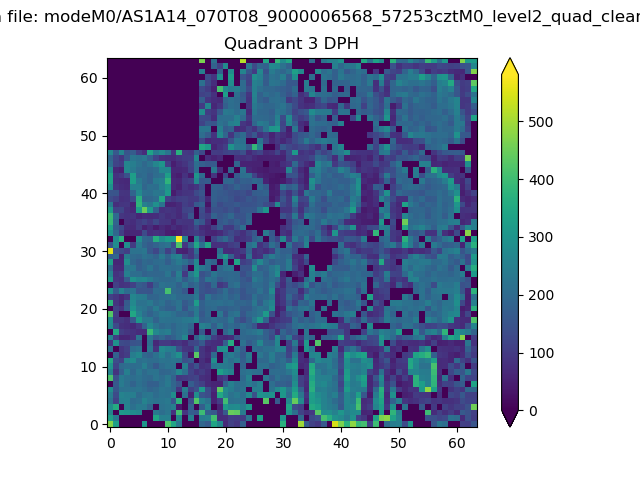 |
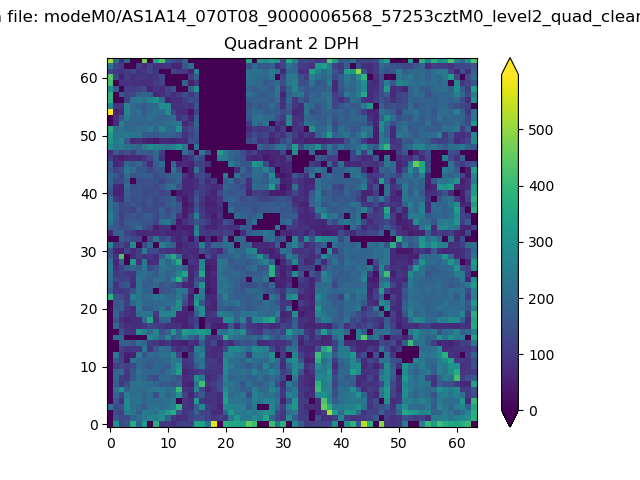 |
Quadrant C |
| Plot type | Count rate plots | Images |
|---|---|---|
| Comparison with Poisson distribution Blue bars denote a histogram of data divided into 1 sec bins. Red curve is a Poisson curve with rate = median count rate of data. |
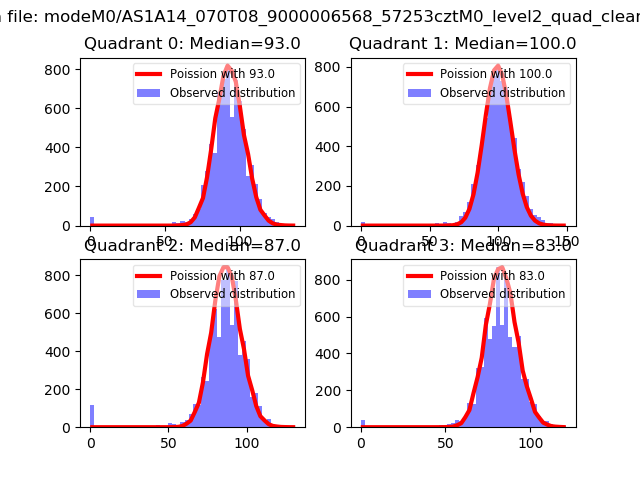 |
 |
| Quadrant-wise count rates Data is divided into 100 sec bins |
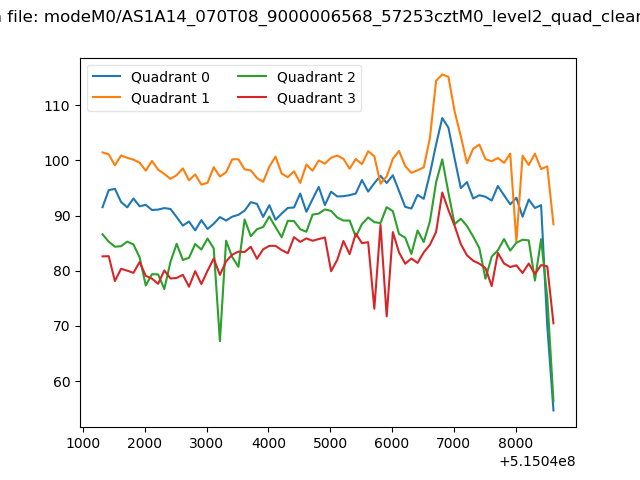 |
|
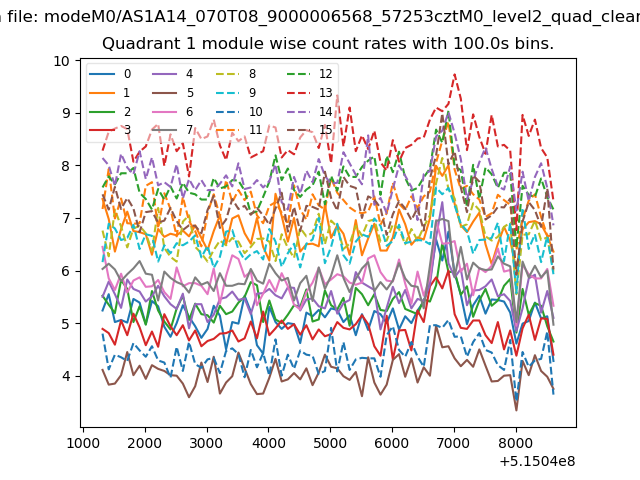
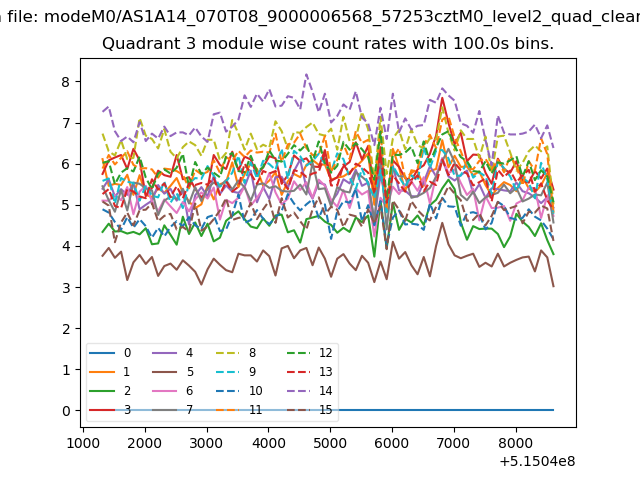
| Module-wise count rates for Quadrant A Data is divided into 100 sec bins |
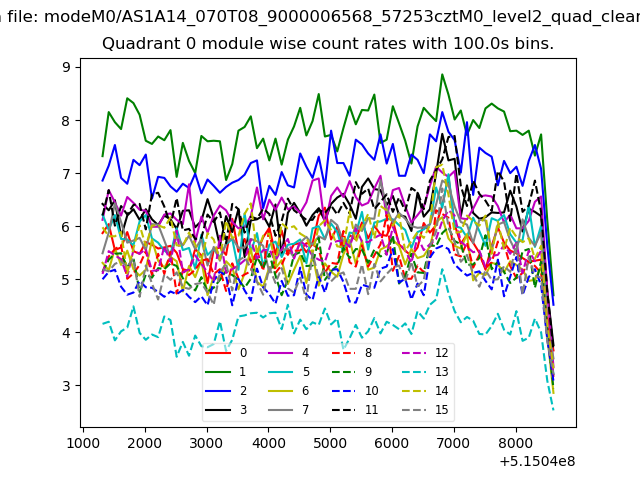 |
 |
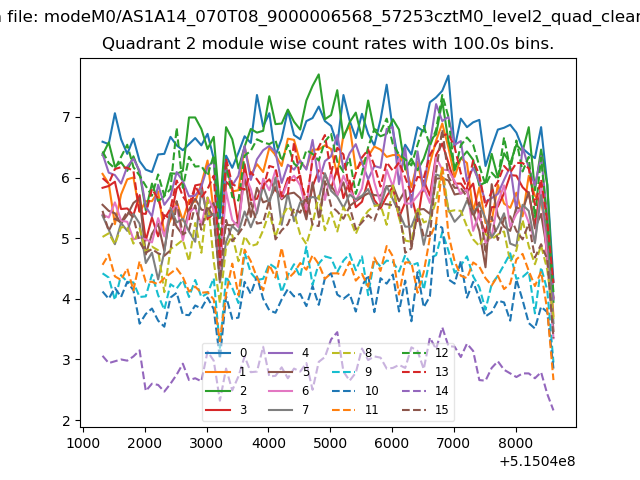
| Module-wise count rates for Quadrant B Data is divided into 100 sec bins |
 |
 |
| Module-wise count rates for Quadrant C Data is divided into 100 sec bins |
 |
 |
| Module-wise count rates for Quadrant D Data is divided into 100 sec bins |
 |
 |
| Parameter | Plot |
|---|---|
| CZT HV Monitor | 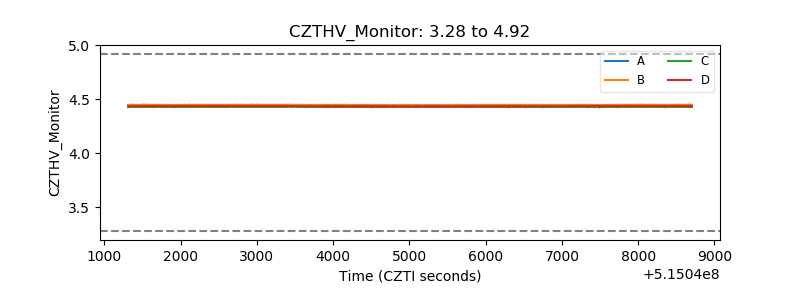 |
| D_VDD | 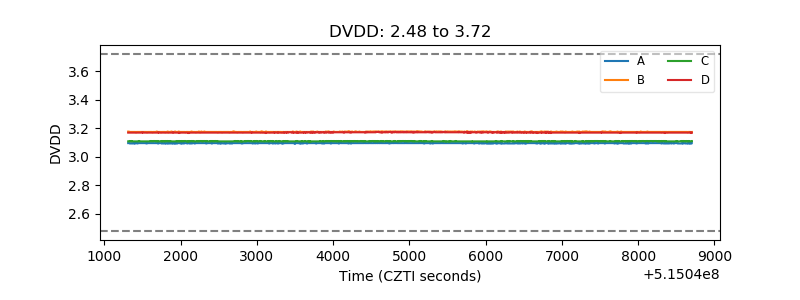 |
| Temperature 1 | 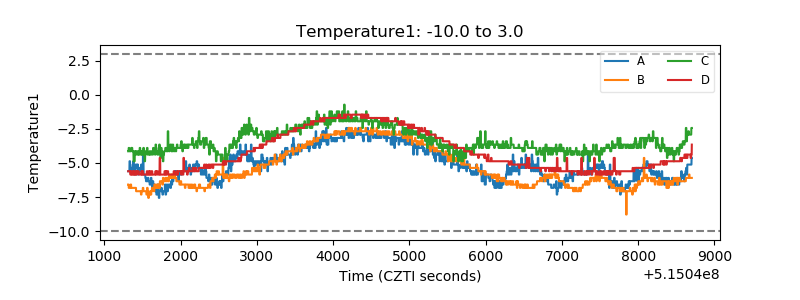 |
| Veto HV Monitor | 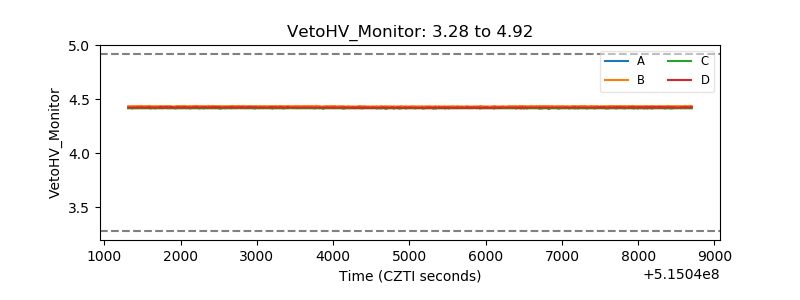 |
| Veto LLD | 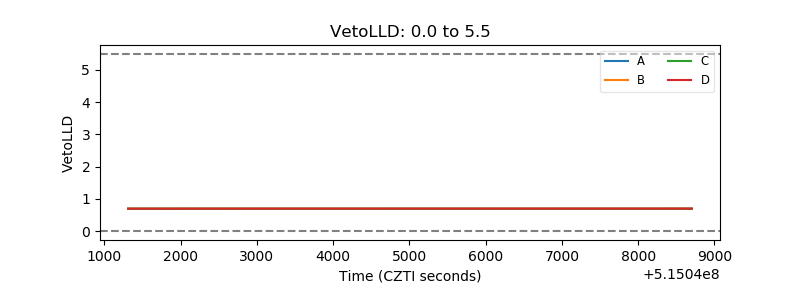 |
| Alpha Counter | 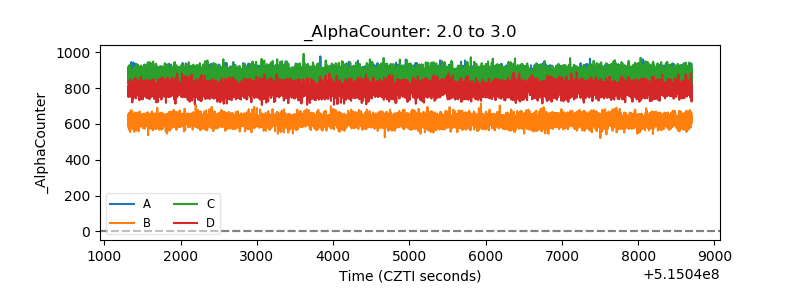 |
| _CPM_Rate | 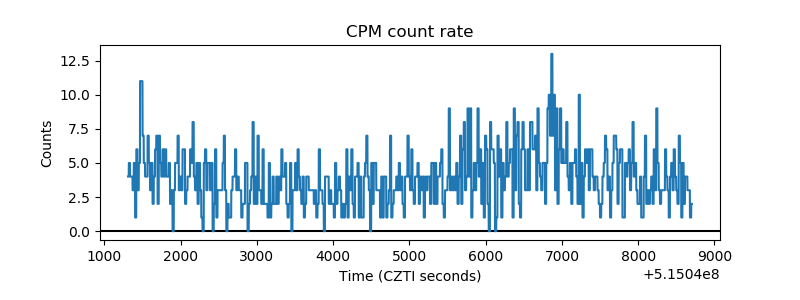 |
| CZT Counter | 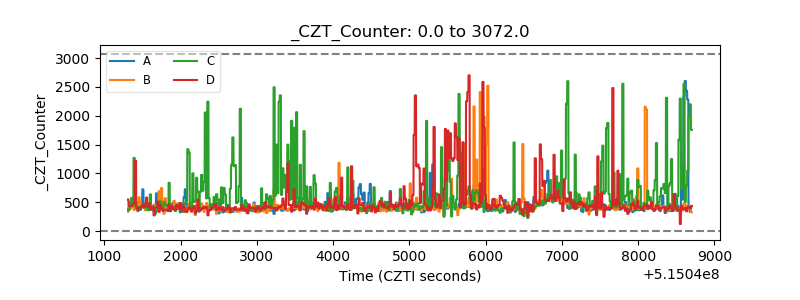 |
| +2.5 Volts monitor | 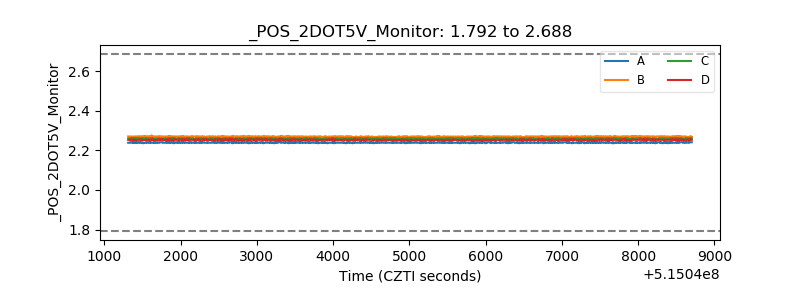 |
| +5 Volts monitor |  |
| _ROLL_ROT | 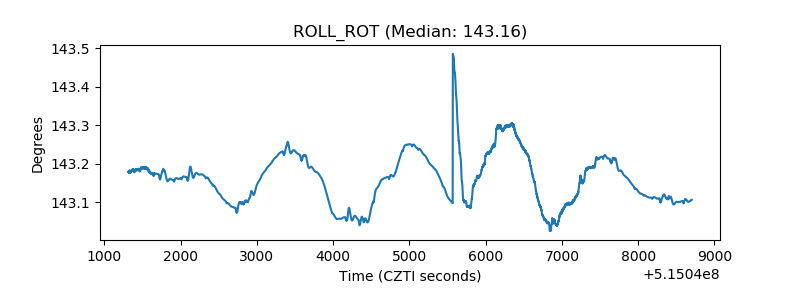 |
| _Roll_DEC | 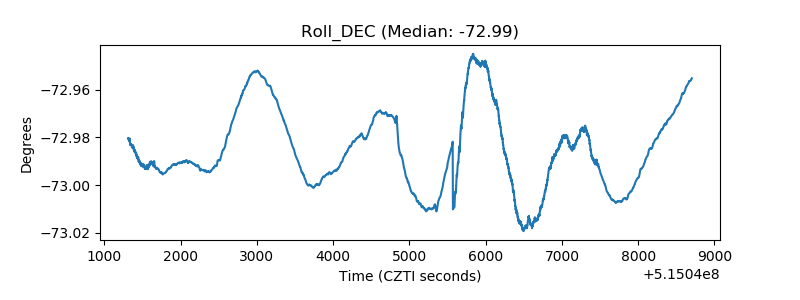 |
| _Roll_RA | 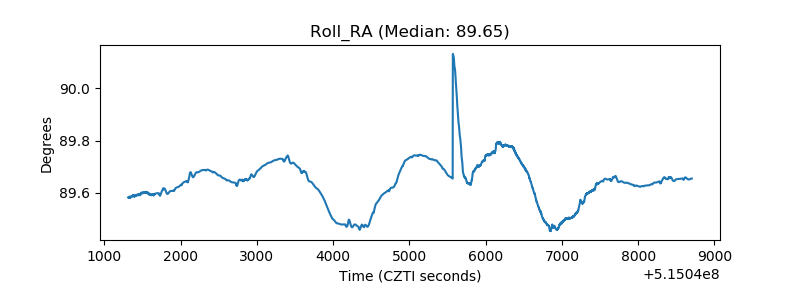 |
| Veto Counter | 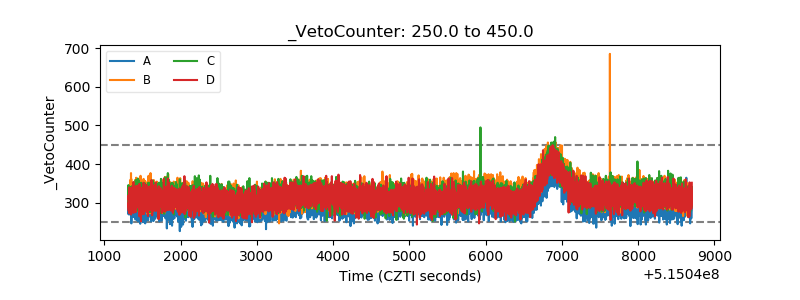 |