| Param | Original file | Final file |
|---|---|---|
| Filename | modeM0/AS1A14_049T03_9000006570_57258cztM0_level2.fits | modeM0/AS1A14_049T03_9000006570_57258cztM0_level2_quad_clean.evt |
| Size (bytes) | 398,793,600 | 87,978,240 |
| Size | 380.3 MB | 83.9 MB |
| Events in quadrant A | 2,877,352 | 581,551 |
| Events in quadrant B | 3,228,932 | 607,290 |
| Events in quadrant C | 5,046,323 | 522,812 |
| Events in quadrant D | 3,129,153 | 521,297 |
| Mode M0 | |||
|---|---|---|---|
| Quadrant | BADHDUFLAG | Total packets | Discarded packets |
| A | 0 | 13068 | 1 |
| B | 0 | 14092 | 1 |
| C | 0 | 19392 | 1 |
| D | 0 | 13749 | 1 |
| Mode M9 | |||
|---|---|---|---|
| Quadrant | BADHDUFLAG | Total packets | Discarded packets |
| A | 0 | 9 | 0 |
| B | 0 | 9 | 0 |
| C | 0 | 9 | 0 |
| D | 0 | 9 | 0 |
| Mode SS | |||
|---|---|---|---|
| Quadrant | BADHDUFLAG | Total packets | Discarded packets |
| A | 0 | 126 | 0 |
| B | 0 | 126 | 0 |
| C | 0 | 126 | 0 |
| D | 0 | 126 | 0 |
| Quadrant | Total seconds | Saturated seconds | Saturation percentage |
|---|---|---|---|
| A | 6169 | 33 | 0.534933% |
| B | 6169 | 186 | 3.015075% |
| C | 6168 | 504 | 8.171206% |
| D | 6169 | 67 | 1.086076% |
Noise dominated data is calculated using 1-second bins in cleaned event files. If a bin has >2000 counts, and if more than 50% of those come from <1% of pixels, then it is considered to be noise-dominated and hence unusable.
| Quadrant | # 1 sec bins | Bins with >0 counts | Bins with >2000 counts | High rate bins dominated by noise | Noise dominated (total time) | Noise dominated (detector-on time) | Marked lightcurve |
|---|---|---|---|---|---|---|---|
| A | 7094 | 6169 | 3 | 3 | 0.04% | 0.05% | 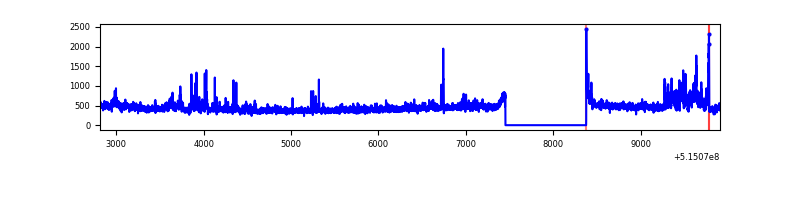 |
| B | 7094 | 6169 | 133 | 133 | 1.87% | 2.16% | 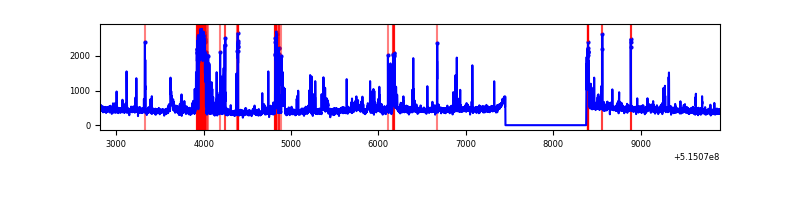 |
| C | 7093 | 6168 | 449 | 449 | 6.33% | 7.28% | 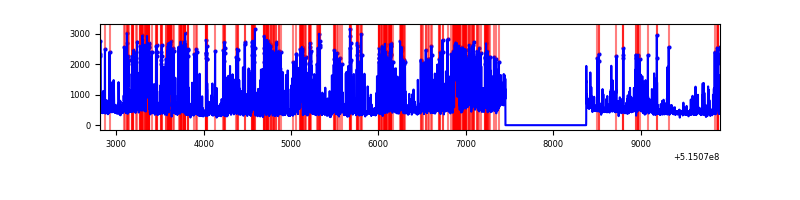 |
| D | 7094 | 6169 | 53 | 53 | 0.75% | 0.86% | 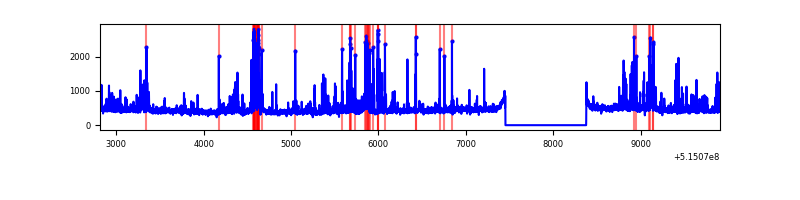 |
Top three noisy pixels from each quadrant. If the there are fewer than three noisy pixels in the level2.evt file, extra rows are filled as -1
| Pixel properties | Quadrant properties | ||||||
|---|---|---|---|---|---|---|---|
| Quadrant | DetID | PixID | Counts | Sigma | Mean | Median | Sigma |
| A | 3 | 14 | 119997 | 739.54 | 653 | 637 | 161.4 |
| A | 4 | 249 | 114706 | 706.76 | 653 | 637 | 161.4 |
| A | 7 | 64 | 97193 | 598.25 | 653 | 637 | 161.4 |
| B | 5 | 172 | 381882 | 2746.47 | 638 | 614 | 138.8 |
| B | 10 | 16 | 106055 | 759.55 | 638 | 614 | 138.8 |
| B | 7 | 252 | 89205 | 638.17 | 638 | 614 | 138.8 |
| C | 15 | 224 | 2398348 | 14351.1 | 608 | 601 | 167.1 |
| C | 14 | 254 | 210112 | 1253.97 | 608 | 601 | 167.1 |
| C | 14 | 246 | 20509 | 119.15 | 608 | 601 | 167.1 |
| D | 2 | 249 | 189361 | 1053.48 | 630 | 601 | 179.2 |
| D | 2 | 120 | 101832 | 564.97 | 630 | 601 | 179.2 |
| D | 8 | 240 | 91345 | 506.45 | 630 | 601 | 179.2 |
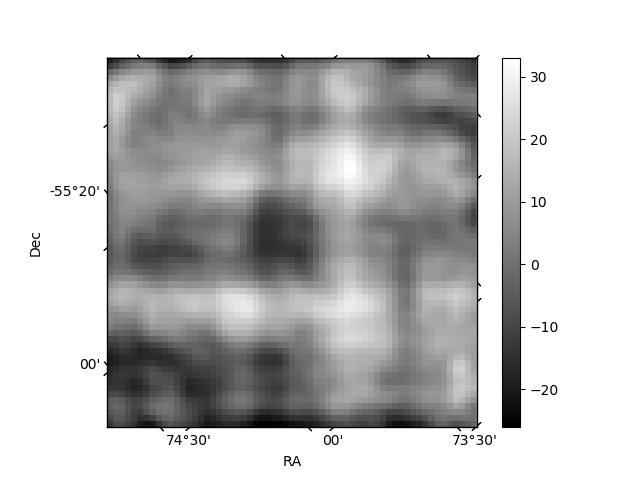
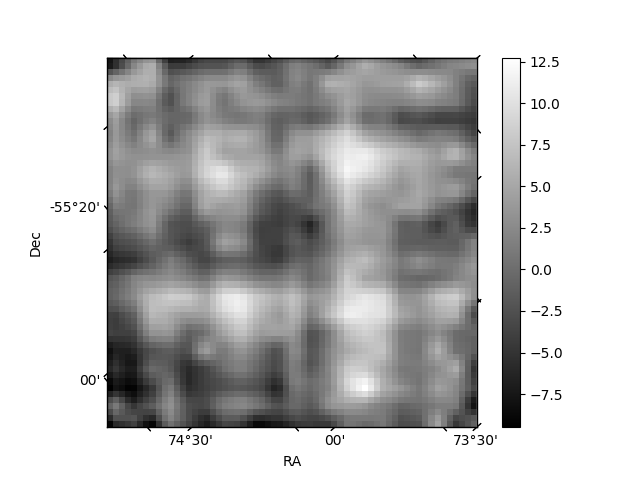
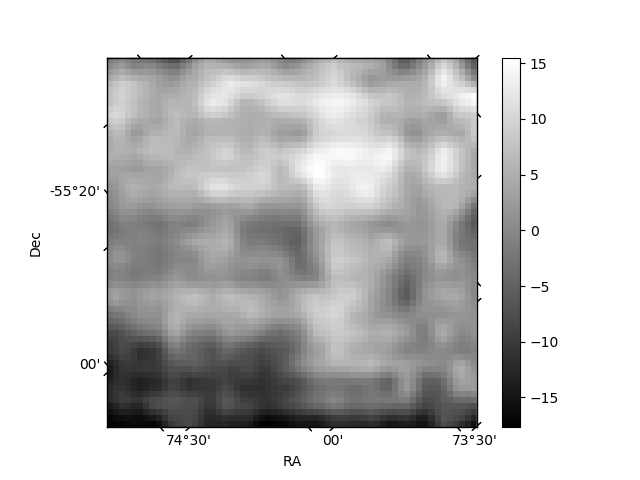
Histogram calculated using DETX and DETY for each event in the final _common_clean file
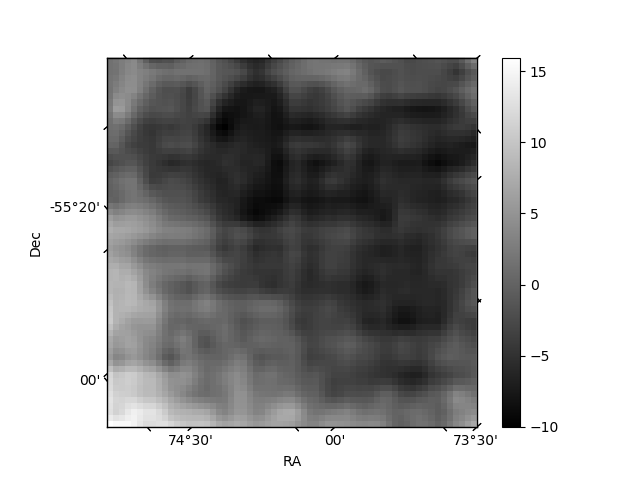
| Quadrant A | 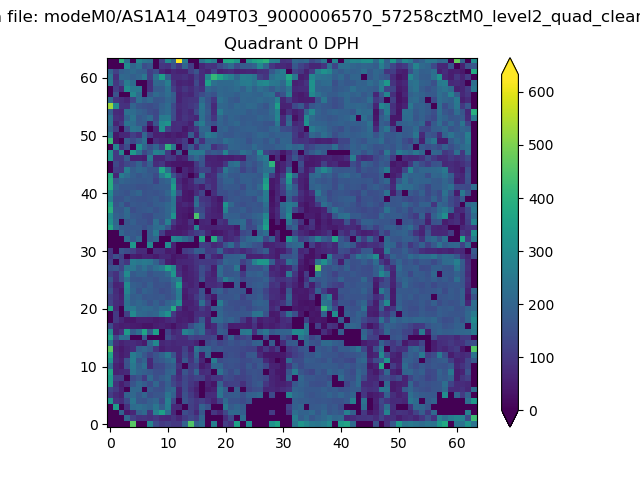 |
 |
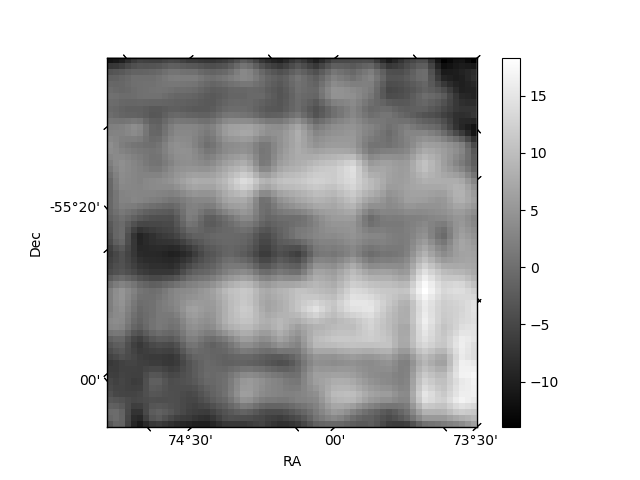
Quadrant B |
|---|---|---|---|
| Quadrant D | 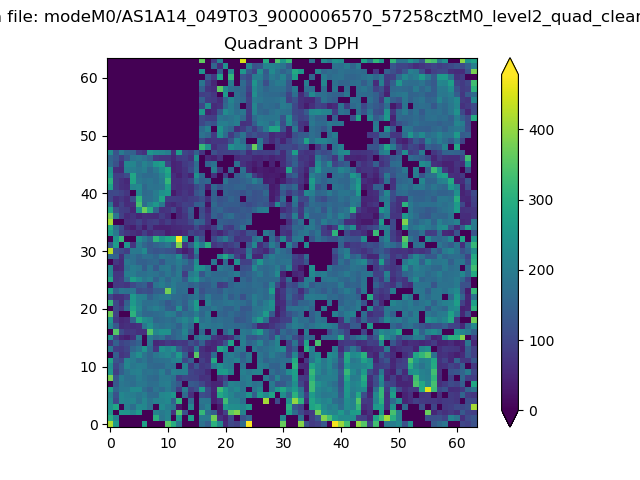 |
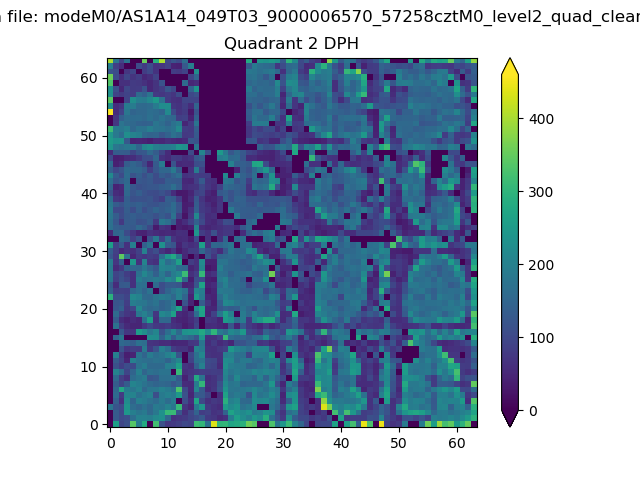 |
Quadrant C |
| Plot type | Count rate plots | Images |
|---|---|---|
| Comparison with Poisson distribution Blue bars denote a histogram of data divided into 1 sec bins. Red curve is a Poisson curve with rate = median count rate of data. |
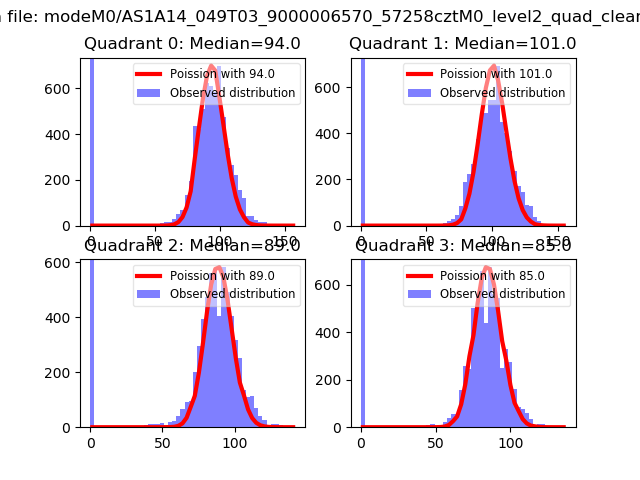 |
 |
| Quadrant-wise count rates Data is divided into 100 sec bins |
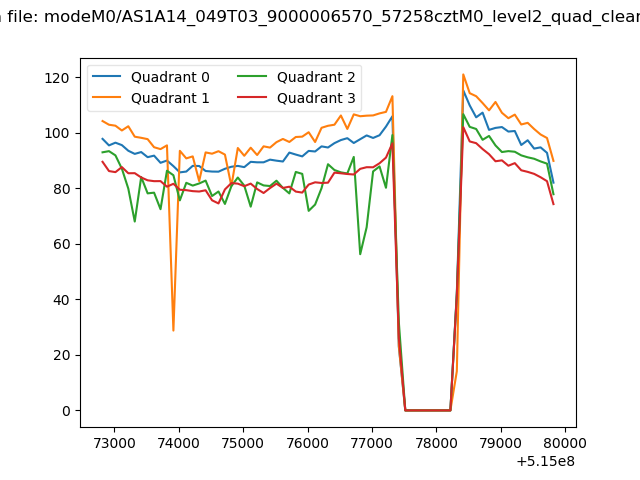 |
|
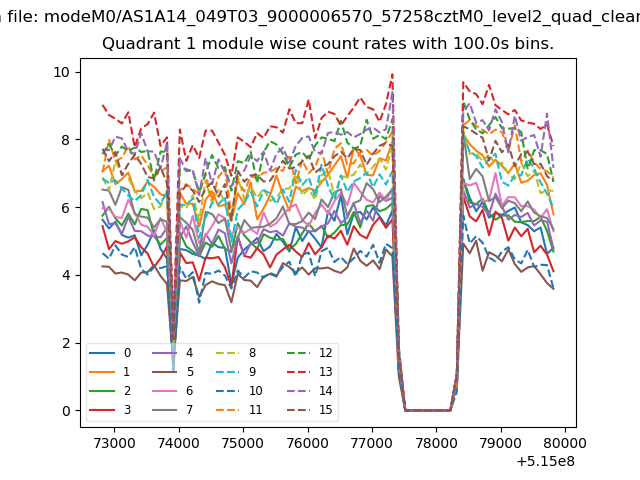
| Module-wise count rates for Quadrant A Data is divided into 100 sec bins |
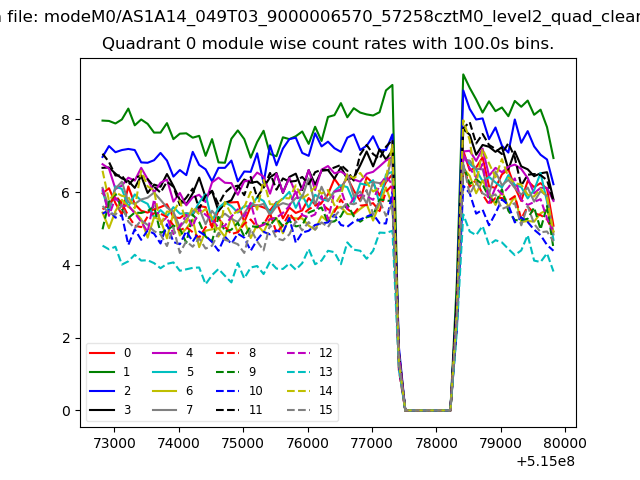 |
 |
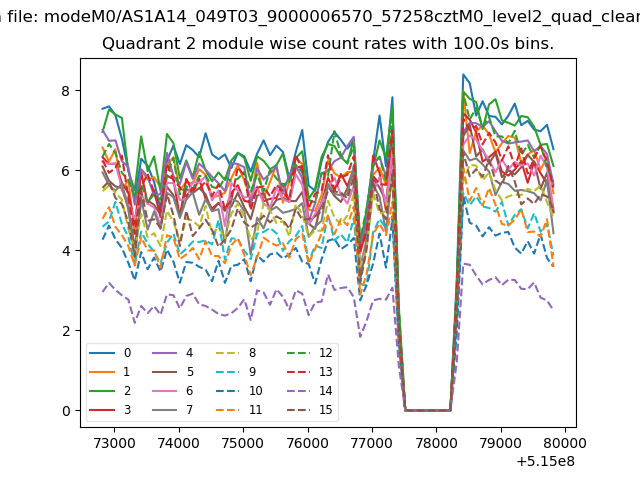
| Module-wise count rates for Quadrant B Data is divided into 100 sec bins |
 |
 |
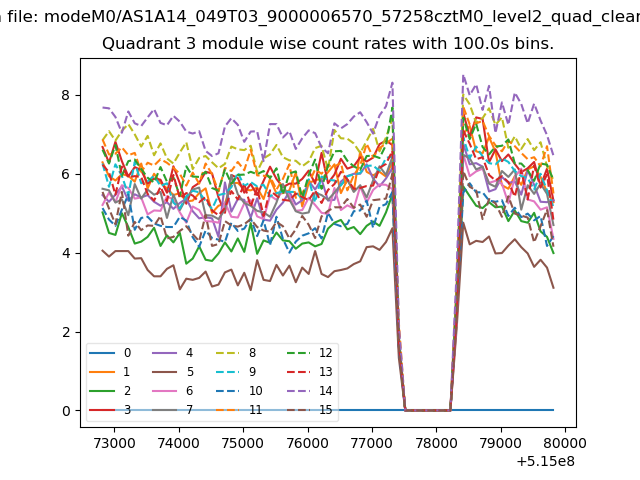
| Module-wise count rates for Quadrant C Data is divided into 100 sec bins |
 |
 |
| Module-wise count rates for Quadrant D Data is divided into 100 sec bins |
 |
 |
| Parameter | Plot |
|---|---|
| CZT HV Monitor | 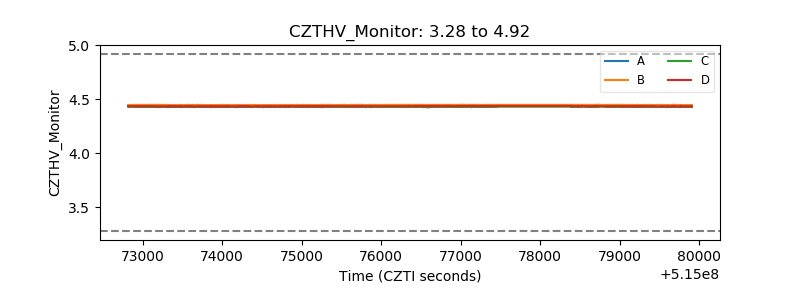 |
| D_VDD | 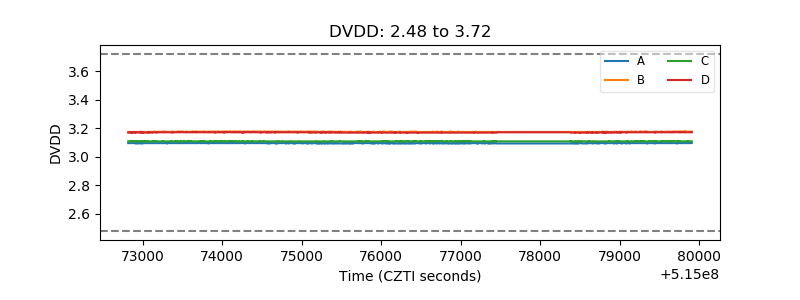 |
| Temperature 1 | 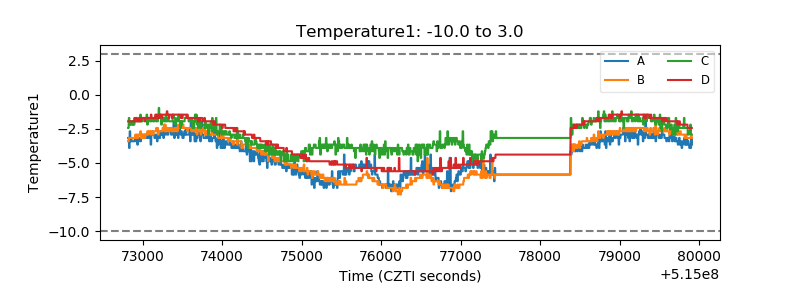 |
| Veto HV Monitor | 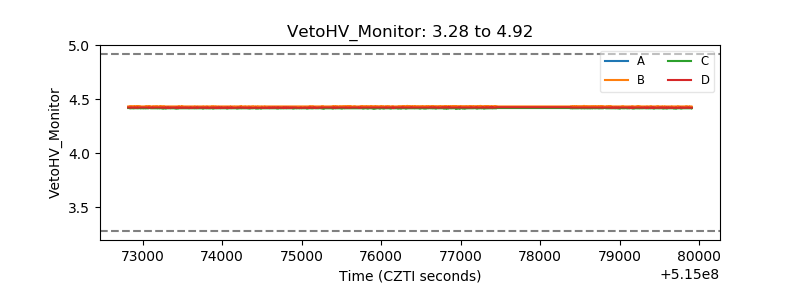 |
| Veto LLD | 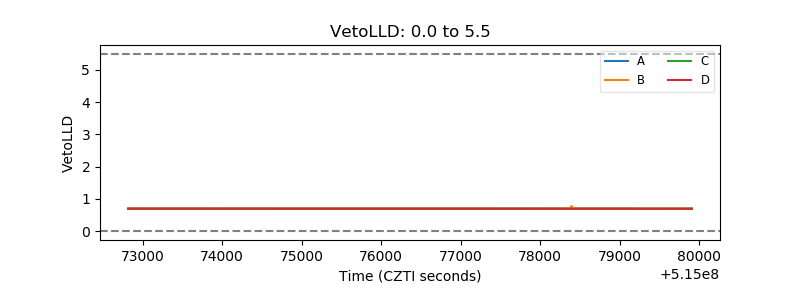 |
| Alpha Counter | 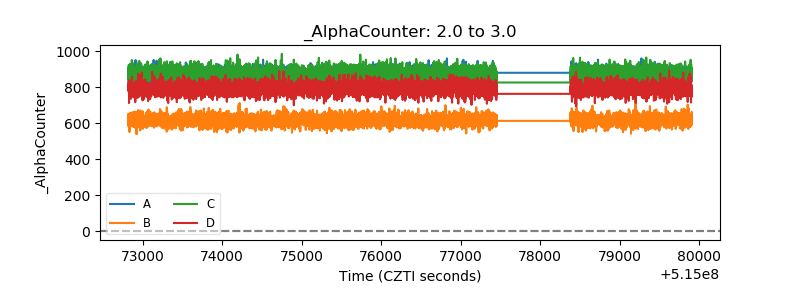 |
| _CPM_Rate | 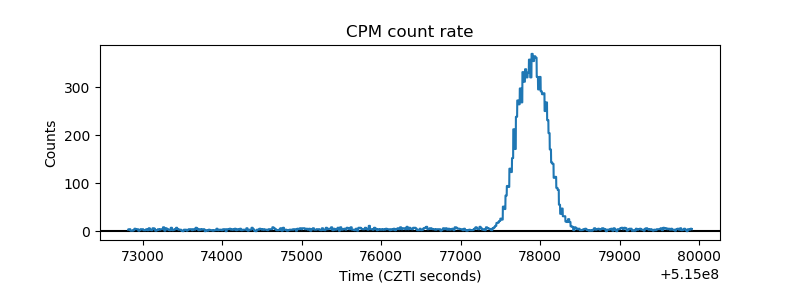 |
| CZT Counter | 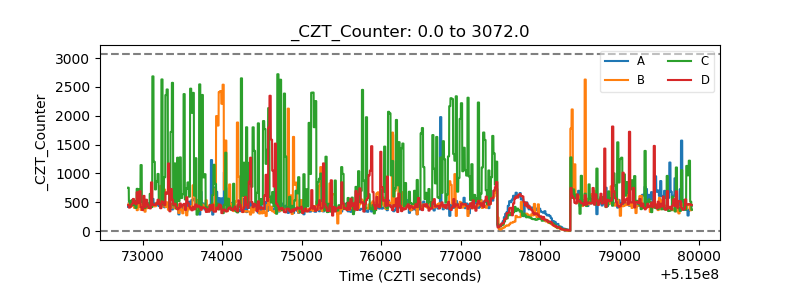 |
| +2.5 Volts monitor |  |
| +5 Volts monitor | 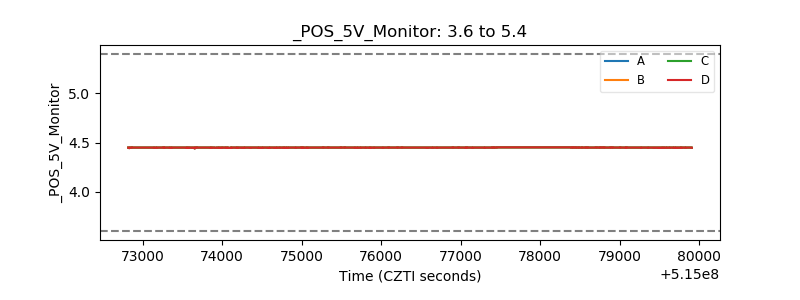 |
| _ROLL_ROT | 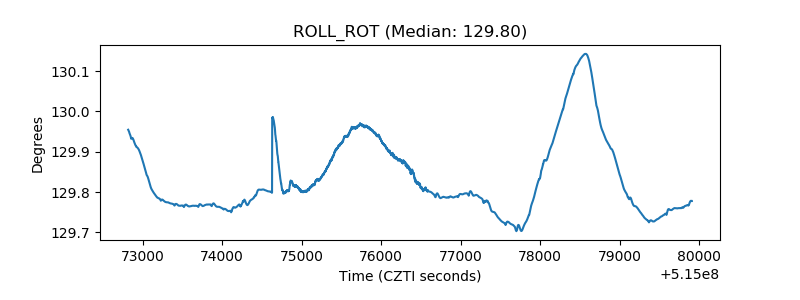 |
| _Roll_DEC | 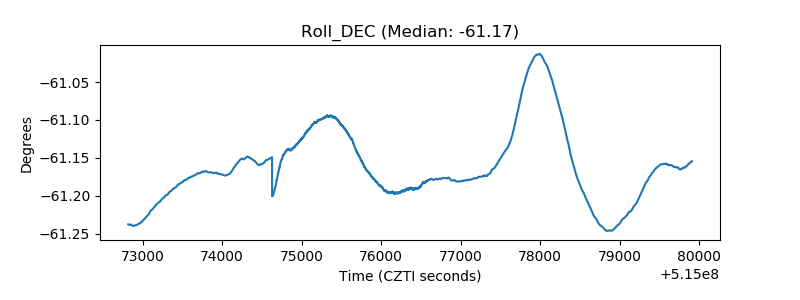 |
| _Roll_RA | 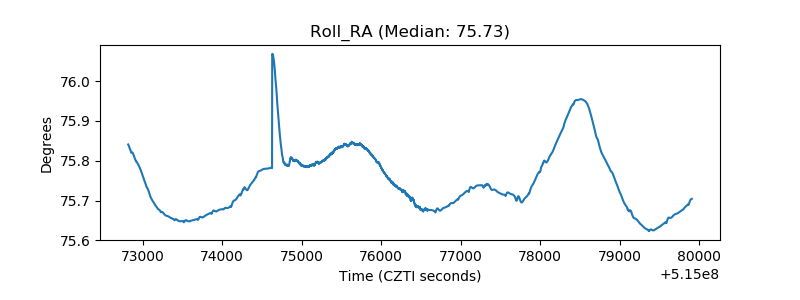 |
| Veto Counter | 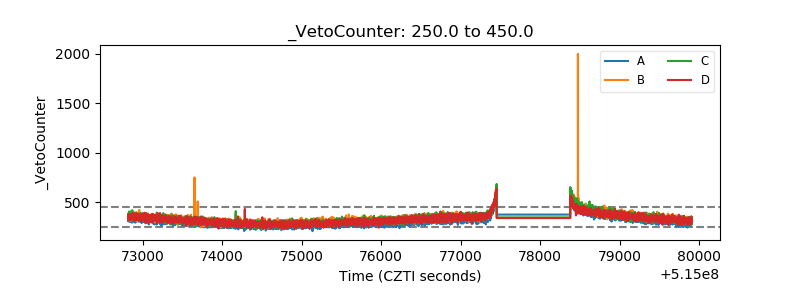 |