| Param | Original file | Final file |
|---|---|---|
| Filename | modeM0/AS1A14_049T03_9000006570_57260cztM0_level2.fits | modeM0/AS1A14_049T03_9000006570_57260cztM0_level2_quad_clean.evt |
| Size (bytes) | 372,988,800 | 85,003,200 |
| Size | 355.7 MB | 81.1 MB |
| Events in quadrant A | 2,705,403 | 566,651 |
| Events in quadrant B | 2,735,879 | 599,391 |
| Events in quadrant C | 4,981,199 | 494,485 |
| Events in quadrant D | 2,926,610 | 502,516 |
| Mode M0 | |||
|---|---|---|---|
| Quadrant | BADHDUFLAG | Total packets | Discarded packets |
| A | 0 | 12412 | 1 |
| B | 0 | 12527 | 1 |
| C | 0 | 19039 | 1 |
| D | 0 | 13014 | 1 |
| Mode M9 | |||
|---|---|---|---|
| Quadrant | BADHDUFLAG | Total packets | Discarded packets |
| A | 0 | 10 | 0 |
| B | 0 | 10 | 0 |
| C | 0 | 10 | 0 |
| D | 0 | 10 | 0 |
| Mode SS | |||
|---|---|---|---|
| Quadrant | BADHDUFLAG | Total packets | Discarded packets |
| A | 0 | 120 | 0 |
| B | 0 | 120 | 0 |
| C | 0 | 120 | 0 |
| D | 0 | 120 | 0 |
| Quadrant | Total seconds | Saturated seconds | Saturation percentage |
|---|---|---|---|
| A | 5878 | 32 | 0.544403% |
| B | 5878 | 85 | 1.446070% |
| C | 5878 | 587 | 9.986390% |
| D | 5878 | 77 | 1.309969% |
Noise dominated data is calculated using 1-second bins in cleaned event files. If a bin has >2000 counts, and if more than 50% of those come from <1% of pixels, then it is considered to be noise-dominated and hence unusable.
| Quadrant | # 1 sec bins | Bins with >0 counts | Bins with >2000 counts | High rate bins dominated by noise | Noise dominated (total time) | Noise dominated (detector-on time) | Marked lightcurve |
|---|---|---|---|---|---|---|---|
| A | 6948 | 5878 | 2 | 2 | 0.03% | 0.03% | 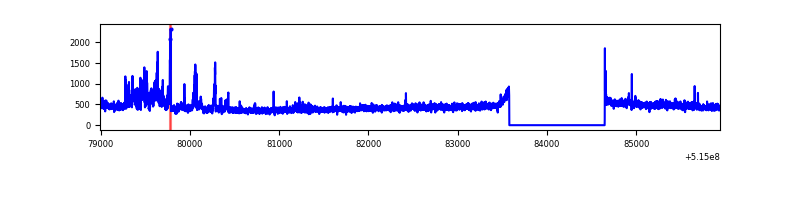 |
| B | 6948 | 5878 | 32 | 32 | 0.46% | 0.54% | 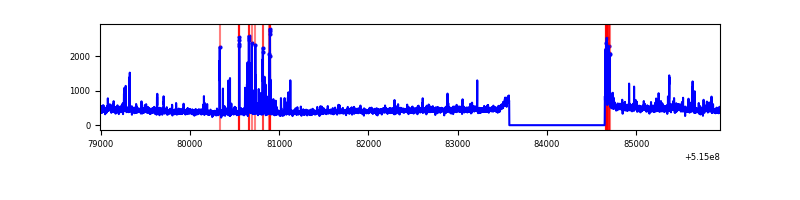 |
| C | 6948 | 5878 | 556 | 556 | 8.00% | 9.46% | 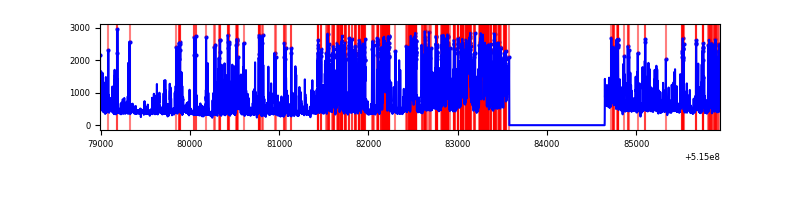 |
| D | 6948 | 5878 | 56 | 56 | 0.81% | 0.95% | 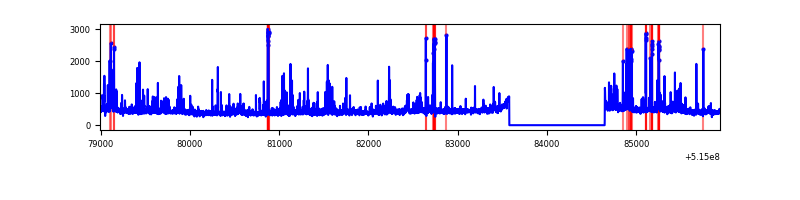 |
Top three noisy pixels from each quadrant. If the there are fewer than three noisy pixels in the level2.evt file, extra rows are filled as -1
| Pixel properties | Quadrant properties | ||||||
|---|---|---|---|---|---|---|---|
| Quadrant | DetID | PixID | Counts | Sigma | Mean | Median | Sigma |
| A | 3 | 14 | 135135 | 866.97 | 626 | 611 | 155.2 |
| A | 7 | 64 | 91182 | 583.71 | 626 | 611 | 155.2 |
| A | 4 | 249 | 43298 | 275.11 | 626 | 611 | 155.2 |
| B | 7 | 252 | 98189 | 739.76 | 612 | 590 | 131.9 |
| B | 10 | 16 | 88140 | 663.6 | 612 | 590 | 131.9 |
| B | 10 | 247 | 66394 | 498.77 | 612 | 590 | 131.9 |
| C | 15 | 224 | 2444128 | 15461.83 | 572 | 565 | 158.0 |
| C | 14 | 254 | 169153 | 1066.75 | 572 | 565 | 158.0 |
| C | 14 | 246 | 73967 | 464.46 | 572 | 565 | 158.0 |
| D | 2 | 249 | 176295 | 1031.38 | 597 | 569 | 170.4 |
| D | 8 | 240 | 110200 | 643.45 | 597 | 569 | 170.4 |
| D | 5 | 173 | 43849 | 254.02 | 597 | 569 | 170.4 |
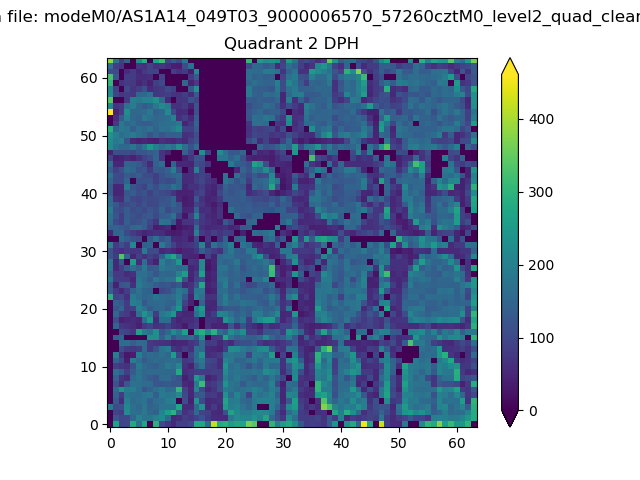
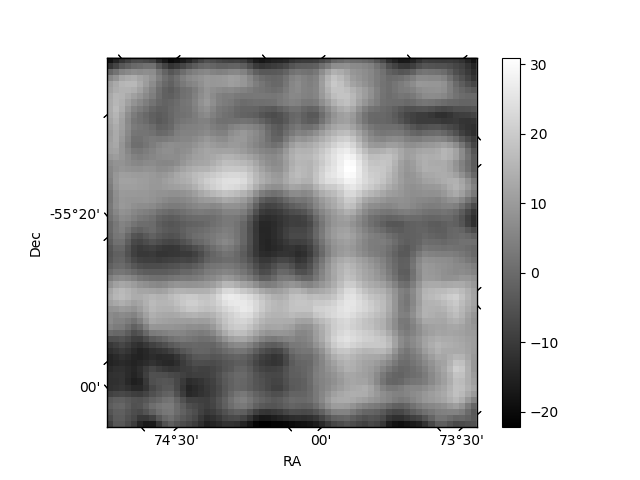
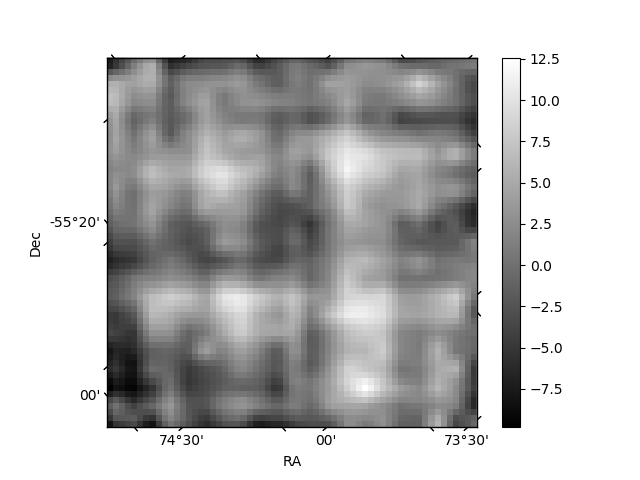
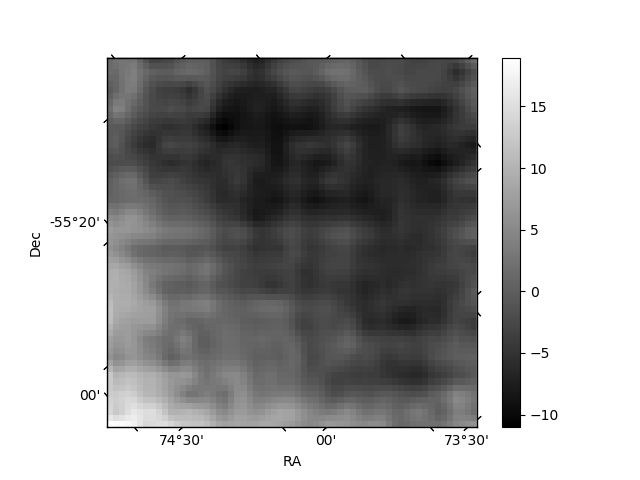
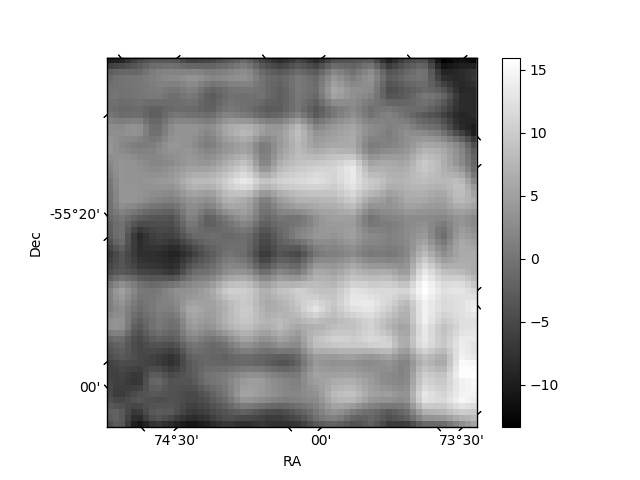
Histogram calculated using DETX and DETY for each event in the final _common_clean file
| Quadrant A | 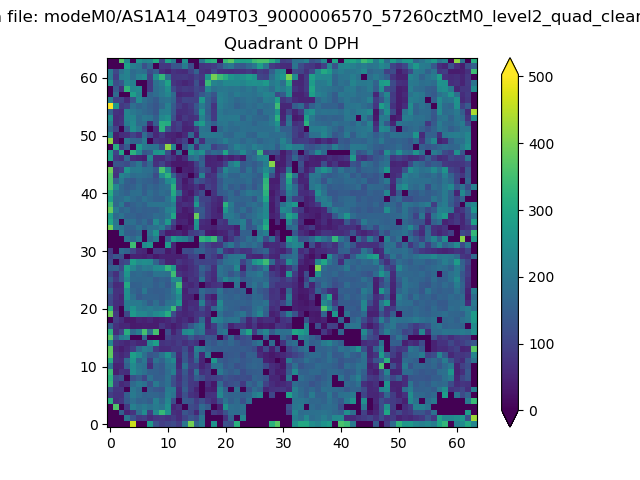 |
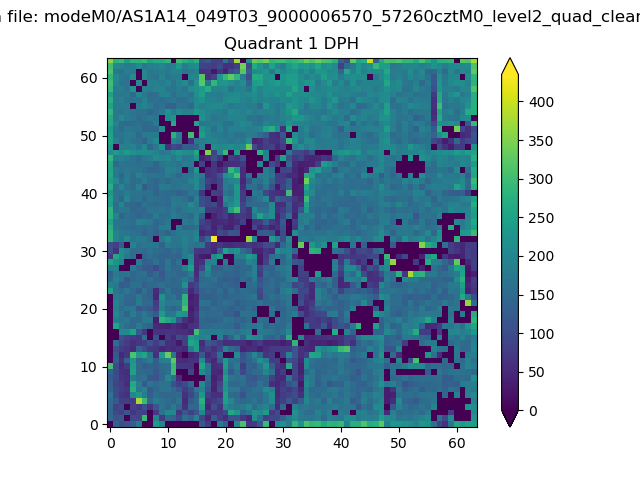 |
Quadrant B |
|---|---|---|---|
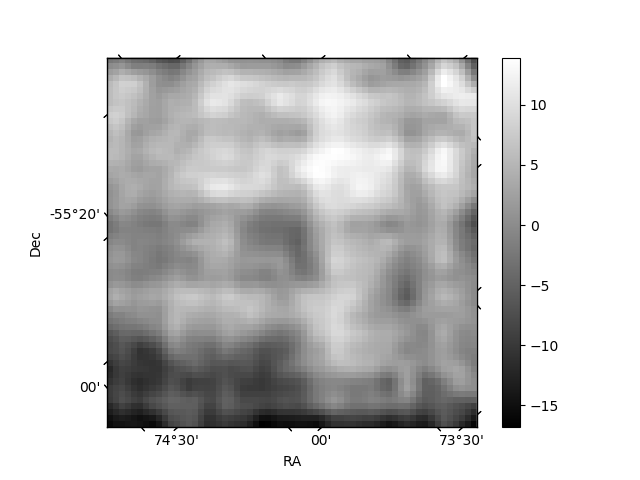
| Quadrant D | 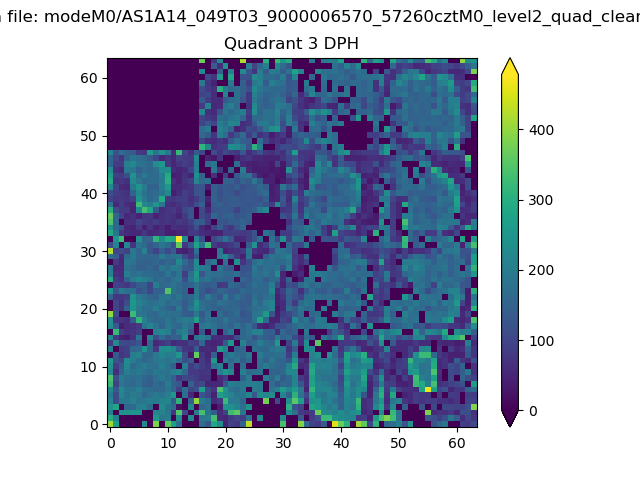 |
 |
Quadrant C |
| Plot type | Count rate plots | Images |
|---|---|---|
| Comparison with Poisson distribution Blue bars denote a histogram of data divided into 1 sec bins. Red curve is a Poisson curve with rate = median count rate of data. |
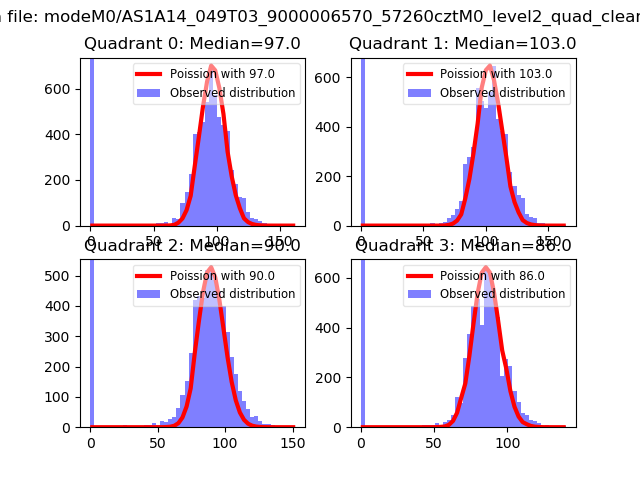 |
 |
| Quadrant-wise count rates Data is divided into 100 sec bins |
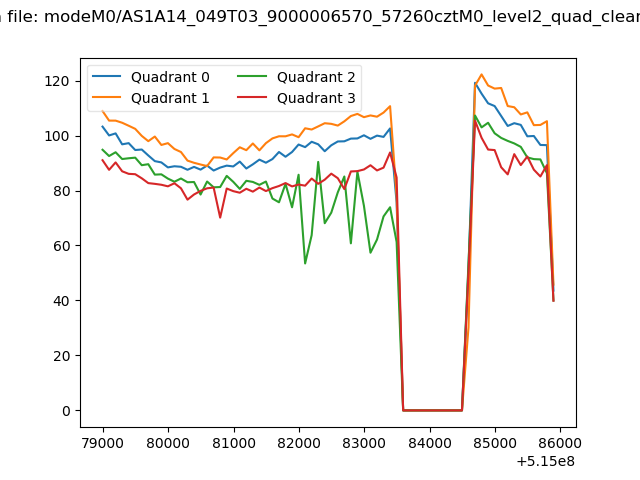 |
|
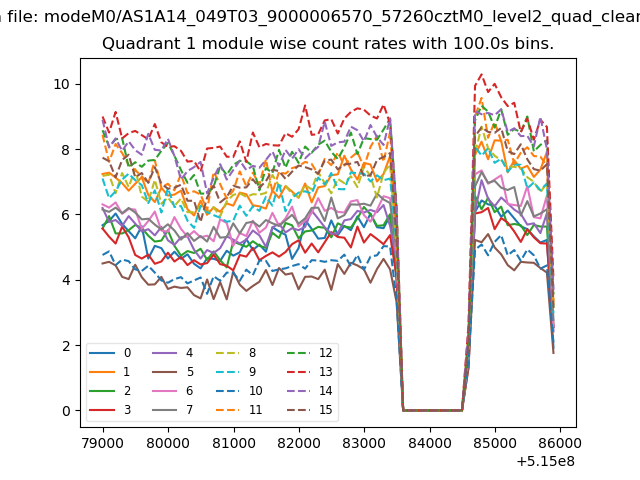
| Module-wise count rates for Quadrant A Data is divided into 100 sec bins |
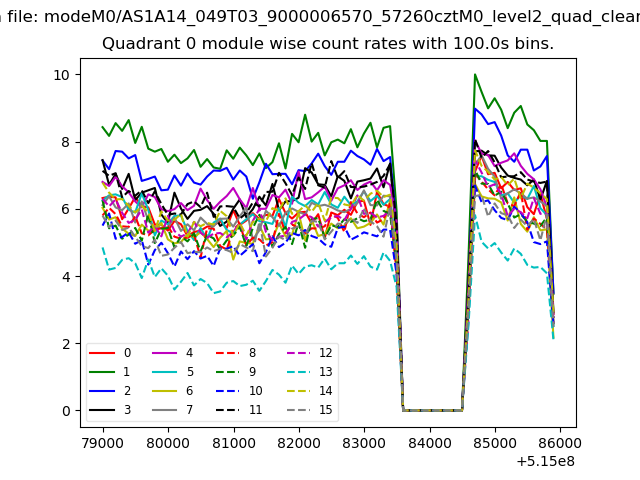 |
 |
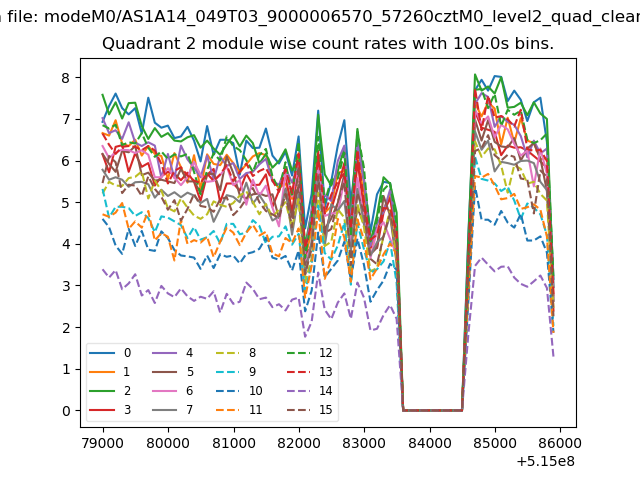
| Module-wise count rates for Quadrant B Data is divided into 100 sec bins |
 |
 |
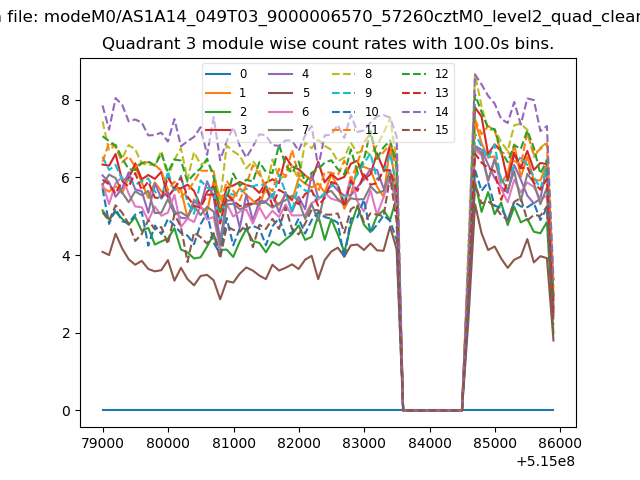
| Module-wise count rates for Quadrant C Data is divided into 100 sec bins |
 |
 |
| Module-wise count rates for Quadrant D Data is divided into 100 sec bins |
 |
 |
| Parameter | Plot |
|---|---|
| CZT HV Monitor |  |
| D_VDD | 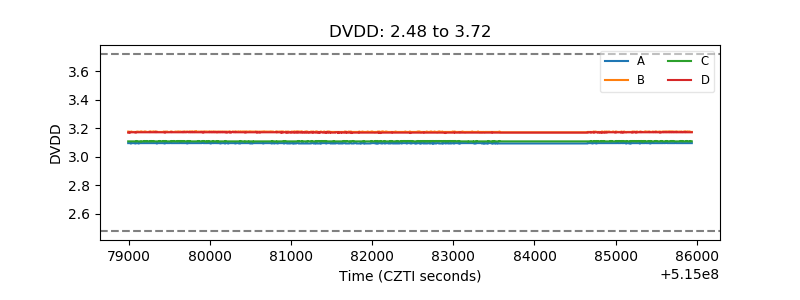 |
| Temperature 1 | 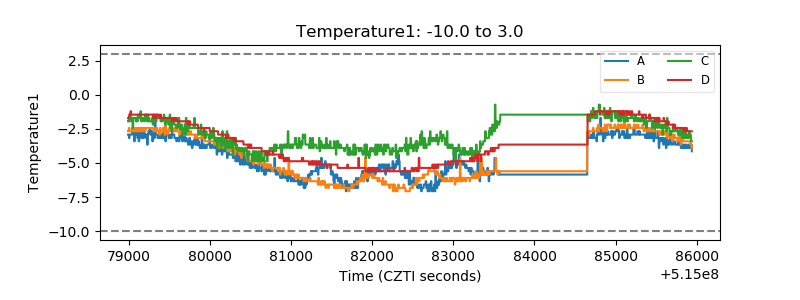 |
| Veto HV Monitor | 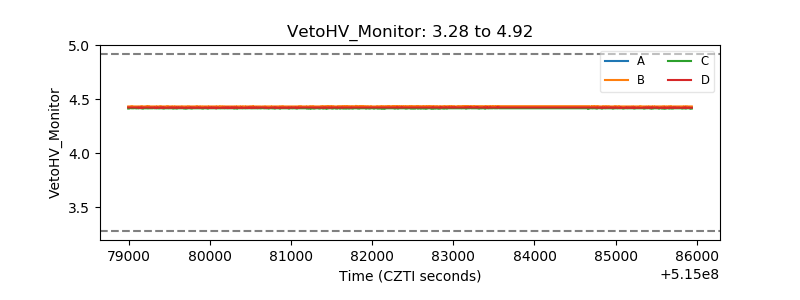 |
| Veto LLD | 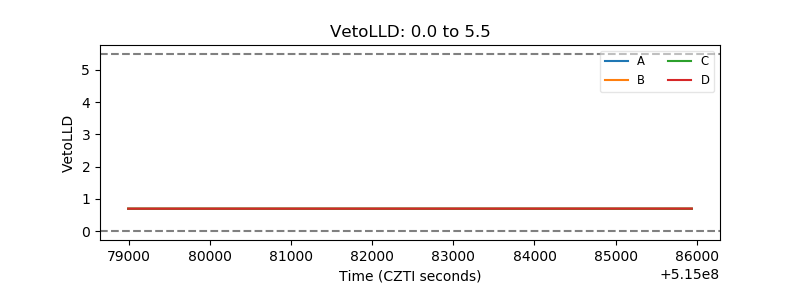 |
| Alpha Counter | 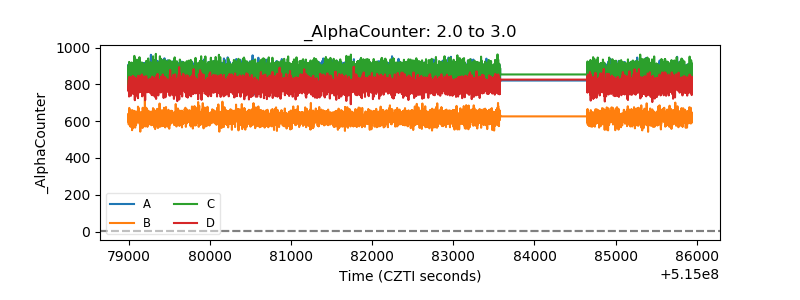 |
| _CPM_Rate | 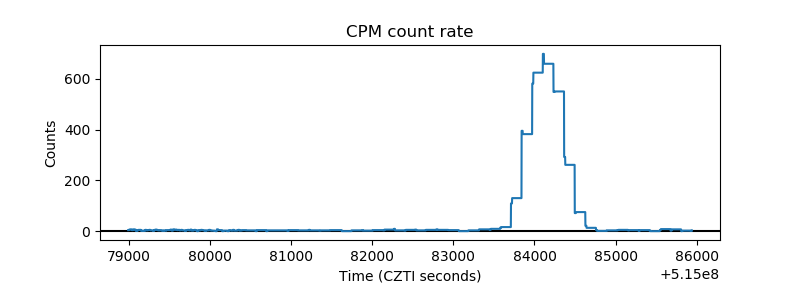 |
| CZT Counter | 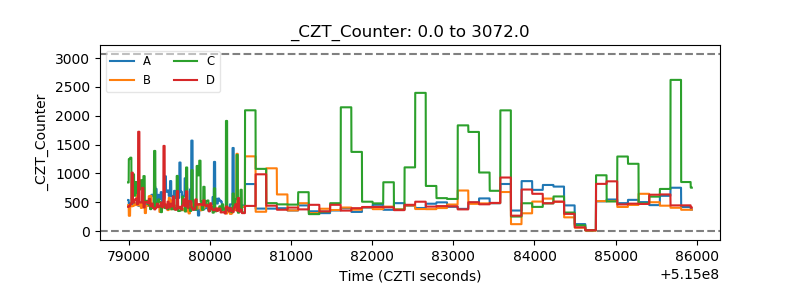 |
| +2.5 Volts monitor |  |
| +5 Volts monitor |  |
| _ROLL_ROT | 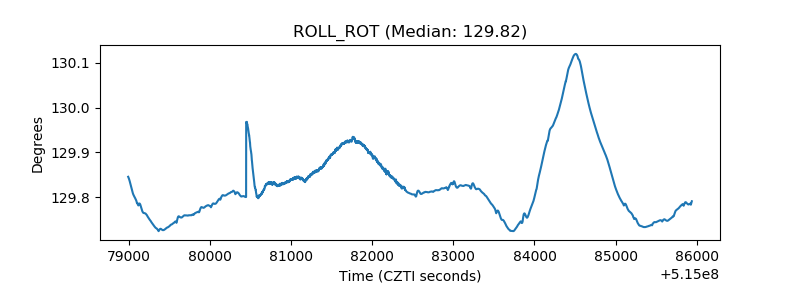 |
| _Roll_DEC | 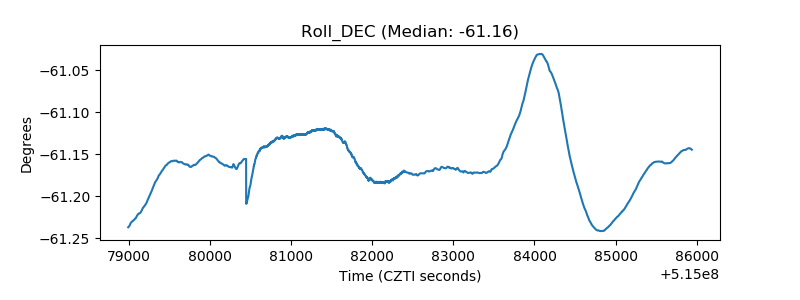 |
| _Roll_RA | 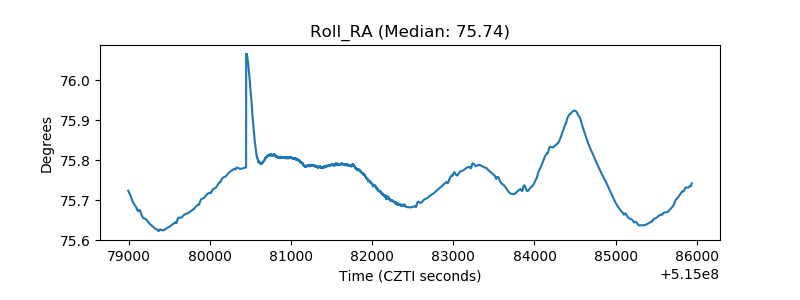 |
| Veto Counter | 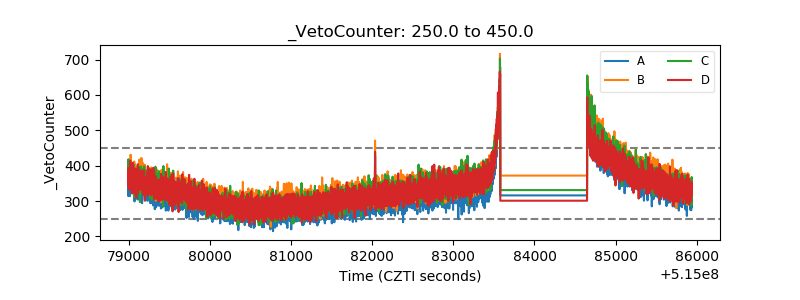 |