| Param | Original file | Final file |
|---|---|---|
| Filename | modeM0/AS1A14_049T03_9000006570_57261cztM0_level2.fits | modeM0/AS1A14_049T03_9000006570_57261cztM0_level2_quad_clean.evt |
| Size (bytes) | 454,582,080 | 92,237,760 |
| Size | 433.5 MB | 88.0 MB |
| Events in quadrant A | 2,794,671 | 634,126 |
| Events in quadrant B | 3,103,565 | 667,603 |
| Events in quadrant C | 7,261,217 | 492,142 |
| Events in quadrant D | 3,175,675 | 557,681 |
| Mode M0 | |||
|---|---|---|---|
| Quadrant | BADHDUFLAG | Total packets | Discarded packets |
| A | 0 | 12932 | 2 |
| B | 0 | 13774 | 2 |
| C | 0 | 26004 | 2 |
| D | 0 | 14095 | 3 |
| Mode M9 | |||
|---|---|---|---|
| Quadrant | BADHDUFLAG | Total packets | Discarded packets |
| A | 0 | 14 | 0 |
| B | 0 | 15 | 0 |
| C | 0 | 15 | 0 |
| D | 0 | 15 | 0 |
| Mode SS | |||
|---|---|---|---|
| Quadrant | BADHDUFLAG | Total packets | Discarded packets |
| A | 0 | 128 | 0 |
| B | 0 | 128 | 0 |
| C | 0 | 128 | 0 |
| D | 0 | 128 | 0 |
| Quadrant | Total seconds | Saturated seconds | Saturation percentage |
|---|---|---|---|
| A | 6325 | 21 | 0.332016% |
| B | 6325 | 148 | 2.339921% |
| C | 6325 | 1326 | 20.964427% |
| D | 6324 | 70 | 1.106894% |
Noise dominated data is calculated using 1-second bins in cleaned event files. If a bin has >2000 counts, and if more than 50% of those come from <1% of pixels, then it is considered to be noise-dominated and hence unusable.
| Quadrant | # 1 sec bins | Bins with >0 counts | Bins with >2000 counts | High rate bins dominated by noise | Noise dominated (total time) | Noise dominated (detector-on time) | Marked lightcurve |
|---|---|---|---|---|---|---|---|
| A | 7499 | 6324 | 2 | 2 | 0.03% | 0.03% | 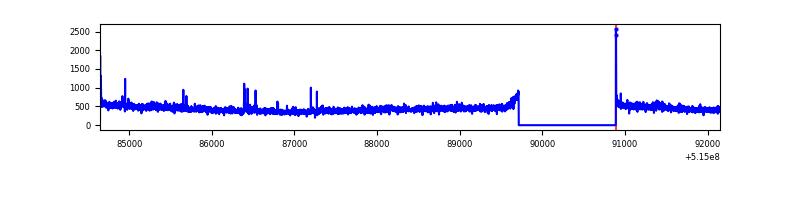 |
| B | 7499 | 6324 | 81 | 81 | 1.08% | 1.28% | 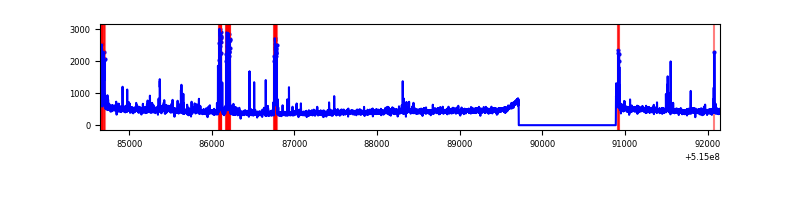 |
| C | 7499 | 6324 | 1271 | 1271 | 16.95% | 20.10% | 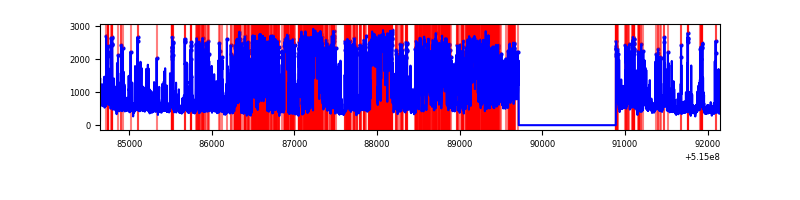 |
| D | 7498 | 6324 | 60 | 60 | 0.80% | 0.95% | 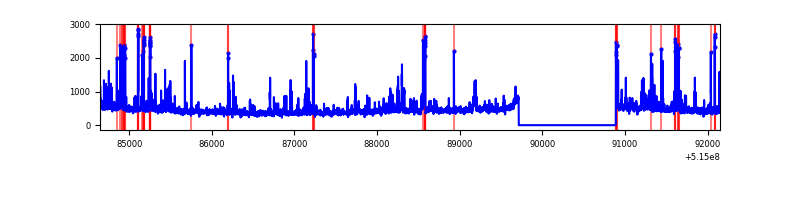 |
Top three noisy pixels from each quadrant. If the there are fewer than three noisy pixels in the level2.evt file, extra rows are filled as -1
| Pixel properties | Quadrant properties | ||||||
|---|---|---|---|---|---|---|---|
| Quadrant | DetID | PixID | Counts | Sigma | Mean | Median | Sigma |
| A | 4 | 249 | 61122 | 355.32 | 692 | 674 | 170.1 |
| A | 7 | 64 | 36386 | 209.92 | 692 | 674 | 170.1 |
| A | 13 | 254 | 9883 | 54.13 | 692 | 674 | 170.1 |
| B | 10 | 247 | 156417 | 1087.09 | 675 | 651 | 143.3 |
| B | 10 | 16 | 108721 | 754.22 | 675 | 651 | 143.3 |
| B | 7 | 252 | 74057 | 512.3 | 675 | 651 | 143.3 |
| C | 15 | 224 | 4668502 | 28513.96 | 599 | 594 | 163.7 |
| C | 14 | 254 | 101014 | 613.42 | 599 | 594 | 163.7 |
| C | 14 | 246 | 51088 | 308.44 | 599 | 594 | 163.7 |
| D | 2 | 249 | 179128 | 937.77 | 657 | 627 | 190.3 |
| D | 8 | 240 | 92605 | 483.21 | 657 | 627 | 190.3 |
| D | 2 | 31 | 80063 | 417.32 | 657 | 627 | 190.3 |
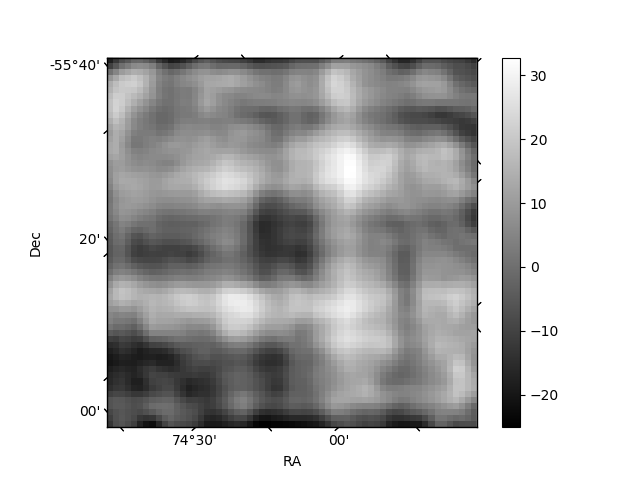
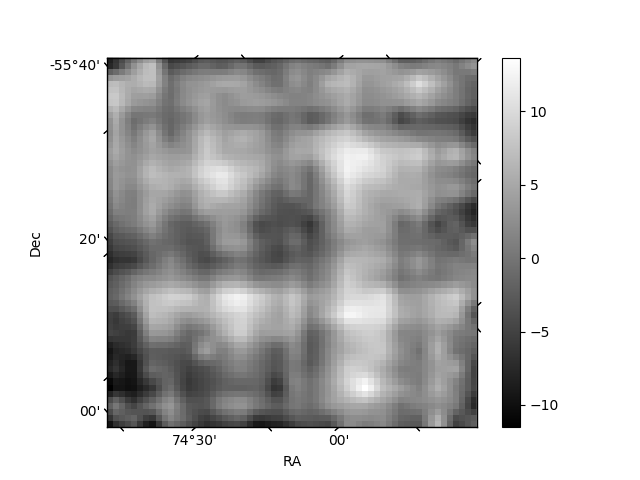
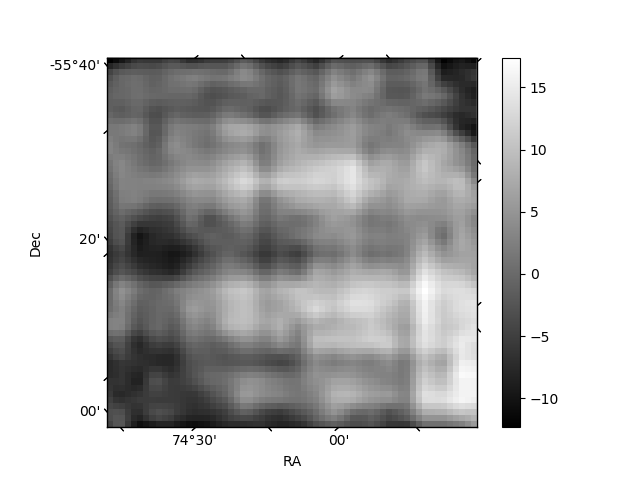
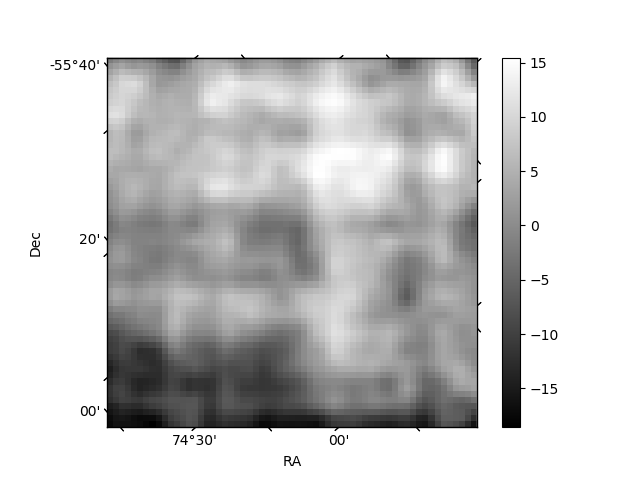
Histogram calculated using DETX and DETY for each event in the final _common_clean file
| Quadrant A | 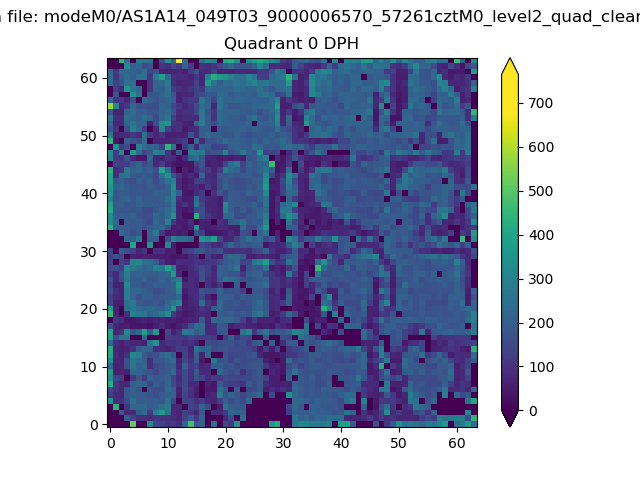 |
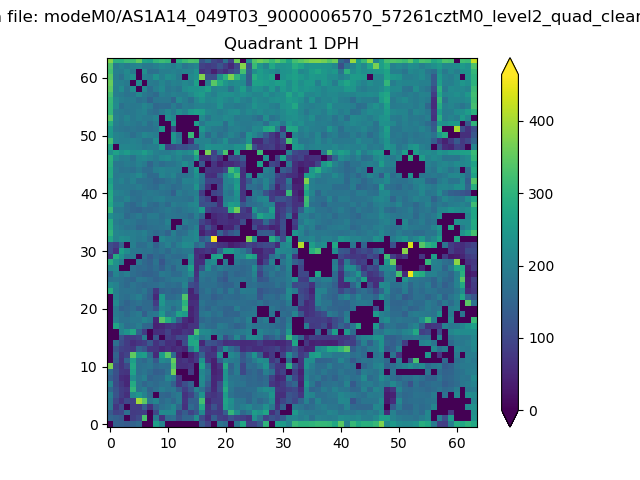 |
Quadrant B |
|---|---|---|---|
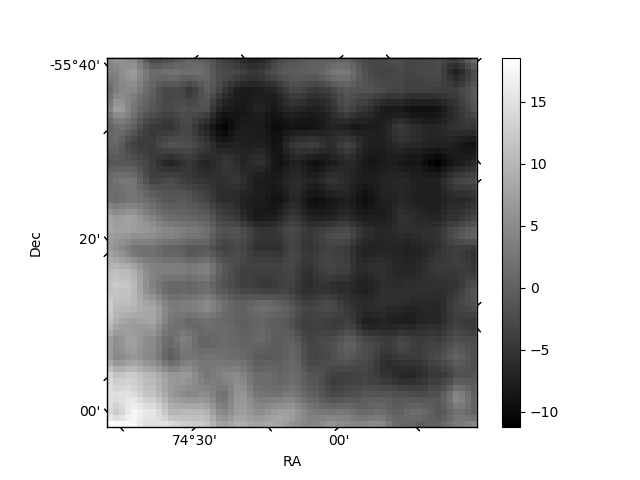
| Quadrant D | 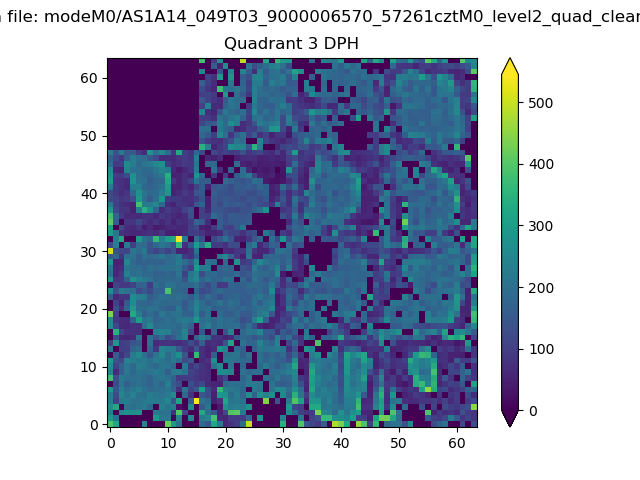 |
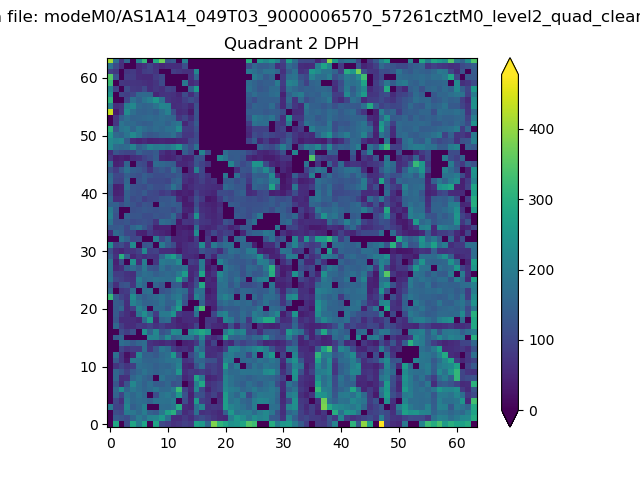 |
Quadrant C |
| Plot type | Count rate plots | Images |
|---|---|---|
| Comparison with Poisson distribution Blue bars denote a histogram of data divided into 1 sec bins. Red curve is a Poisson curve with rate = median count rate of data. |
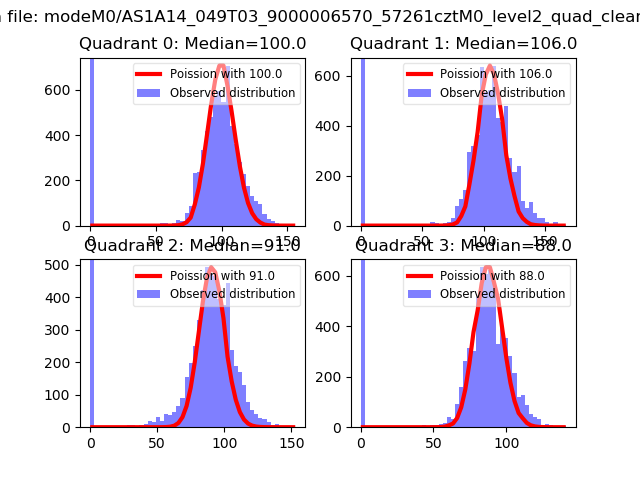 |
 |
| Quadrant-wise count rates Data is divided into 100 sec bins |
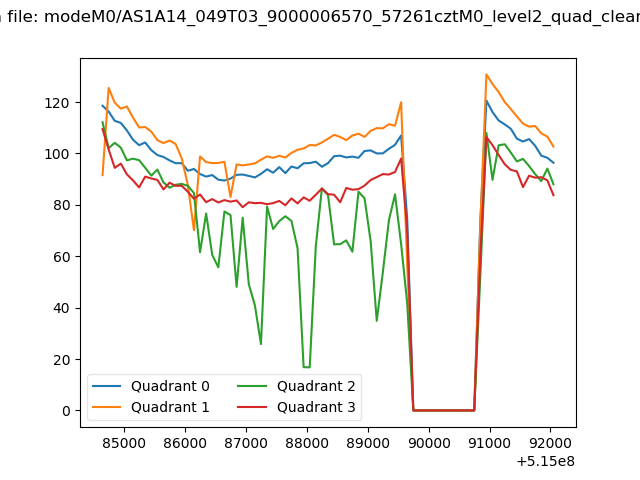 |
|
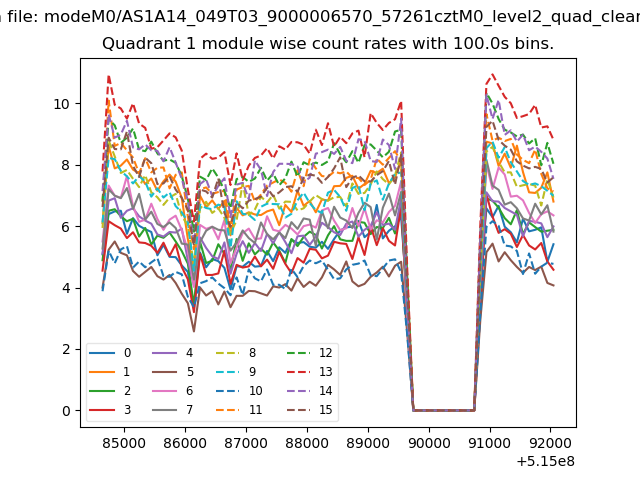
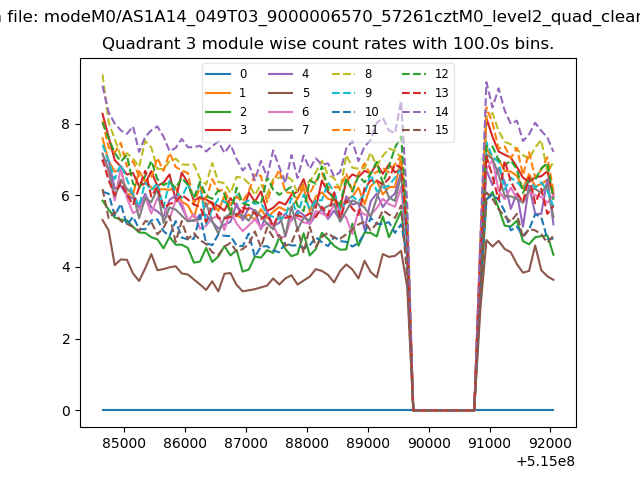
| Module-wise count rates for Quadrant A Data is divided into 100 sec bins |
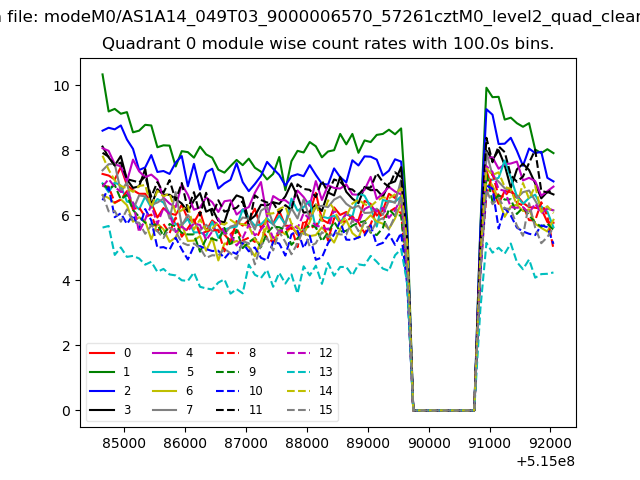 |
 |
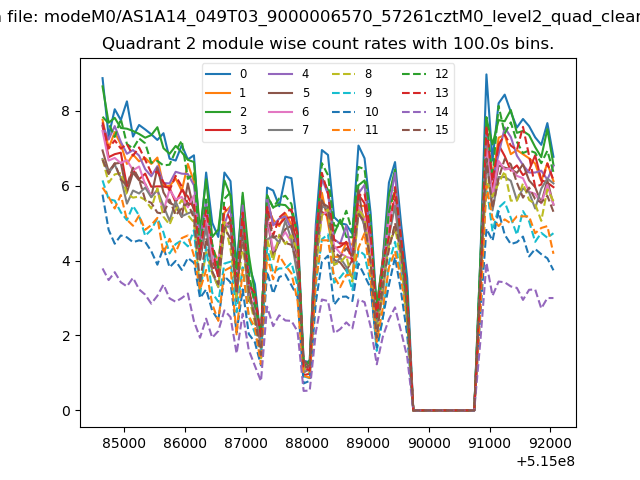
| Module-wise count rates for Quadrant B Data is divided into 100 sec bins |
 |
 |
| Module-wise count rates for Quadrant C Data is divided into 100 sec bins |
 |
 |
| Module-wise count rates for Quadrant D Data is divided into 100 sec bins |
 |
 |
| Parameter | Plot |
|---|---|
| CZT HV Monitor | 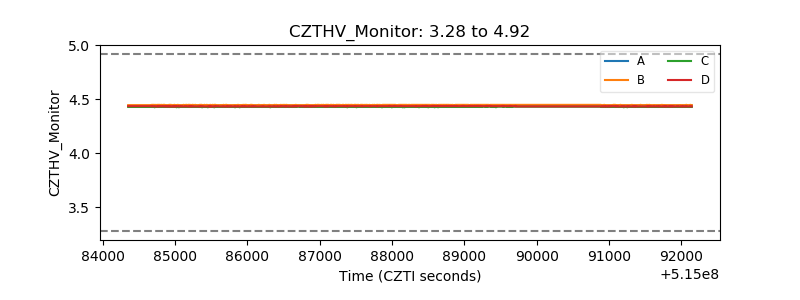 |
| D_VDD | 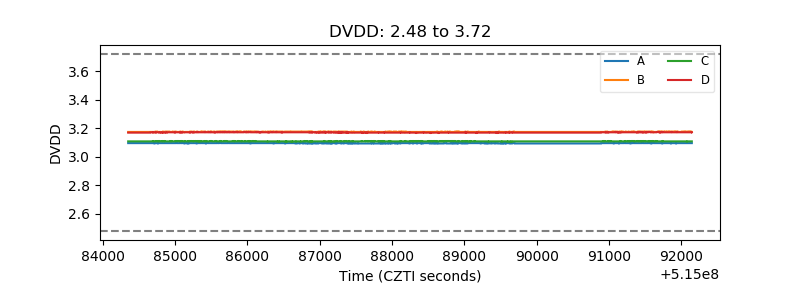 |
| Temperature 1 | 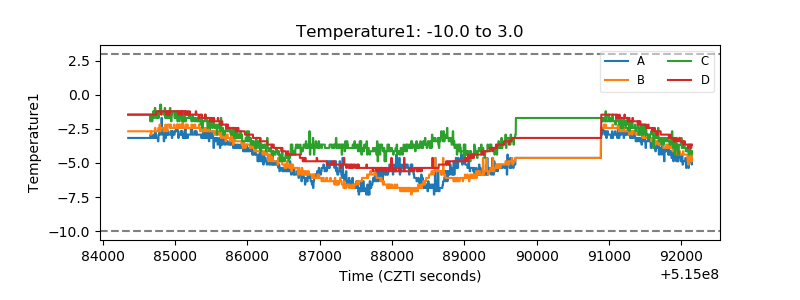 |
| Veto HV Monitor | 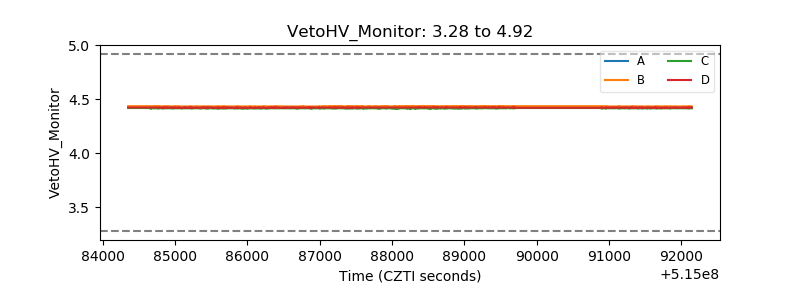 |
| Veto LLD | 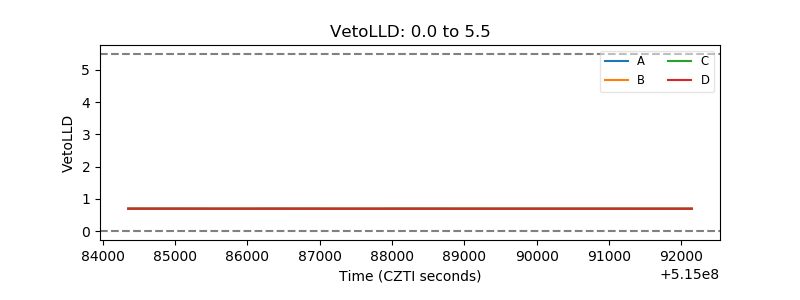 |
| Alpha Counter | 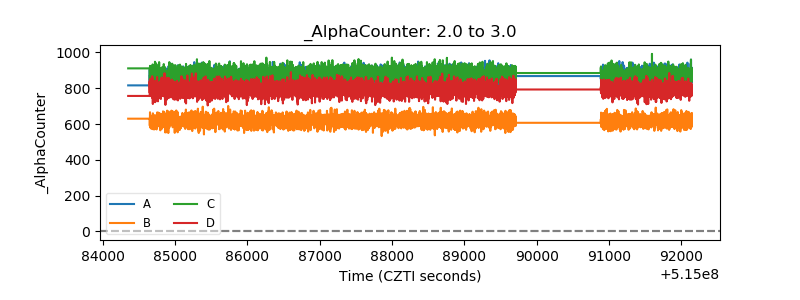 |
| _CPM_Rate | 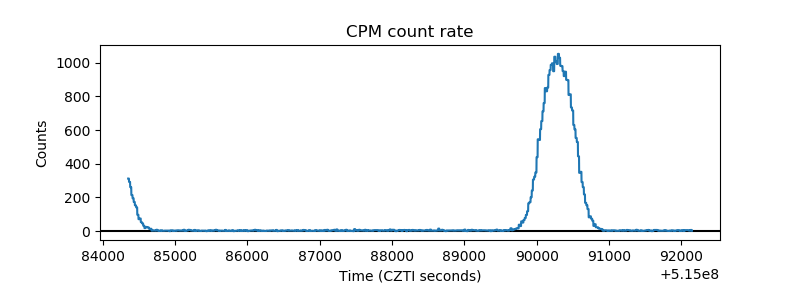 |
| CZT Counter | 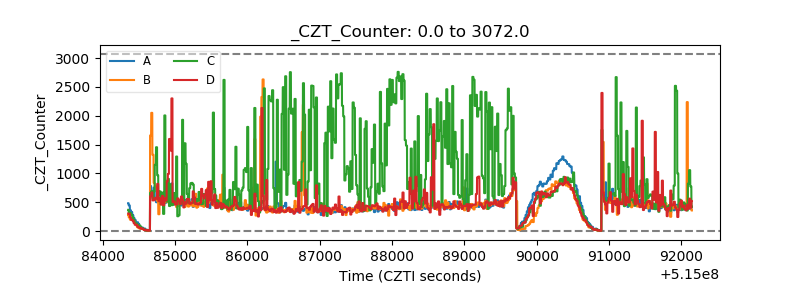 |
| +2.5 Volts monitor |  |
| +5 Volts monitor |  |
| _ROLL_ROT | 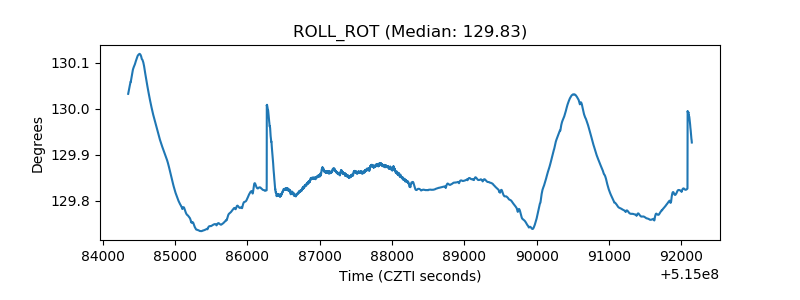 |
| _Roll_DEC | 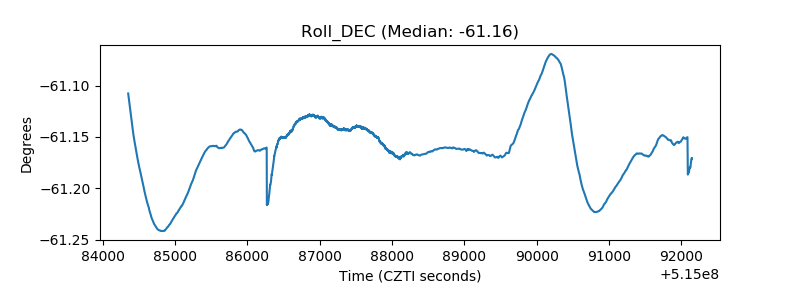 |
| _Roll_RA | 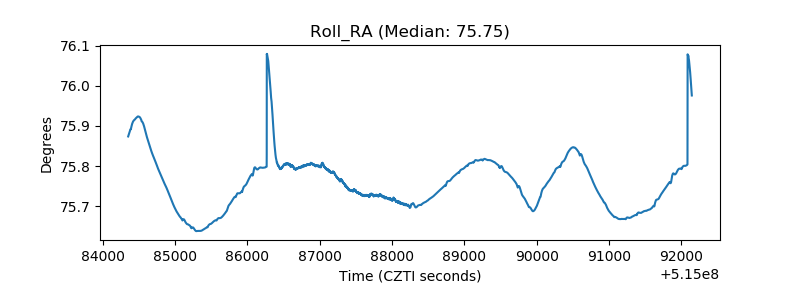 |
| Veto Counter | 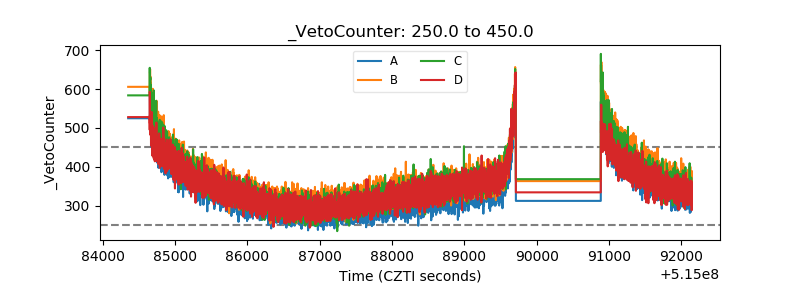 |