| Param | Original file | Final file |
|---|---|---|
| Filename | modeM0/AS1A14_049T03_9000006570_57262cztM0_level2.fits | modeM0/AS1A14_049T03_9000006570_57262cztM0_level2_quad_clean.evt |
| Size (bytes) | 448,404,480 | 92,376,000 |
| Size | 427.6 MB | 88.1 MB |
| Events in quadrant A | 2,780,448 | 636,582 |
| Events in quadrant B | 2,909,881 | 681,019 |
| Events in quadrant C | 7,134,115 | 487,516 |
| Events in quadrant D | 3,288,346 | 555,938 |
| Mode M0 | |||
|---|---|---|---|
| Quadrant | BADHDUFLAG | Total packets | Discarded packets |
| A | 0 | 12991 | 49 |
| B | 0 | 13143 | 50 |
| C | 0 | 25824 | 219 |
| D | 0 | 14359 | 56 |
| Mode M9 | |||
|---|---|---|---|
| Quadrant | BADHDUFLAG | Total packets | Discarded packets |
| A | 0 | 18 | 0 |
| B | 0 | 18 | 0 |
| C | 0 | 18 | 0 |
| D | 0 | 19 | 0 |
| Mode SS | |||
|---|---|---|---|
| Quadrant | BADHDUFLAG | Total packets | Discarded packets |
| A | 0 | 128 | 0 |
| B | 0 | 128 | 0 |
| C | 0 | 128 | 0 |
| D | 0 | 128 | 0 |
| Quadrant | Total seconds | Saturated seconds | Saturation percentage |
|---|---|---|---|
| A | 6247 | 23 | 0.368177% |
| B | 6245 | 57 | 0.912730% |
| C | 6224 | 1345 | 21.609897% |
| D | 6251 | 79 | 1.263798% |
Noise dominated data is calculated using 1-second bins in cleaned event files. If a bin has >2000 counts, and if more than 50% of those come from <1% of pixels, then it is considered to be noise-dominated and hence unusable.
| Quadrant | # 1 sec bins | Bins with >0 counts | Bins with >2000 counts | High rate bins dominated by noise | Noise dominated (total time) | Noise dominated (detector-on time) | Marked lightcurve |
|---|---|---|---|---|---|---|---|
| A | 7483 | 6251 | 6 | 6 | 0.08% | 0.10% | 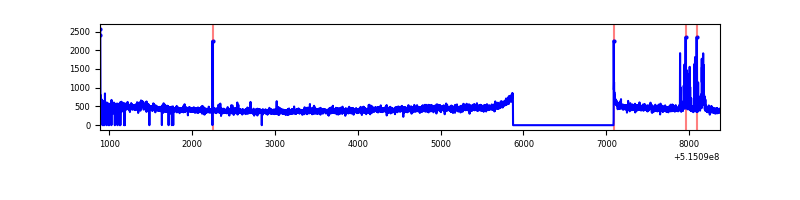 |
| B | 7483 | 6248 | 10 | 10 | 0.13% | 0.16% | 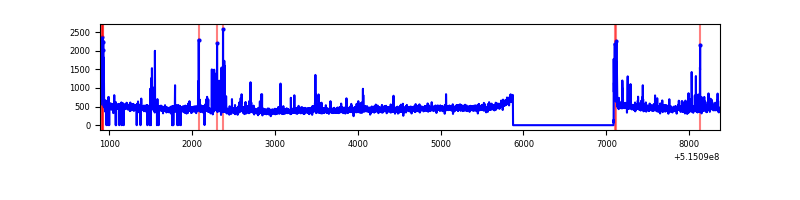 |
| C | 7483 | 6241 | 1283 | 1283 | 17.15% | 20.56% | 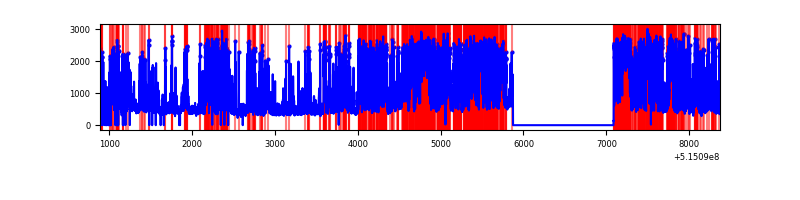 |
| D | 7483 | 6258 | 80 | 80 | 1.07% | 1.28% | 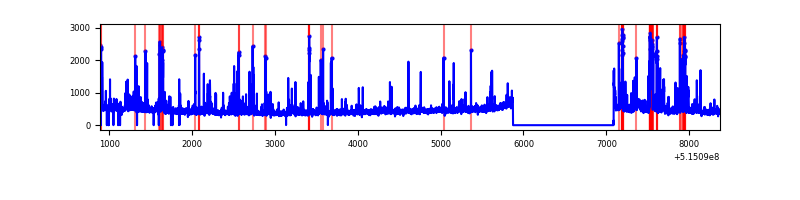 |
Top three noisy pixels from each quadrant. If the there are fewer than three noisy pixels in the level2.evt file, extra rows are filled as -1
| Pixel properties | Quadrant properties | ||||||
|---|---|---|---|---|---|---|---|
| Quadrant | DetID | PixID | Counts | Sigma | Mean | Median | Sigma |
| A | 10 | 251 | 91652 | 538.05 | 686 | 670 | 169.1 |
| A | 4 | 249 | 17040 | 96.81 | 686 | 670 | 169.1 |
| A | 13 | 254 | 9224 | 50.59 | 686 | 670 | 169.1 |
| B | 7 | 252 | 63584 | 433.9 | 677 | 652 | 145.0 |
| B | 10 | 16 | 50208 | 341.67 | 677 | 652 | 145.0 |
| B | 8 | 234 | 43720 | 296.94 | 677 | 652 | 145.0 |
| C | 15 | 224 | 4559534 | 28502.24 | 585 | 579 | 160.0 |
| C | 14 | 254 | 106376 | 661.43 | 585 | 579 | 160.0 |
| C | 12 | 254 | 52439 | 324.22 | 585 | 579 | 160.0 |
| D | 2 | 120 | 184118 | 988.09 | 649 | 622 | 185.7 |
| D | 7 | 96 | 168762 | 905.4 | 649 | 622 | 185.7 |
| D | 2 | 249 | 118211 | 633.2 | 649 | 622 | 185.7 |
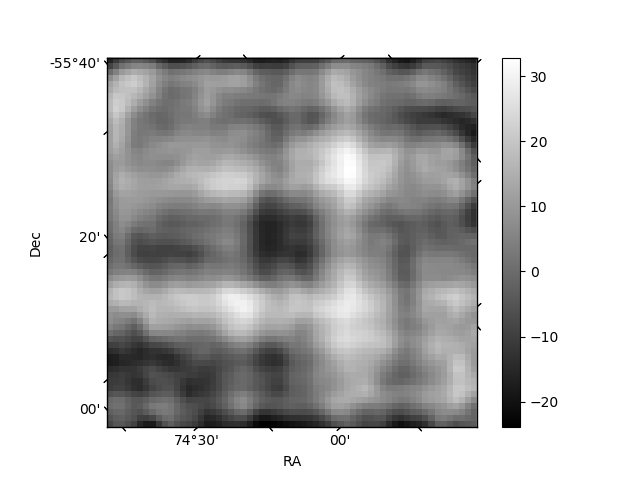
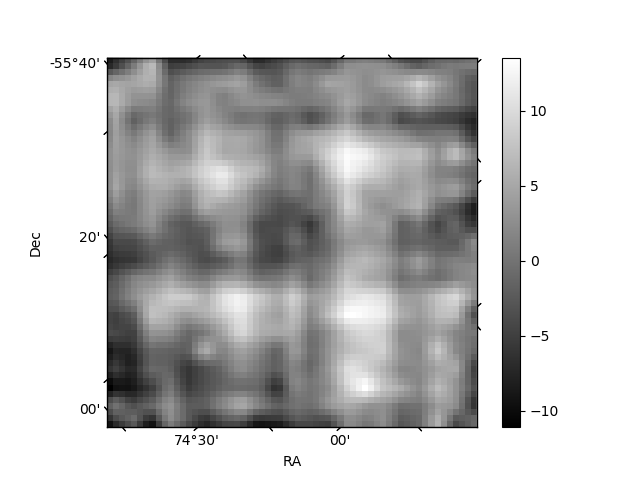
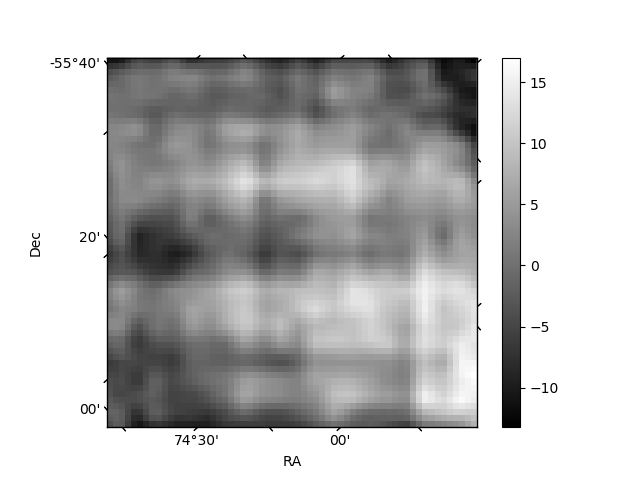
Histogram calculated using DETX and DETY for each event in the final _common_clean file
| Quadrant A | 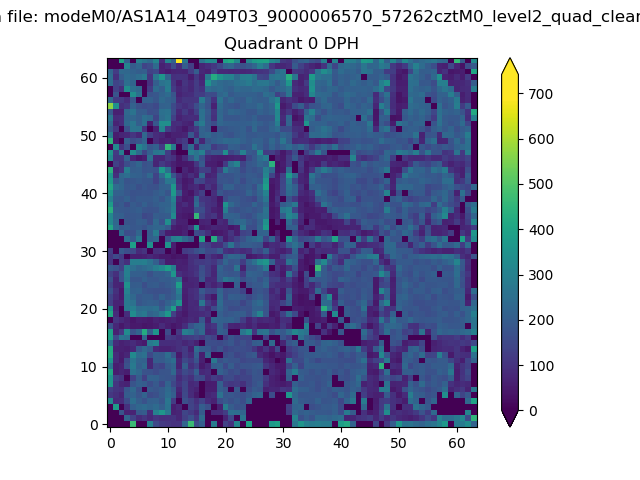 |
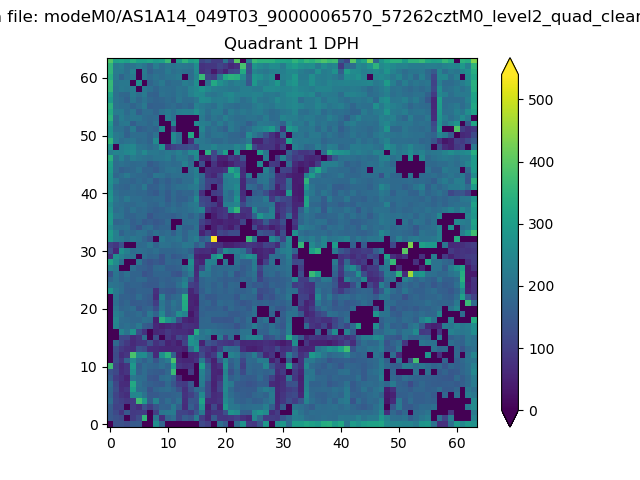 |
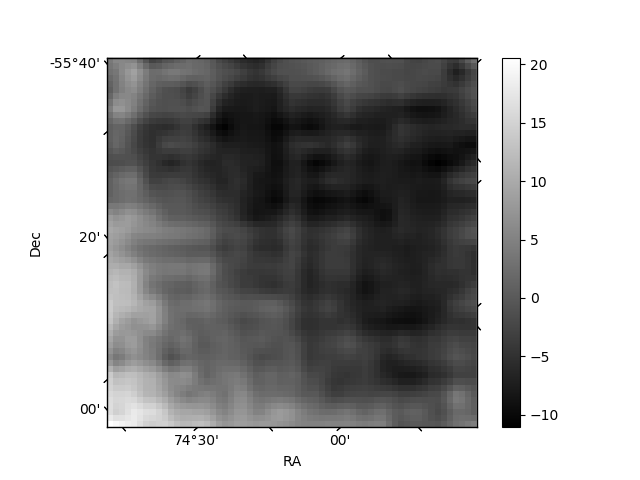
Quadrant B |
|---|---|---|---|
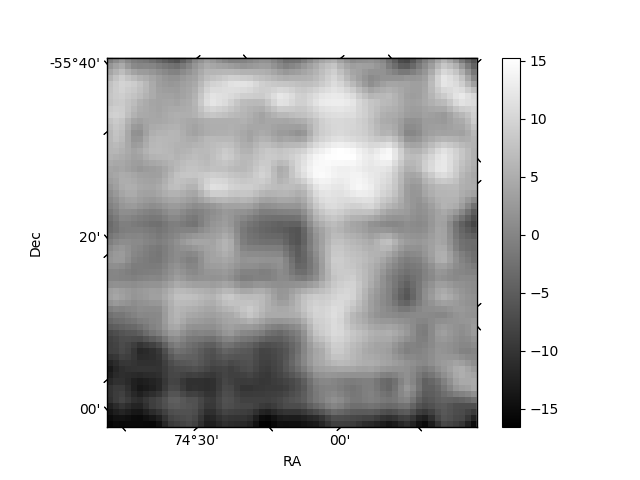
| Quadrant D | 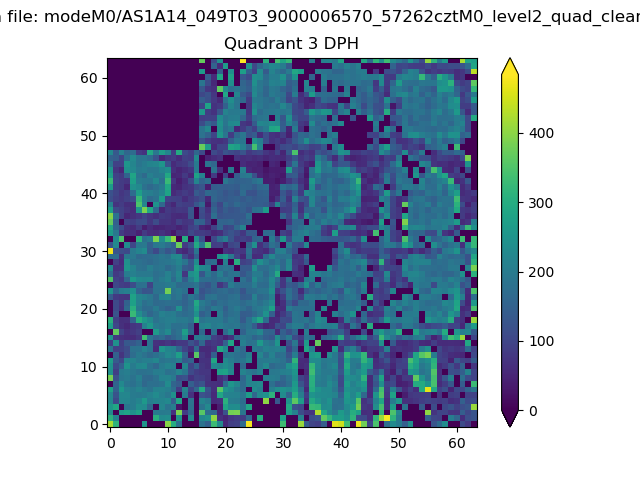 |
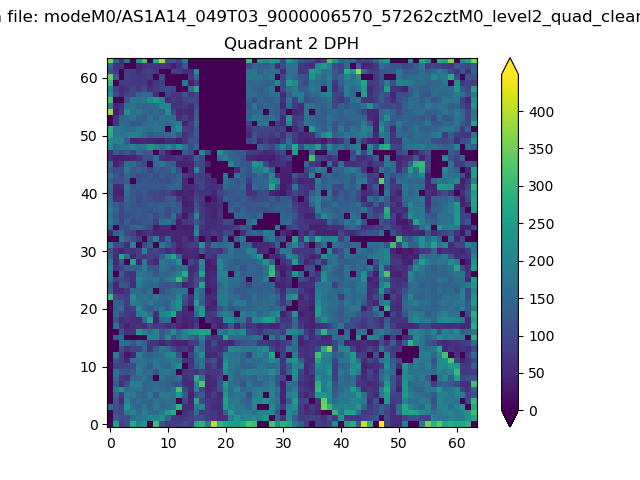 |
Quadrant C |
| Plot type | Count rate plots | Images |
|---|---|---|
| Comparison with Poisson distribution Blue bars denote a histogram of data divided into 1 sec bins. Red curve is a Poisson curve with rate = median count rate of data. |
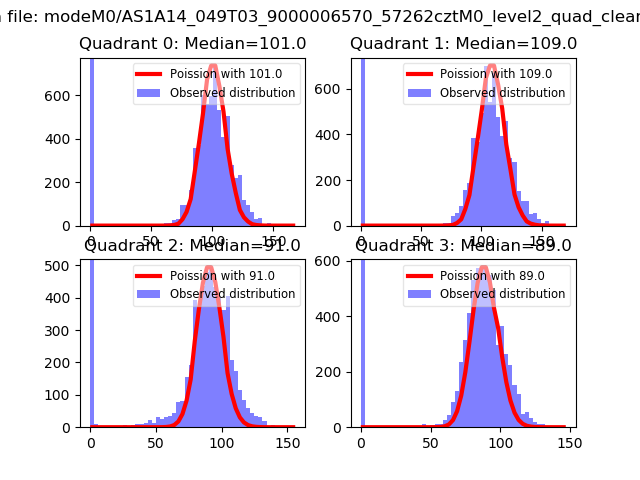 |
 |
| Quadrant-wise count rates Data is divided into 100 sec bins |
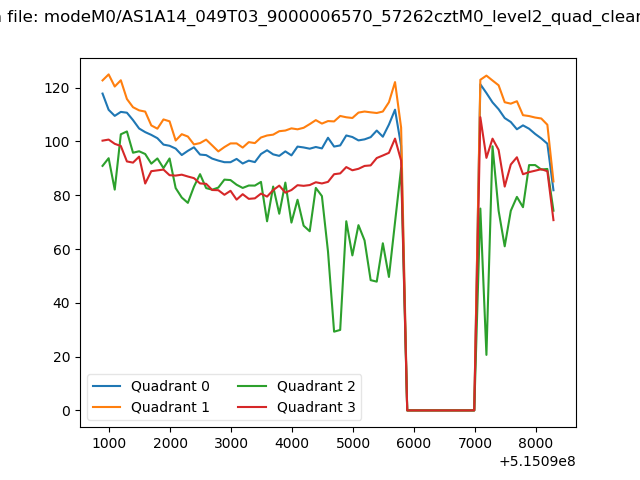 |
|
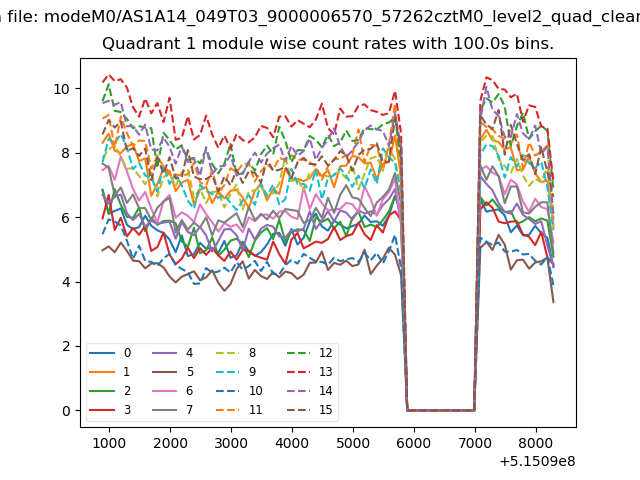
| Module-wise count rates for Quadrant A Data is divided into 100 sec bins |
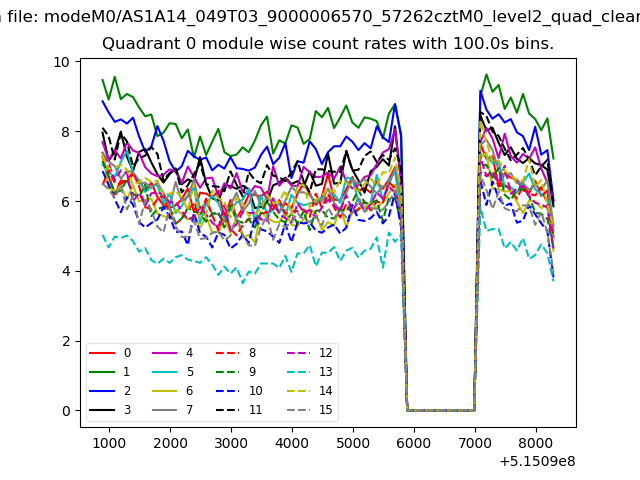 |
 |
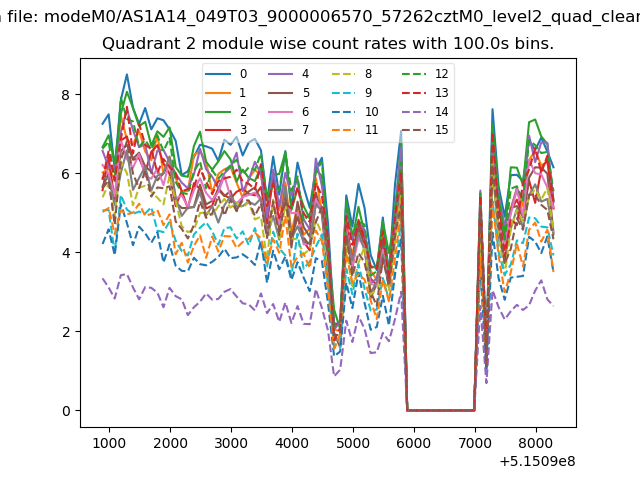
| Module-wise count rates for Quadrant B Data is divided into 100 sec bins |
 |
 |
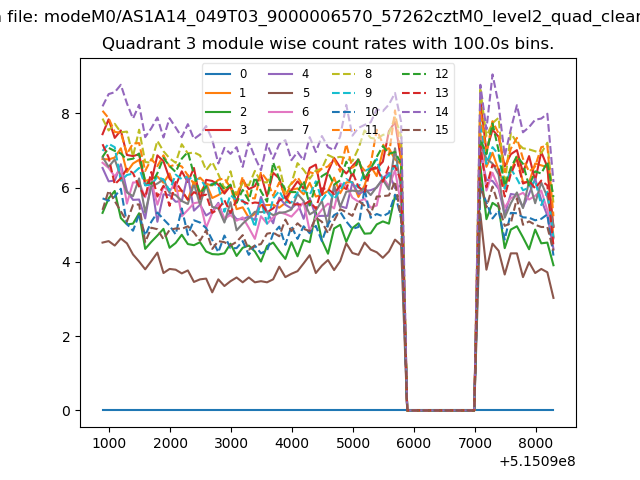
| Module-wise count rates for Quadrant C Data is divided into 100 sec bins |
 |
 |
| Module-wise count rates for Quadrant D Data is divided into 100 sec bins |
 |
 |
| Parameter | Plot |
|---|---|
| CZT HV Monitor | 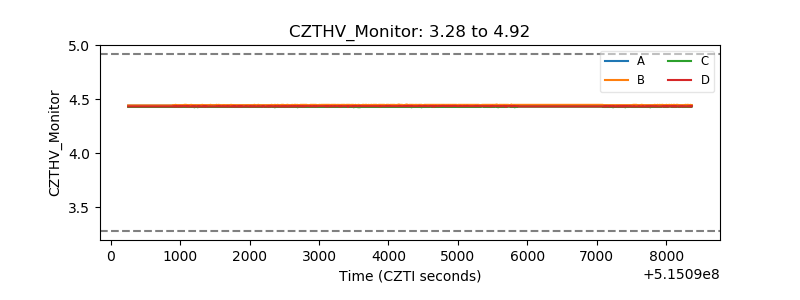 |
| D_VDD | 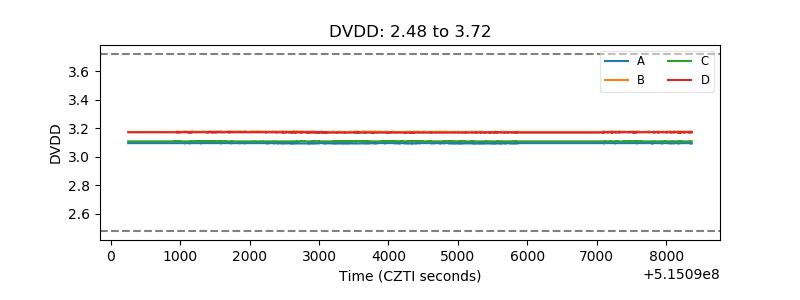 |
| Temperature 1 | 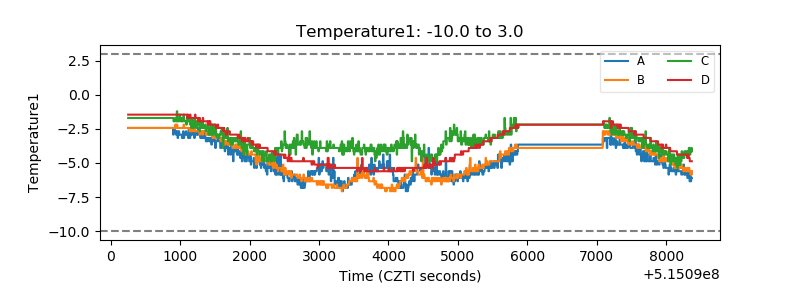 |
| Veto HV Monitor | 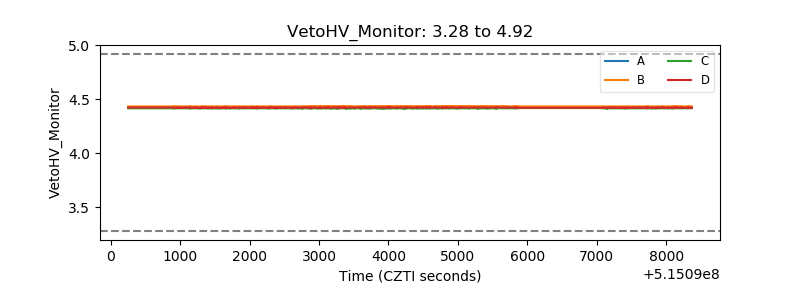 |
| Veto LLD | 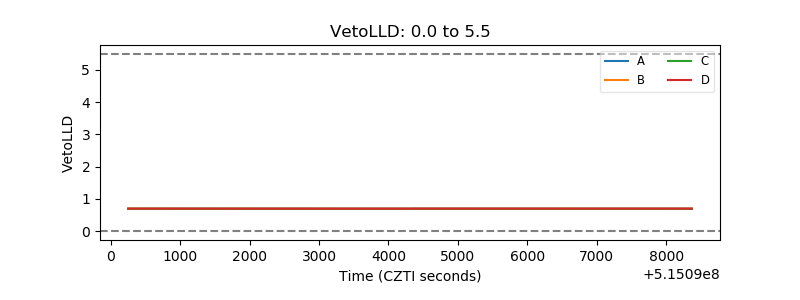 |
| Alpha Counter | 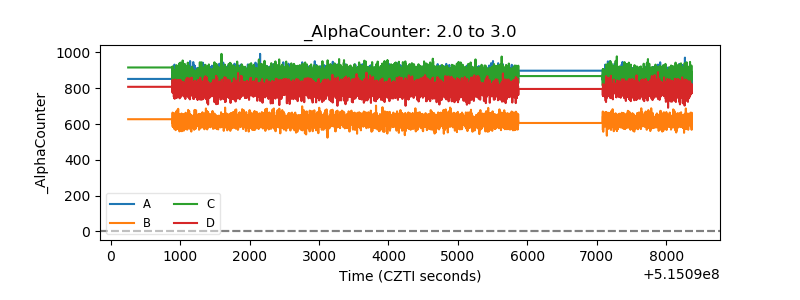 |
| _CPM_Rate | 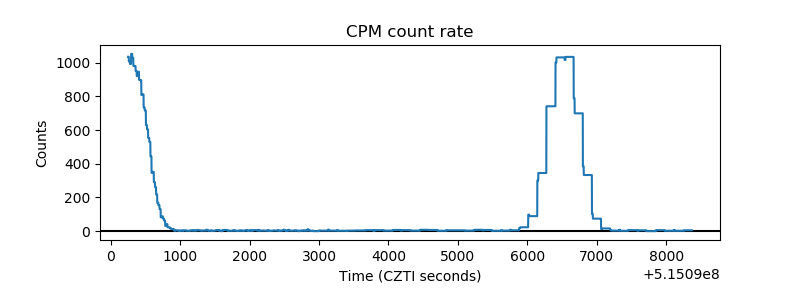 |
| CZT Counter | 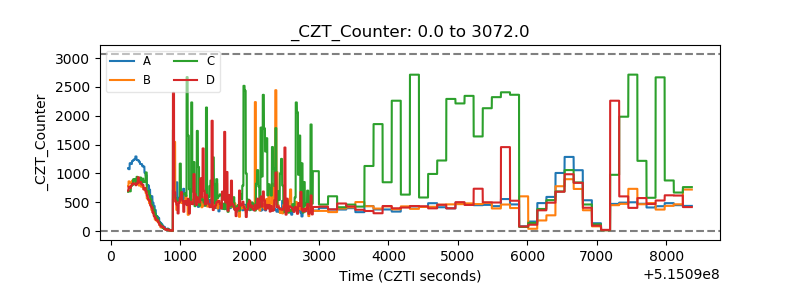 |
| +2.5 Volts monitor |  |
| +5 Volts monitor |  |
| _ROLL_ROT | 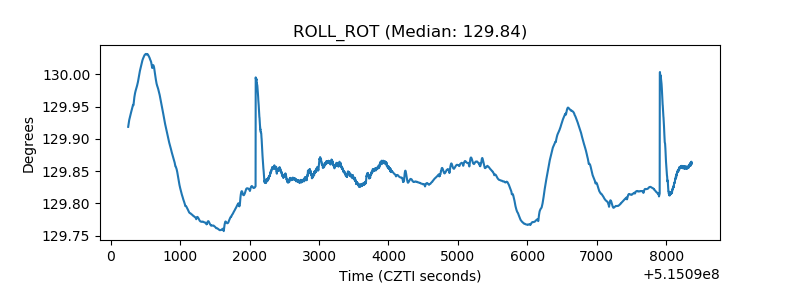 |
| _Roll_DEC | 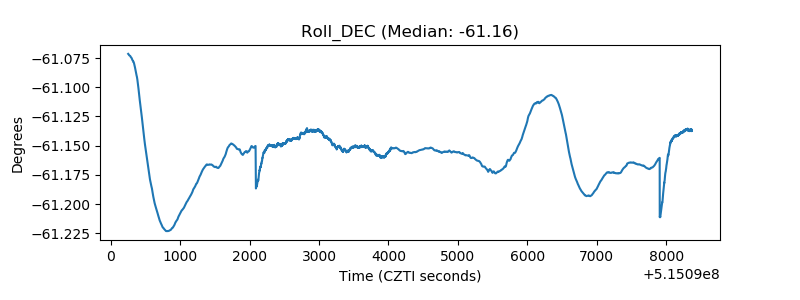 |
| _Roll_RA | 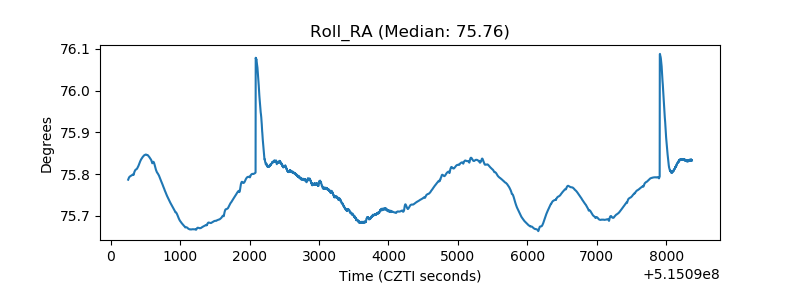 |
| Veto Counter | 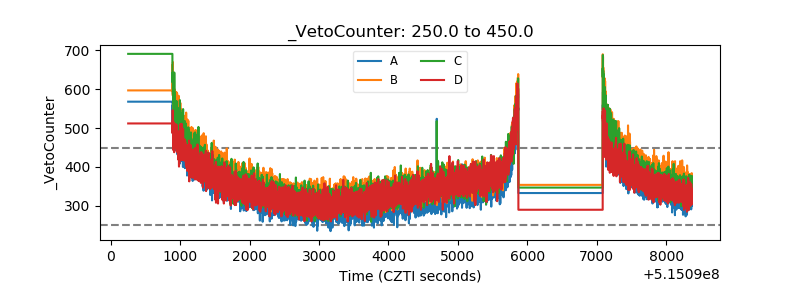 |