| Param | Original file | Final file |
|---|---|---|
| Filename | modeM0/AS1A14_049T03_9000006570_57265cztM0_level2.fits | modeM0/AS1A14_049T03_9000006570_57265cztM0_level2_quad_clean.evt |
| Size (bytes) | 440,020,800 | 81,080,640 |
| Size | 419.6 MB | 77.3 MB |
| Events in quadrant A | 2,984,555 | 534,983 |
| Events in quadrant B | 3,051,626 | 578,912 |
| Events in quadrant C | 6,686,266 | 421,873 |
| Events in quadrant D | 3,061,718 | 466,939 |
| Mode M0 | |||
|---|---|---|---|
| Quadrant | BADHDUFLAG | Total packets | Discarded packets |
| A | 0 | 13295 | 1 |
| B | 0 | 13895 | 1 |
| C | 0 | 24418 | 1 |
| D | 0 | 13994 | 2 |
| Mode M9 | |||
|---|---|---|---|
| Quadrant | BADHDUFLAG | Total packets | Discarded packets |
| A | 0 | 9 | 0 |
| B | 0 | 9 | 0 |
| C | 0 | 9 | 0 |
| D | 0 | 9 | 0 |
| Mode SS | |||
|---|---|---|---|
| Quadrant | BADHDUFLAG | Total packets | Discarded packets |
| A | 0 | 132 | 0 |
| B | 0 | 132 | 0 |
| C | 0 | 132 | 0 |
| D | 0 | 132 | 0 |
| Quadrant | Total seconds | Saturated seconds | Saturation percentage |
|---|---|---|---|
| A | 6479 | 20 | 0.308690% |
| B | 6480 | 69 | 1.064815% |
| C | 6480 | 950 | 14.660494% |
| D | 6479 | 61 | 0.941503% |
Noise dominated data is calculated using 1-second bins in cleaned event files. If a bin has >2000 counts, and if more than 50% of those come from <1% of pixels, then it is considered to be noise-dominated and hence unusable.
| Quadrant | # 1 sec bins | Bins with >0 counts | Bins with >2000 counts | High rate bins dominated by noise | Noise dominated (total time) | Noise dominated (detector-on time) | Marked lightcurve |
|---|---|---|---|---|---|---|---|
| A | 7629 | 6765 | 2 | 2 | 0.03% | 0.03% | 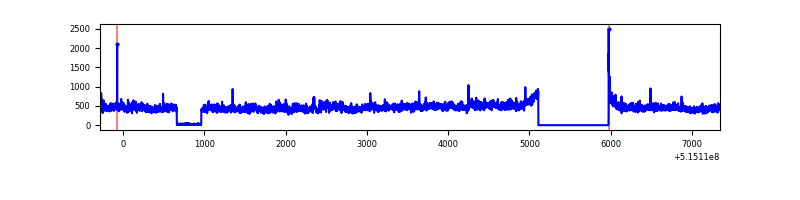 |
| B | 7630 | 6766 | 28 | 28 | 0.37% | 0.41% | 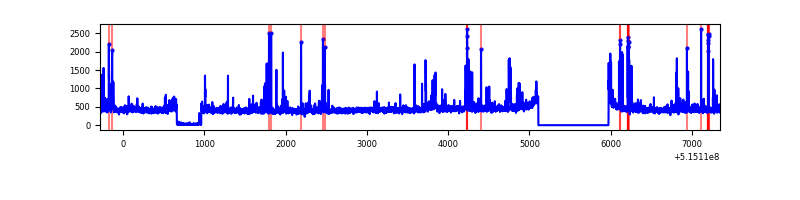 |
| C | 7630 | 6738 | 885 | 885 | 11.60% | 13.13% | 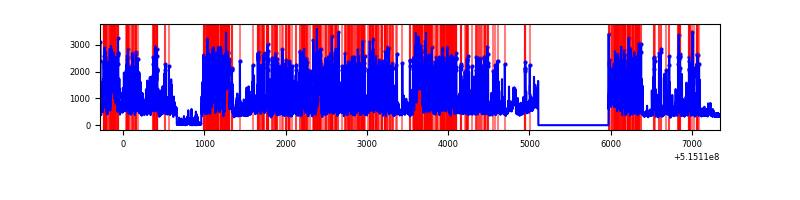 |
| D | 7629 | 6765 | 50 | 50 | 0.66% | 0.74% | 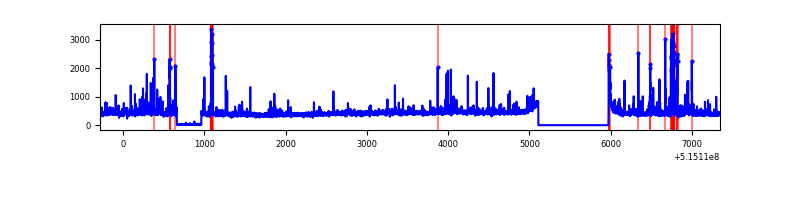 |
Top three noisy pixels from each quadrant. If the there are fewer than three noisy pixels in the level2.evt file, extra rows are filled as -1
| Pixel properties | Quadrant properties | ||||||
|---|---|---|---|---|---|---|---|
| Quadrant | DetID | PixID | Counts | Sigma | Mean | Median | Sigma |
| A | 8 | 4 | 312894 | 1847.65 | 682 | 664 | 169.0 |
| A | 3 | 14 | 18699 | 106.72 | 682 | 664 | 169.0 |
| A | 3 | 137 | 8282 | 45.08 | 682 | 664 | 169.0 |
| B | 8 | 234 | 97296 | 680.38 | 673 | 648 | 142.1 |
| B | 7 | 252 | 89764 | 627.35 | 673 | 648 | 142.1 |
| B | 5 | 185 | 54604 | 379.84 | 673 | 648 | 142.1 |
| C | 15 | 224 | 3744067 | 22057.62 | 618 | 611 | 169.7 |
| C | 6 | 13 | 258707 | 1520.78 | 618 | 611 | 169.7 |
| C | 14 | 246 | 97494 | 570.87 | 618 | 611 | 169.7 |
| D | 8 | 240 | 125745 | 681.56 | 652 | 622 | 183.6 |
| D | 5 | 32 | 100602 | 544.6 | 652 | 622 | 183.6 |
| D | 2 | 249 | 70835 | 382.46 | 652 | 622 | 183.6 |
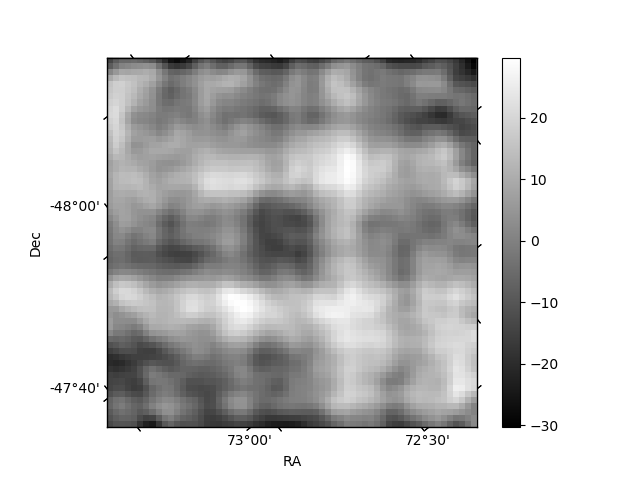
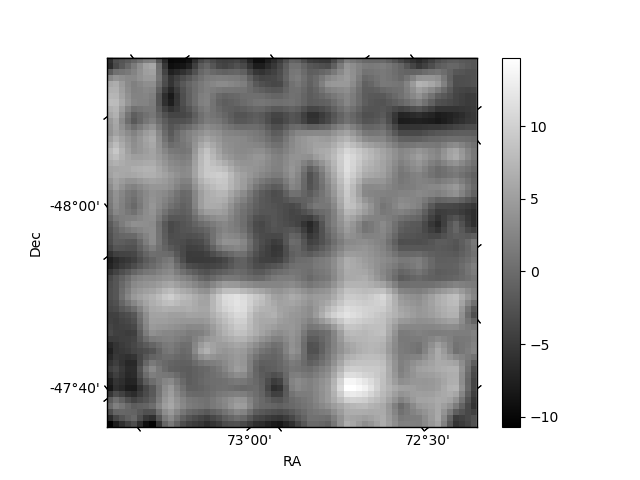
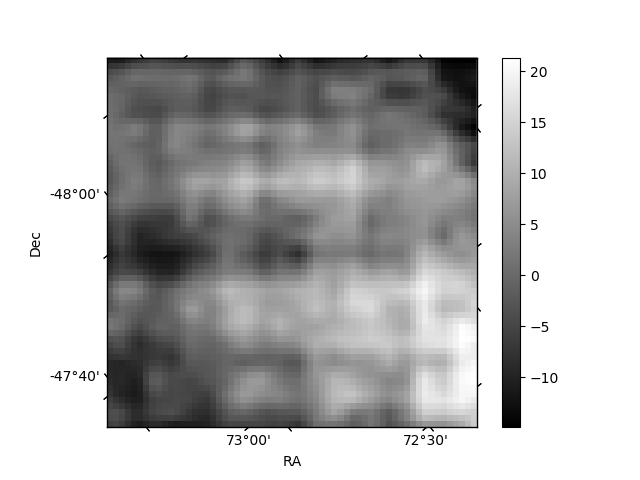
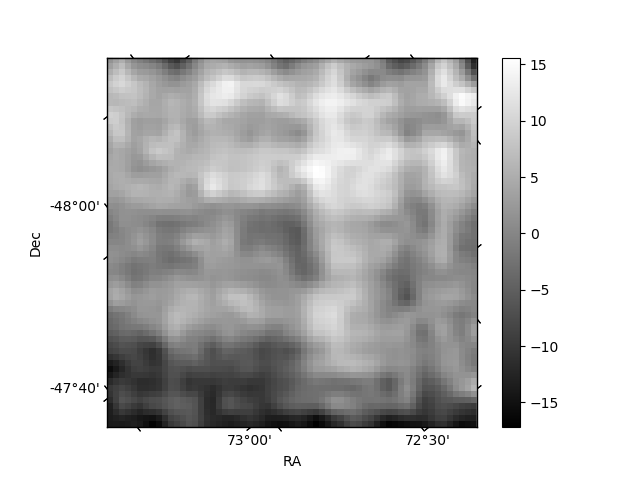
Histogram calculated using DETX and DETY for each event in the final _common_clean file
| Quadrant A | 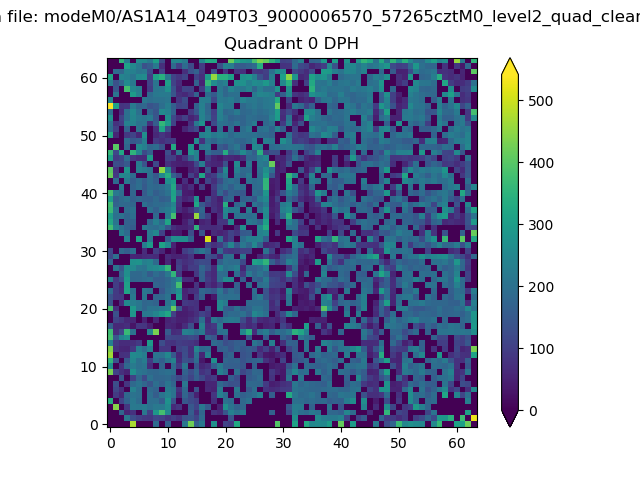 |
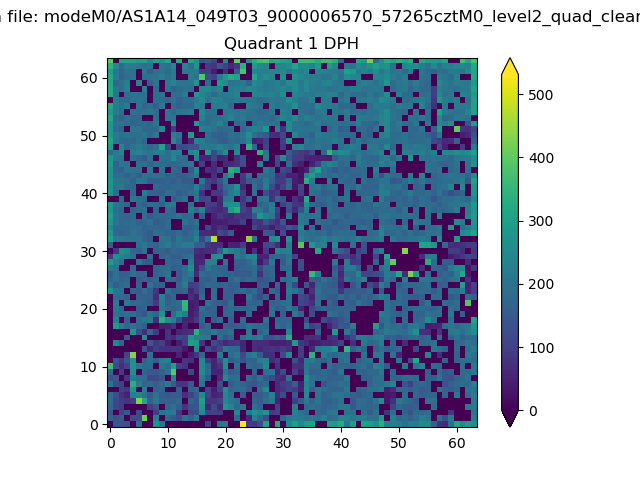 |
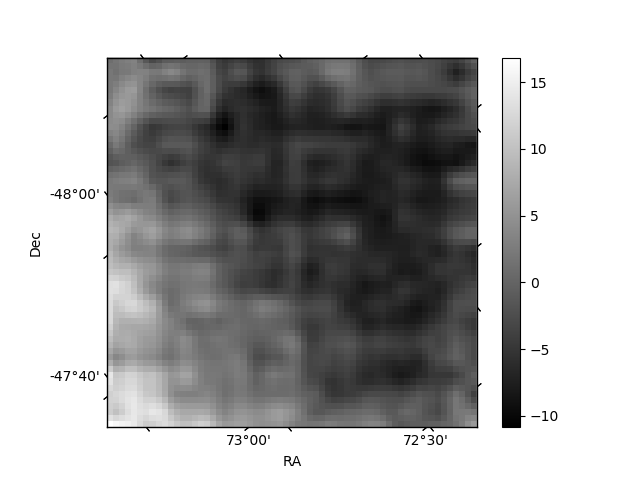
Quadrant B |
|---|---|---|---|
| Quadrant D | 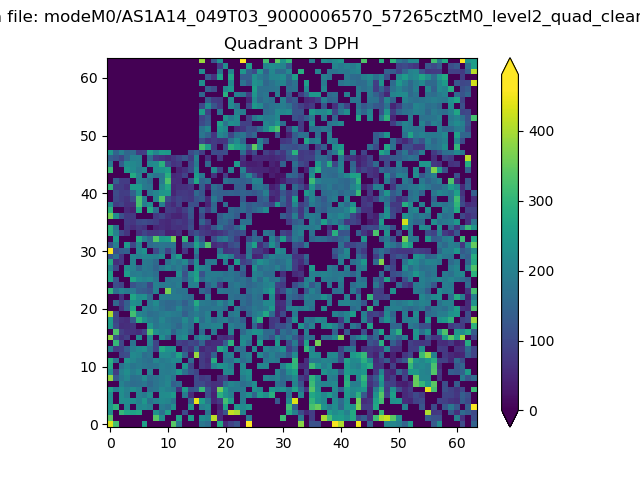 |
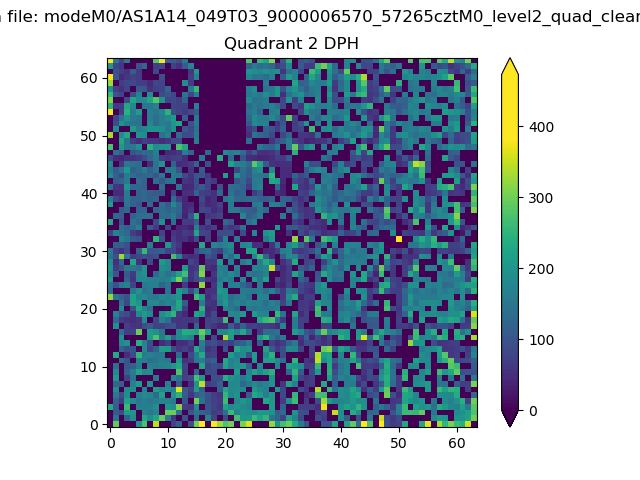 |
Quadrant C |
| Plot type | Count rate plots | Images |
|---|---|---|
| Comparison with Poisson distribution Blue bars denote a histogram of data divided into 1 sec bins. Red curve is a Poisson curve with rate = median count rate of data. |
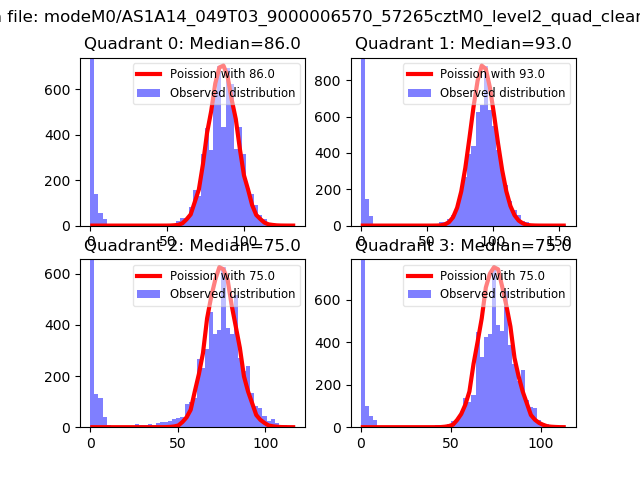 |
 |
| Quadrant-wise count rates Data is divided into 100 sec bins |
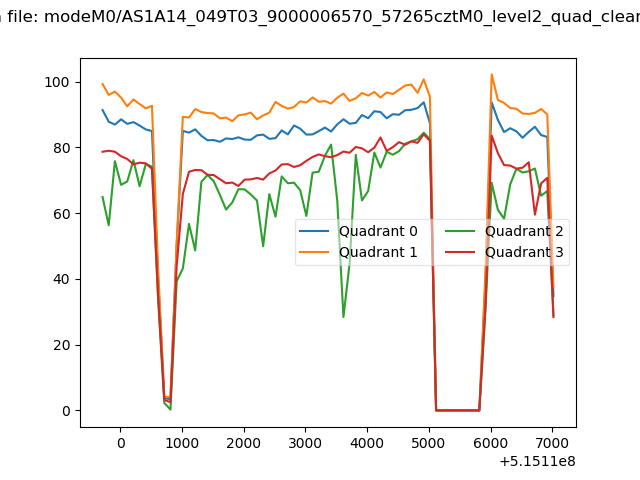 |
|
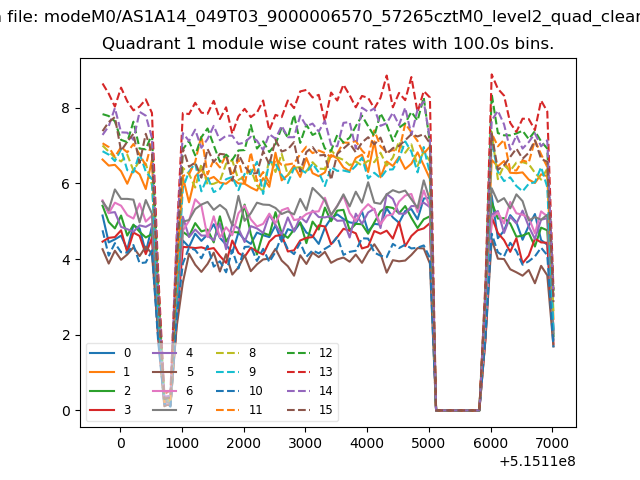
| Module-wise count rates for Quadrant A Data is divided into 100 sec bins |
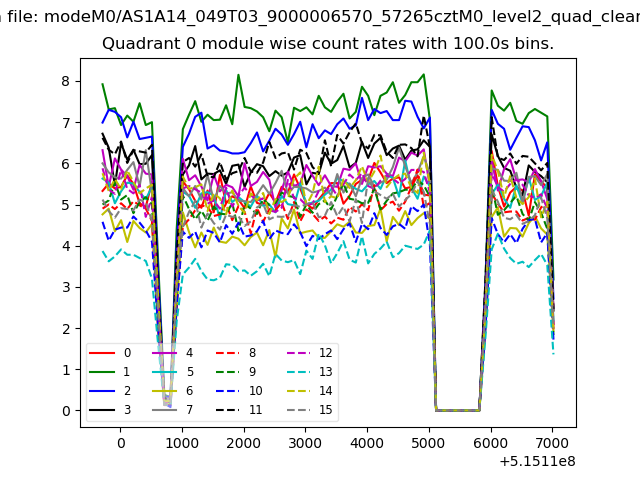 |
 |
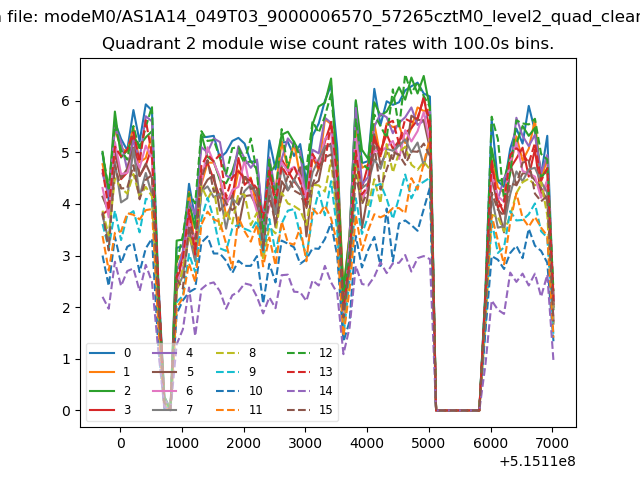
| Module-wise count rates for Quadrant B Data is divided into 100 sec bins |
 |
 |
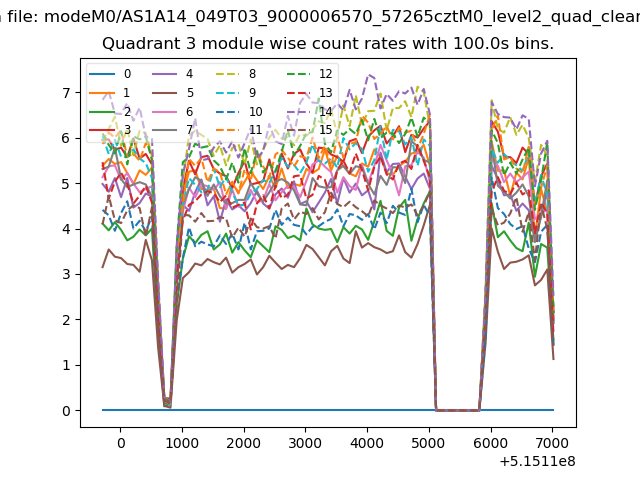
| Module-wise count rates for Quadrant C Data is divided into 100 sec bins |
 |
 |
| Module-wise count rates for Quadrant D Data is divided into 100 sec bins |
 |
 |
| Parameter | Plot |
|---|---|
| CZT HV Monitor |  |
| D_VDD | 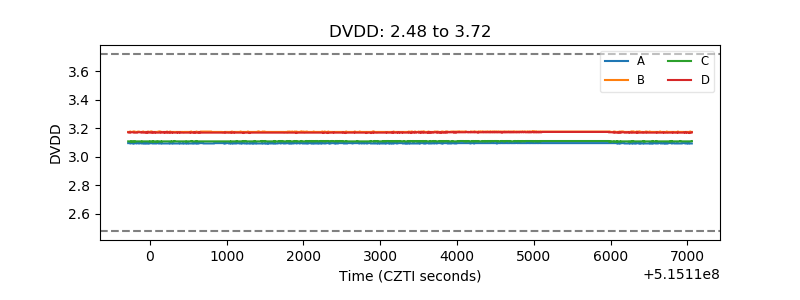 |
| Temperature 1 | 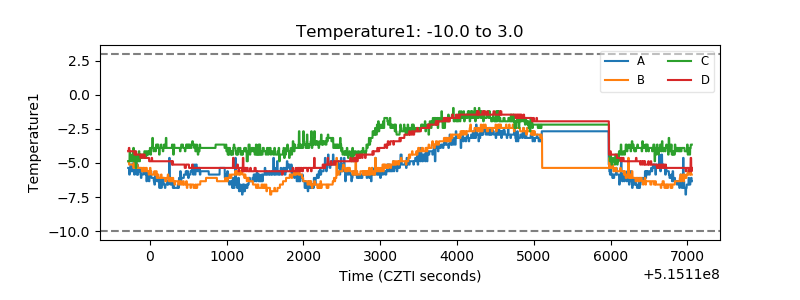 |
| Veto HV Monitor | 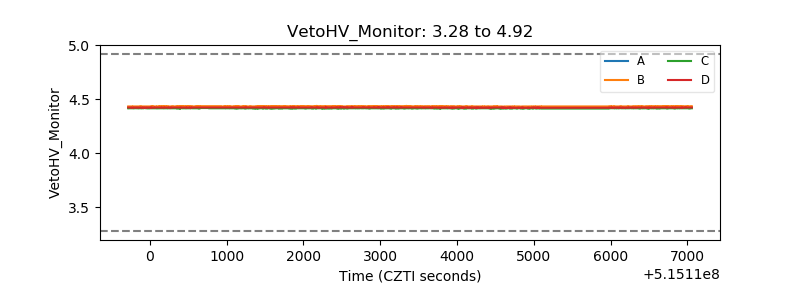 |
| Veto LLD | 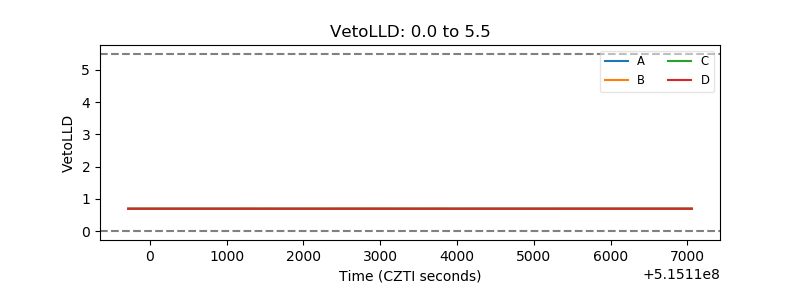 |
| Alpha Counter | 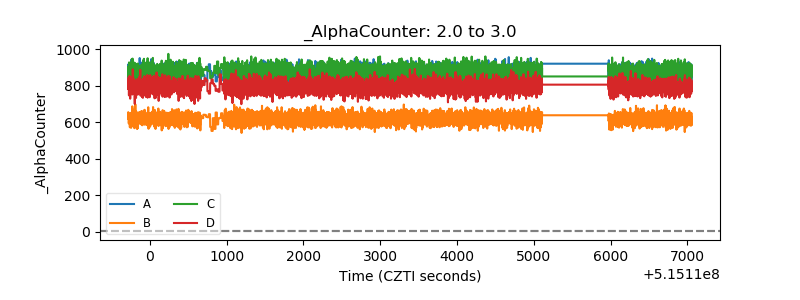 |
| _CPM_Rate | 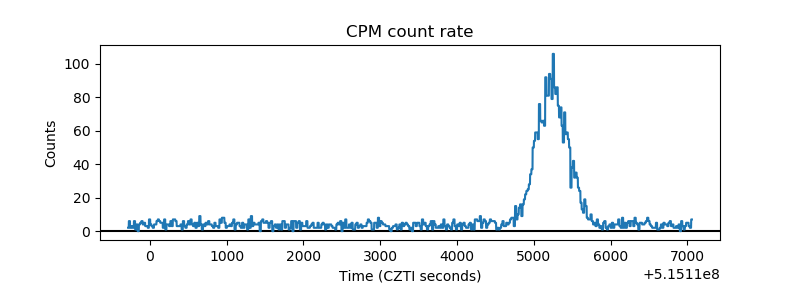 |
| CZT Counter | 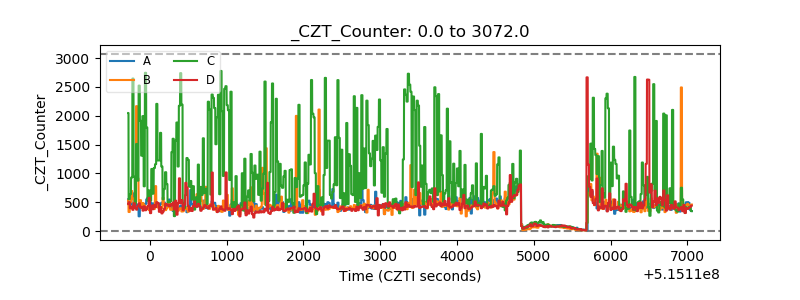 |
| +2.5 Volts monitor |  |
| +5 Volts monitor |  |
| _ROLL_ROT | 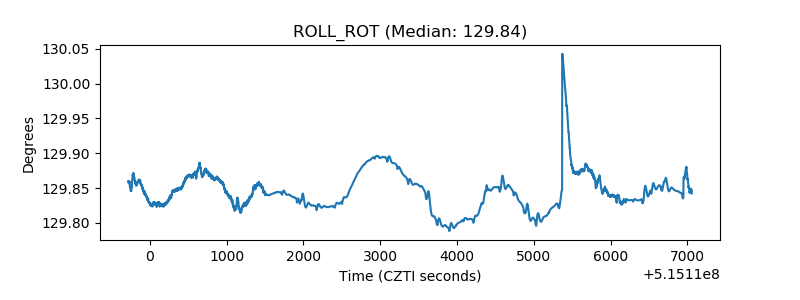 |
| _Roll_DEC | 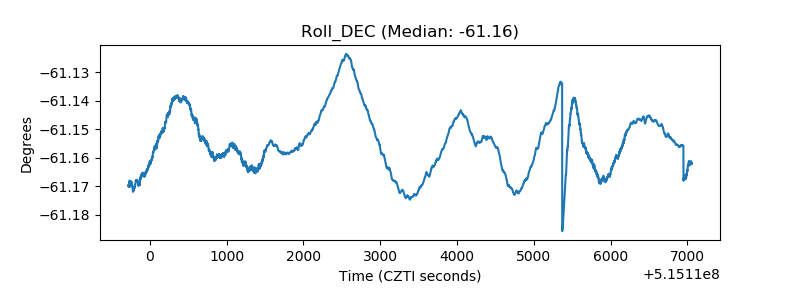 |
| _Roll_RA | 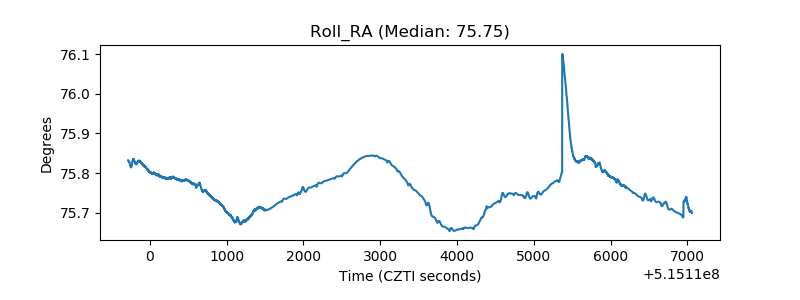 |
| Veto Counter | 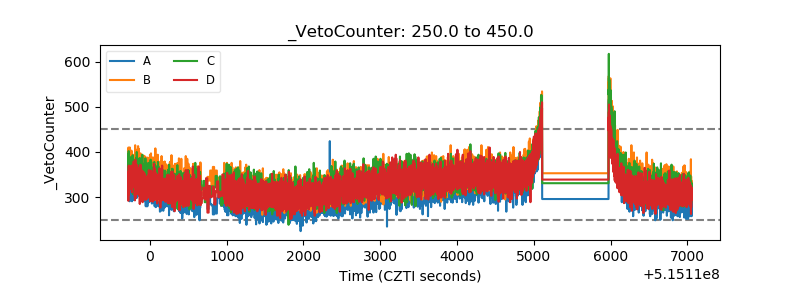 |