| Param | Original file | Final file |
|---|---|---|
| Filename | modeM0/AS1A14_049T03_9000006570_57266cztM0_level2.fits | modeM0/AS1A14_049T03_9000006570_57266cztM0_level2_quad_clean.evt |
| Size (bytes) | 519,563,520 | 91,929,600 |
| Size | 495.5 MB | 87.7 MB |
| Events in quadrant A | 3,607,434 | 589,487 |
| Events in quadrant B | 3,841,140 | 637,556 |
| Events in quadrant C | 6,971,551 | 522,487 |
| Events in quadrant D | 4,229,383 | 511,791 |
| Mode M0 | |||
|---|---|---|---|
| Quadrant | BADHDUFLAG | Total packets | Discarded packets |
| A | 0 | 15769 | 2 |
| B | 0 | 17104 | 2 |
| C | 0 | 26057 | 4 |
| D | 0 | 18166 | 2 |
| Mode M9 | |||
|---|---|---|---|
| Quadrant | BADHDUFLAG | Total packets | Discarded packets |
| A | 0 | 2 | 0 |
| B | 0 | 2 | 0 |
| C | 0 | 2 | 0 |
| D | 0 | 2 | 0 |
| Mode SS | |||
|---|---|---|---|
| Quadrant | BADHDUFLAG | Total packets | Discarded packets |
| A | 0 | 154 | 0 |
| B | 0 | 154 | 0 |
| C | 0 | 154 | 0 |
| D | 0 | 154 | 0 |
| Quadrant | Total seconds | Saturated seconds | Saturation percentage |
|---|---|---|---|
| A | 7500 | 140 | 1.866667% |
| B | 7500 | 265 | 3.533333% |
| C | 7499 | 1040 | 13.868516% |
| D | 7500 | 294 | 3.920000% |
Noise dominated data is calculated using 1-second bins in cleaned event files. If a bin has >2000 counts, and if more than 50% of those come from <1% of pixels, then it is considered to be noise-dominated and hence unusable.
| Quadrant | # 1 sec bins | Bins with >0 counts | Bins with >2000 counts | High rate bins dominated by noise | Noise dominated (total time) | Noise dominated (detector-on time) | Marked lightcurve |
|---|---|---|---|---|---|---|---|
| A | 7978 | 7787 | 5 | 5 | 0.06% | 0.06% | 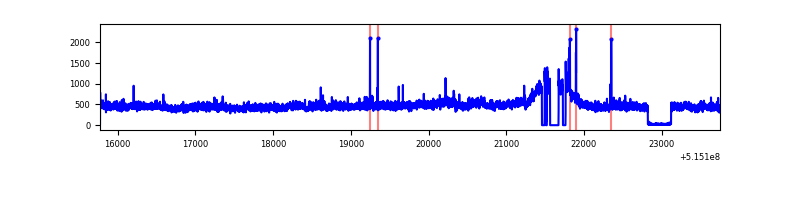 |
| B | 7978 | 7787 | 44 | 44 | 0.55% | 0.57% | 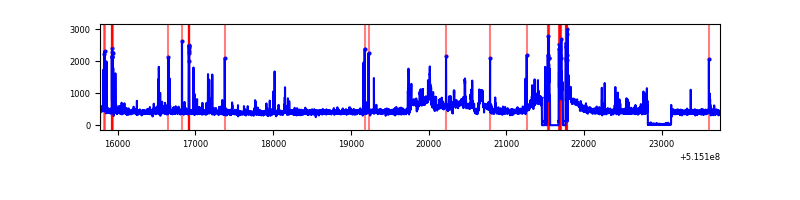 |
| C | 7977 | 7786 | 793 | 793 | 9.94% | 10.18% | 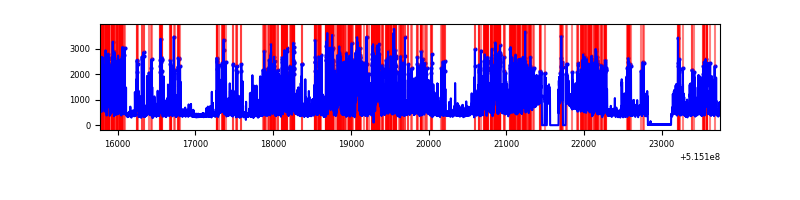 |
| D | 7978 | 7787 | 159 | 159 | 1.99% | 2.04% | 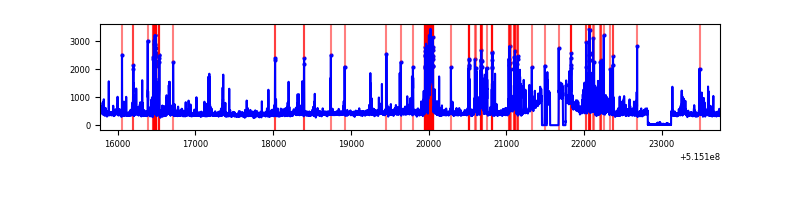 |
Top three noisy pixels from each quadrant. If the there are fewer than three noisy pixels in the level2.evt file, extra rows are filled as -1
| Pixel properties | Quadrant properties | ||||||
|---|---|---|---|---|---|---|---|
| Quadrant | DetID | PixID | Counts | Sigma | Mean | Median | Sigma |
| A | 8 | 4 | 388112 | 1947.29 | 810 | 789 | 198.9 |
| A | 3 | 14 | 19861 | 95.89 | 810 | 789 | 198.9 |
| A | 11 | 208 | 19546 | 94.3 | 810 | 789 | 198.9 |
| B | 5 | 172 | 309674 | 1833.24 | 791 | 761 | 168.5 |
| B | 10 | 16 | 116658 | 687.79 | 791 | 761 | 168.5 |
| B | 7 | 252 | 51618 | 301.81 | 791 | 761 | 168.5 |
| C | 15 | 224 | 3830584 | 18957.2 | 743 | 733 | 202.0 |
| C | 14 | 246 | 79219 | 388.49 | 743 | 733 | 202.0 |
| C | 14 | 254 | 60372 | 295.2 | 743 | 733 | 202.0 |
| D | 2 | 249 | 560539 | 2580.67 | 776 | 742 | 216.9 |
| D | 7 | 96 | 168053 | 771.31 | 776 | 742 | 216.9 |
| D | 8 | 240 | 111504 | 510.61 | 776 | 742 | 216.9 |
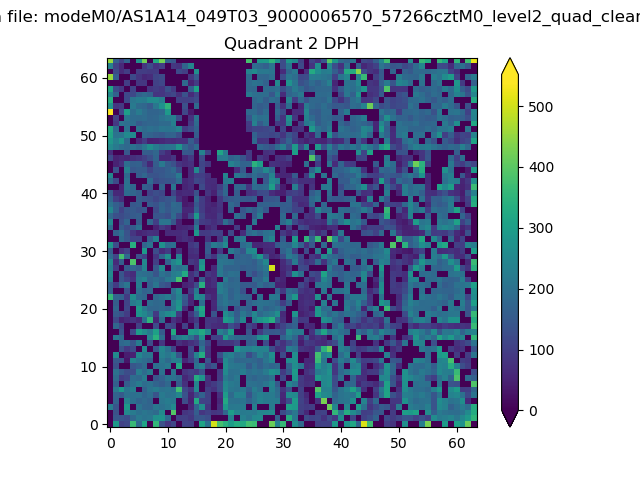
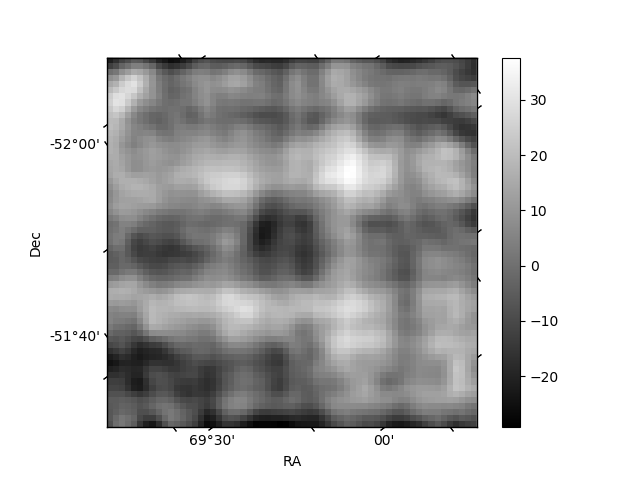
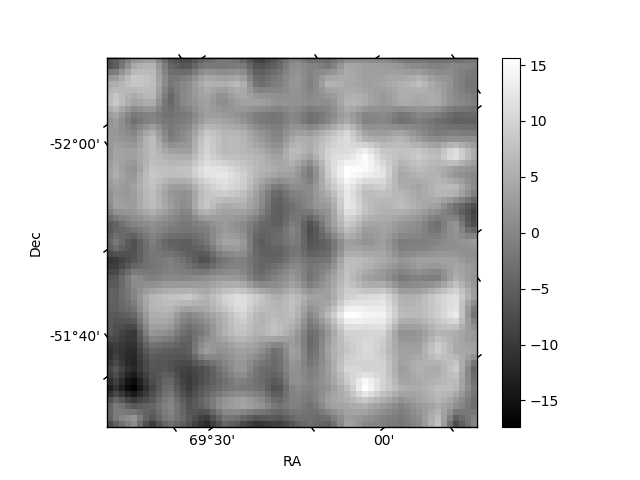
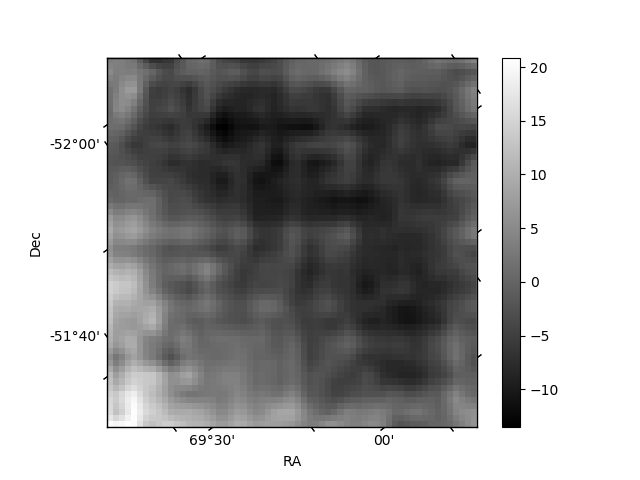
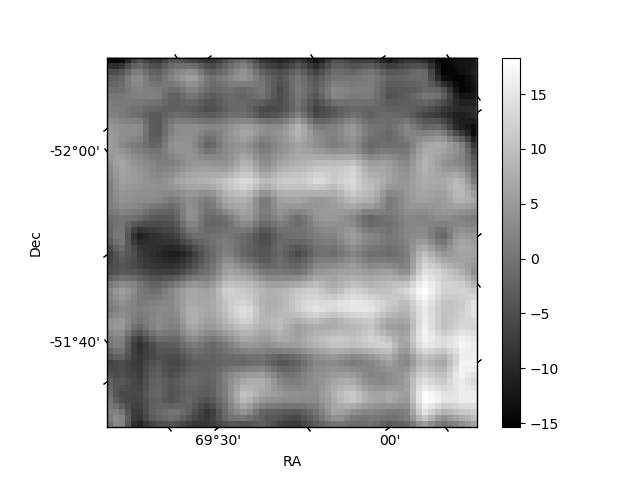
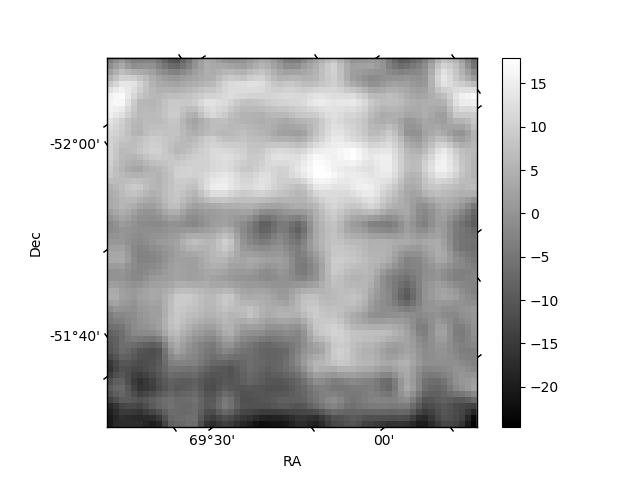
Histogram calculated using DETX and DETY for each event in the final _common_clean file
| Quadrant A | 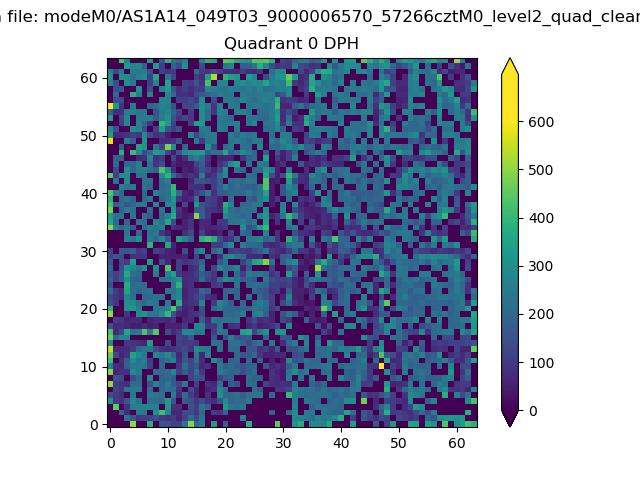 |
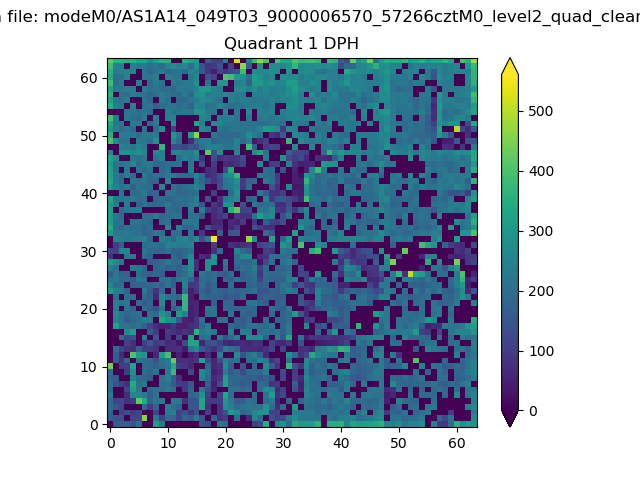 |
Quadrant B |
|---|---|---|---|
| Quadrant D | 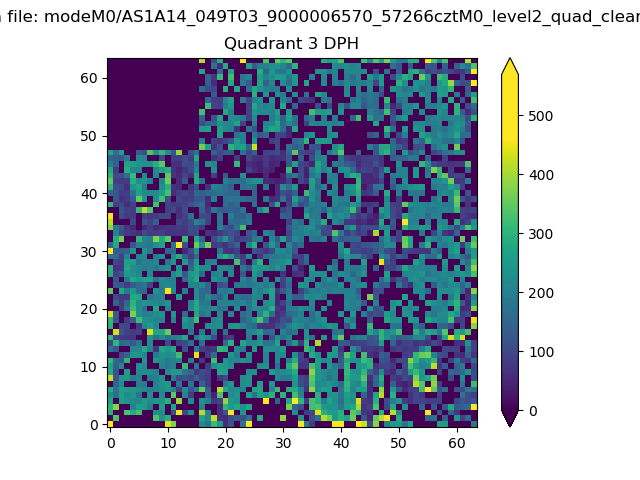 |
 |
Quadrant C |
| Plot type | Count rate plots | Images |
|---|---|---|
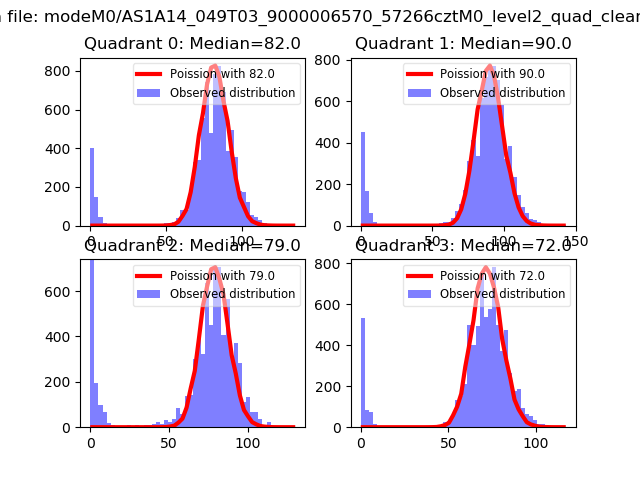
| Comparison with Poisson distribution Blue bars denote a histogram of data divided into 1 sec bins. Red curve is a Poisson curve with rate = median count rate of data. |
 |
 |
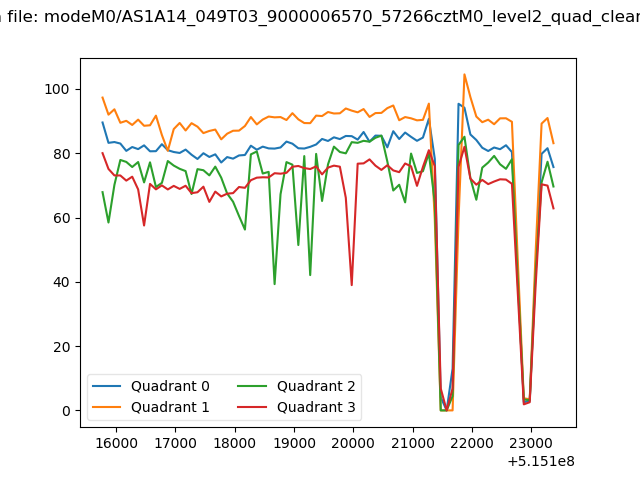
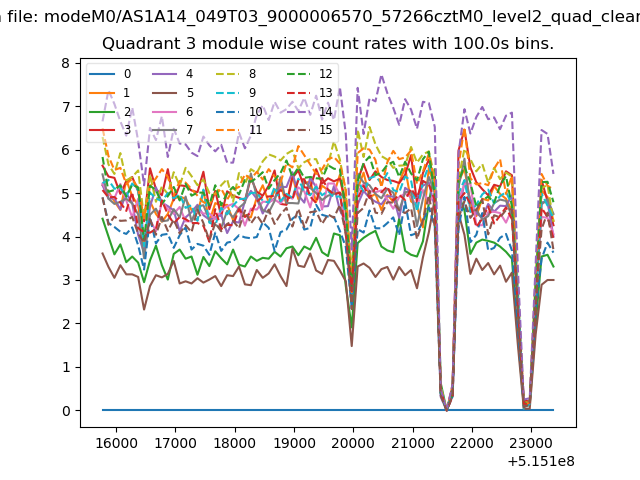
| Quadrant-wise count rates Data is divided into 100 sec bins |
 |
|
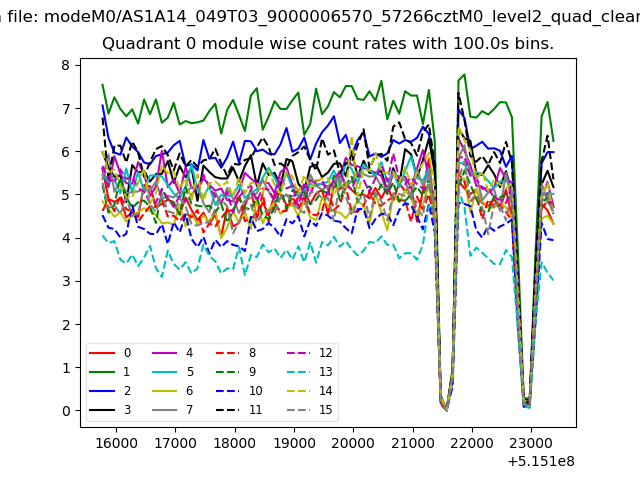
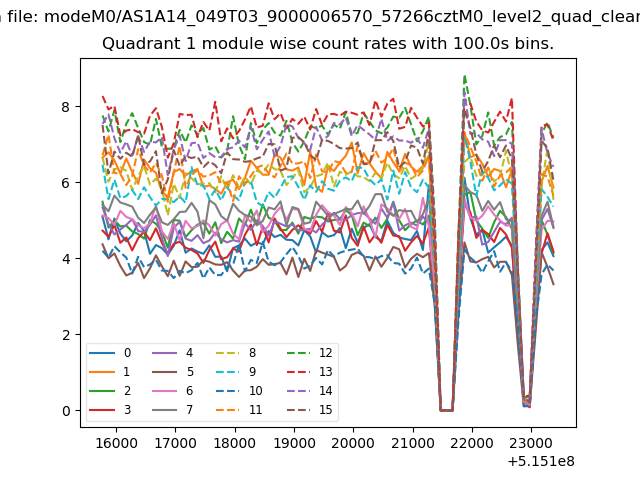
| Module-wise count rates for Quadrant A Data is divided into 100 sec bins |
 |
 |
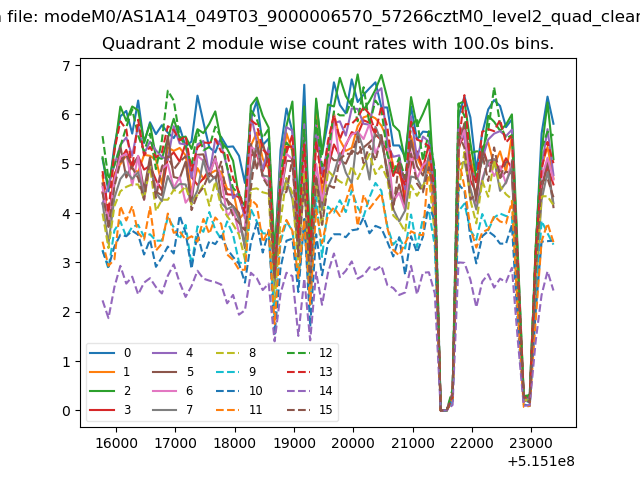
| Module-wise count rates for Quadrant B Data is divided into 100 sec bins |
 |
 |
| Module-wise count rates for Quadrant C Data is divided into 100 sec bins |
 |
 |
| Module-wise count rates for Quadrant D Data is divided into 100 sec bins |
 |
 |
| Parameter | Plot |
|---|---|
| CZT HV Monitor | 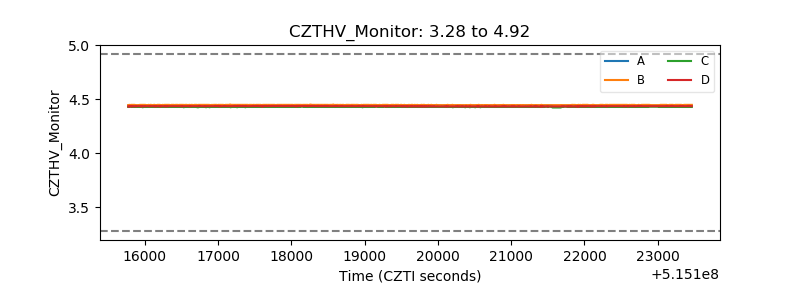 |
| D_VDD | 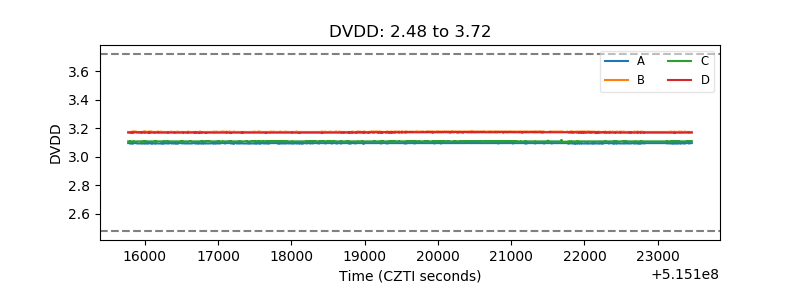 |
| Temperature 1 | 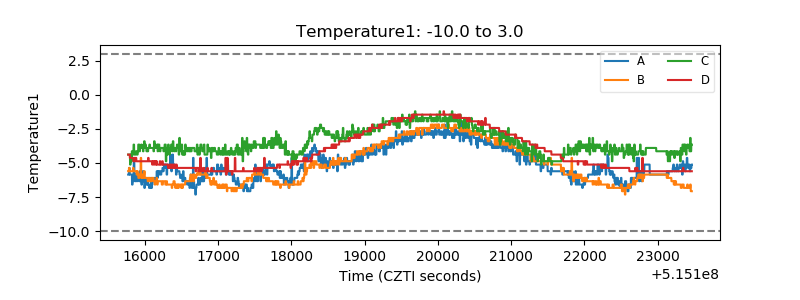 |
| Veto HV Monitor | 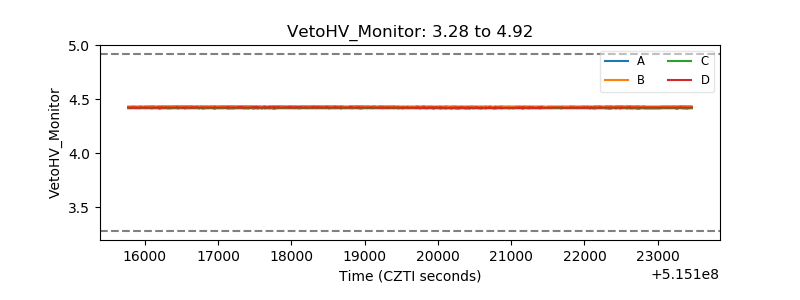 |
| Veto LLD | 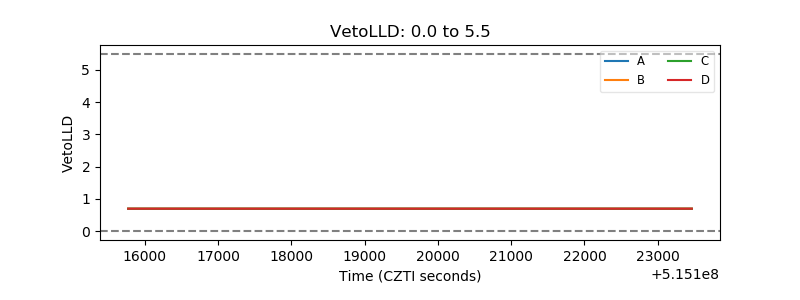 |
| Alpha Counter | 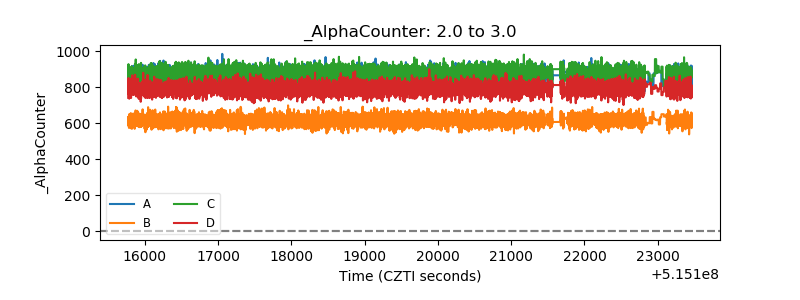 |
| _CPM_Rate | 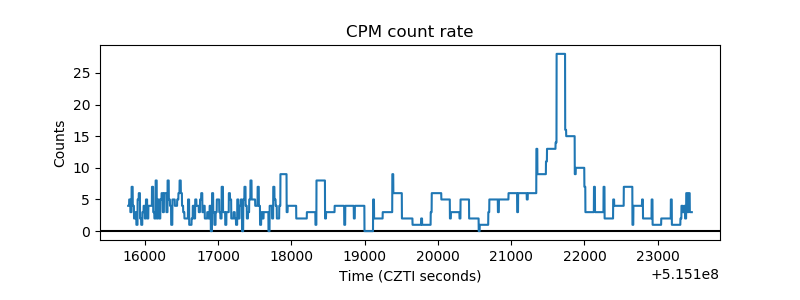 |
| CZT Counter | 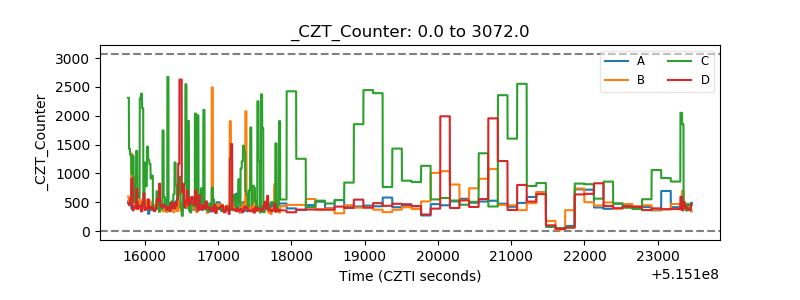 |
| +2.5 Volts monitor |  |
| +5 Volts monitor |  |
| _ROLL_ROT | 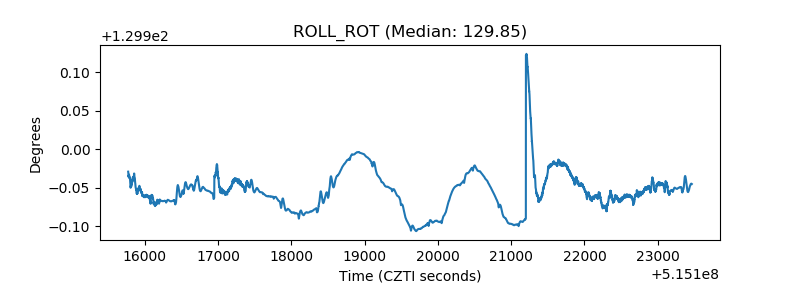 |
| _Roll_DEC | 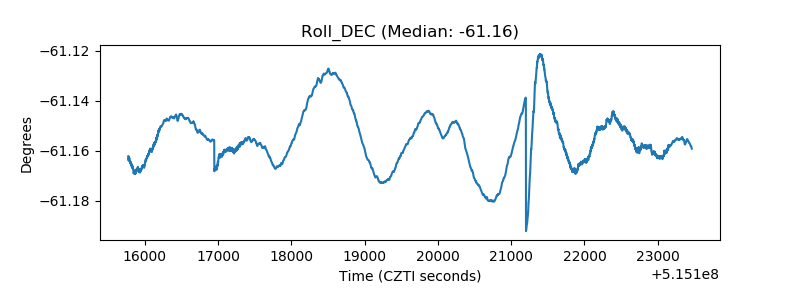 |
| _Roll_RA | 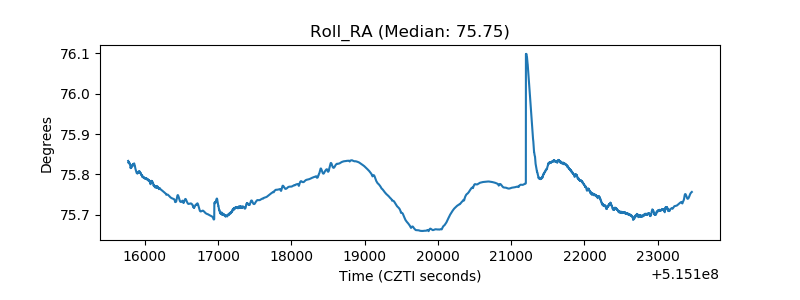 |
| Veto Counter | 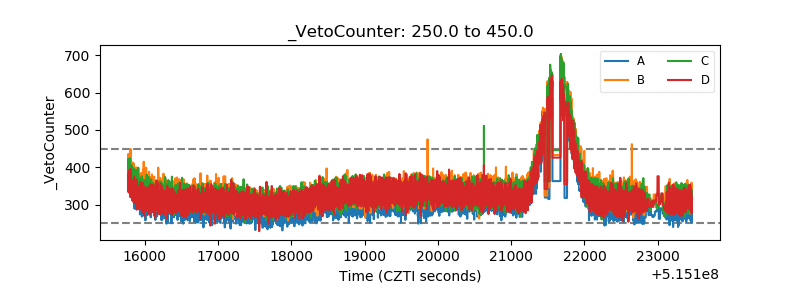 |