| Param | Original file | Final file |
|---|---|---|
| Filename | modeM0/AS1A14_049T03_9000006570_57268cztM0_level2.fits | modeM0/AS1A14_049T03_9000006570_57268cztM0_level2_quad_clean.evt |
| Size (bytes) | 514,437,120 | 110,623,680 |
| Size | 490.6 MB | 105.5 MB |
| Events in quadrant A | 3,778,815 | 733,288 |
| Events in quadrant B | 3,998,459 | 778,093 |
| Events in quadrant C | 6,763,564 | 645,728 |
| Events in quadrant D | 3,892,668 | 646,860 |
| Mode M0 | |||
|---|---|---|---|
| Quadrant | BADHDUFLAG | Total packets | Discarded packets |
| A | 0 | 16700 | 0 |
| B | 0 | 17647 | 0 |
| C | 0 | 25561 | 0 |
| D | 0 | 17385 | 0 |
| Mode SS | |||
|---|---|---|---|
| Quadrant | BADHDUFLAG | Total packets | Discarded packets |
| A | 0 | 158 | 0 |
| B | 0 | 158 | 0 |
| C | 0 | 158 | 0 |
| D | 0 | 158 | 0 |
| Quadrant | Total seconds | Saturated seconds | Saturation percentage |
|---|---|---|---|
| A | 7843 | 22 | 0.280505% |
| B | 7844 | 162 | 2.065273% |
| C | 7844 | 752 | 9.586945% |
| D | 7844 | 101 | 1.287608% |
Noise dominated data is calculated using 1-second bins in cleaned event files. If a bin has >2000 counts, and if more than 50% of those come from <1% of pixels, then it is considered to be noise-dominated and hence unusable.
| Quadrant | # 1 sec bins | Bins with >0 counts | Bins with >2000 counts | High rate bins dominated by noise | Noise dominated (total time) | Noise dominated (detector-on time) | Marked lightcurve |
|---|---|---|---|---|---|---|---|
| A | 7843 | 7843 | 12 | 12 | 0.15% | 0.15% | 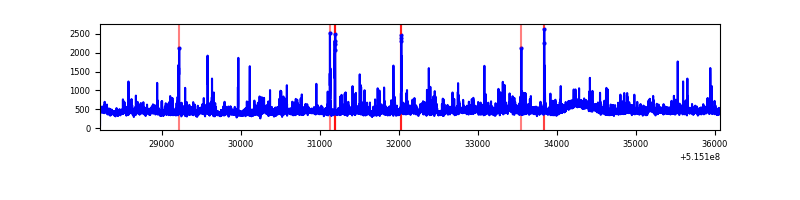 |
| B | 7844 | 7844 | 83 | 83 | 1.06% | 1.06% | 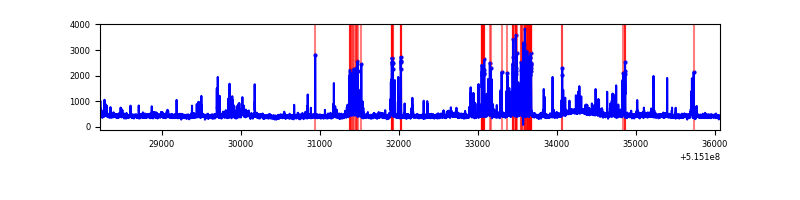 |
| C | 7844 | 7844 | 611 | 611 | 7.79% | 7.79% | 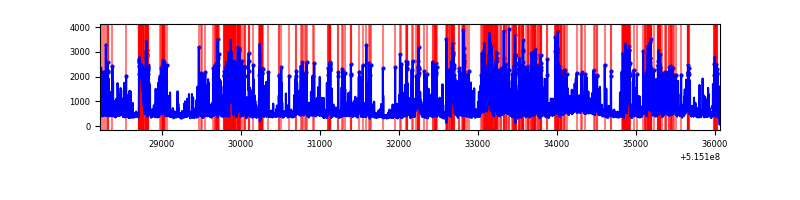 |
| D | 7844 | 7844 | 93 | 93 | 1.19% | 1.19% | 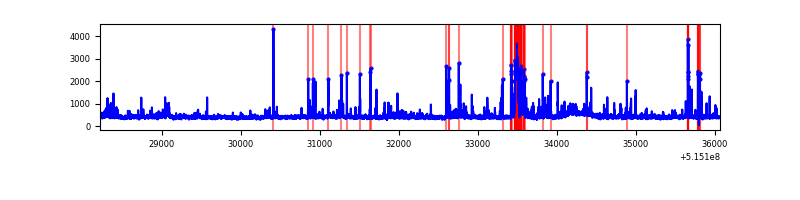 |
Top three noisy pixels from each quadrant. If the there are fewer than three noisy pixels in the level2.evt file, extra rows are filled as -1
| Pixel properties | Quadrant properties | ||||||
|---|---|---|---|---|---|---|---|
| Quadrant | DetID | PixID | Counts | Sigma | Mean | Median | Sigma |
| A | 8 | 4 | 463144 | 2263.7 | 824 | 804 | 204.2 |
| A | 3 | 14 | 53745 | 259.21 | 824 | 804 | 204.2 |
| A | 7 | 64 | 46399 | 223.24 | 824 | 804 | 204.2 |
| B | 5 | 185 | 320543 | 1848.9 | 814 | 783 | 172.9 |
| B | 10 | 247 | 131185 | 754.01 | 814 | 783 | 172.9 |
| B | 8 | 234 | 80622 | 461.64 | 814 | 783 | 172.9 |
| C | 15 | 224 | 3500727 | 16557.76 | 778 | 770 | 211.4 |
| C | 14 | 67 | 94733 | 444.52 | 778 | 770 | 211.4 |
| C | 14 | 254 | 24408 | 111.83 | 778 | 770 | 211.4 |
| D | 3 | 12 | 265693 | 1191.69 | 794 | 758 | 222.3 |
| D | 7 | 96 | 198243 | 888.3 | 794 | 758 | 222.3 |
| D | 5 | 173 | 71395 | 317.73 | 794 | 758 | 222.3 |
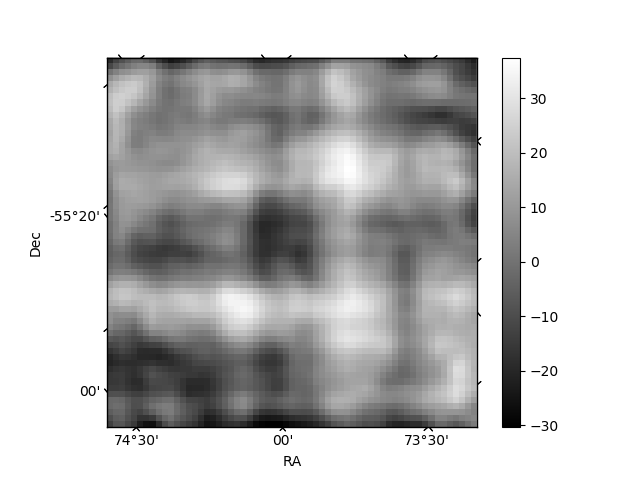
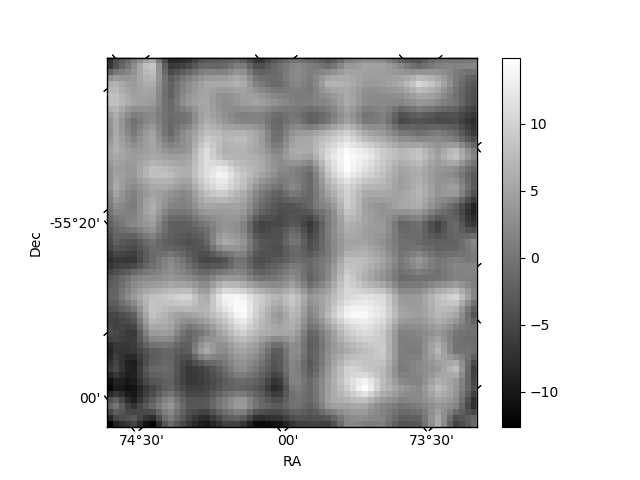
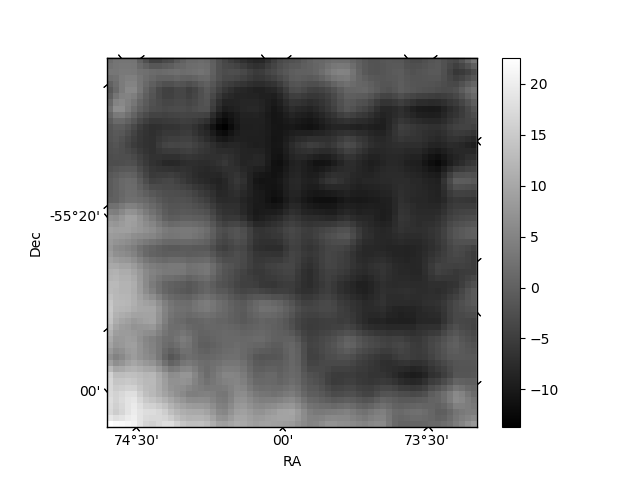
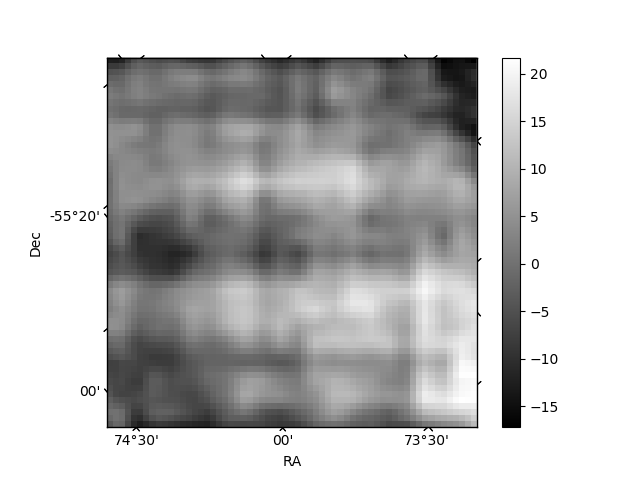
Histogram calculated using DETX and DETY for each event in the final _common_clean file
| Quadrant A | 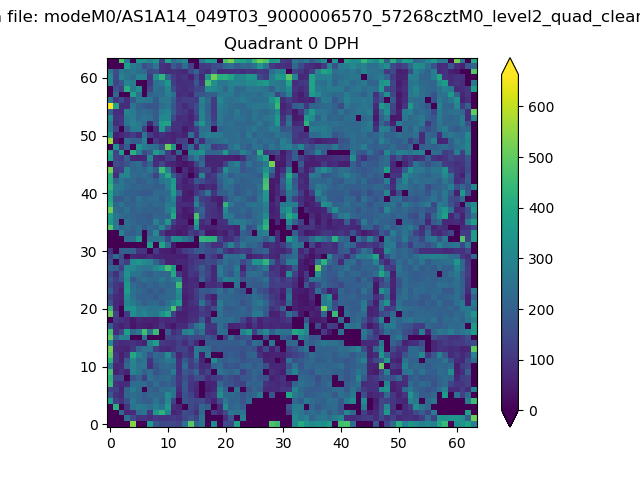 |
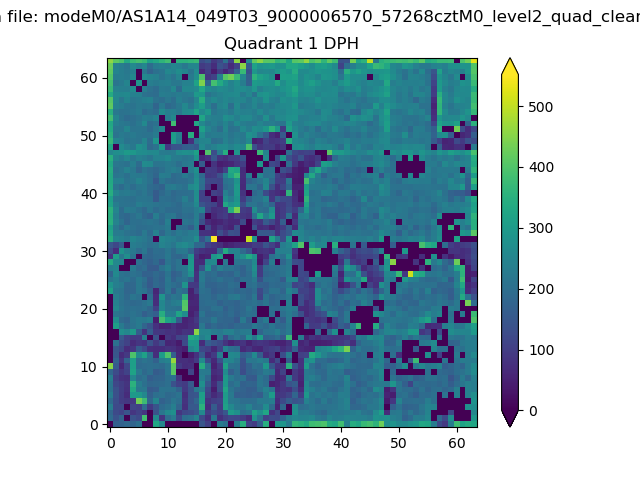 |
Quadrant B |
|---|---|---|---|
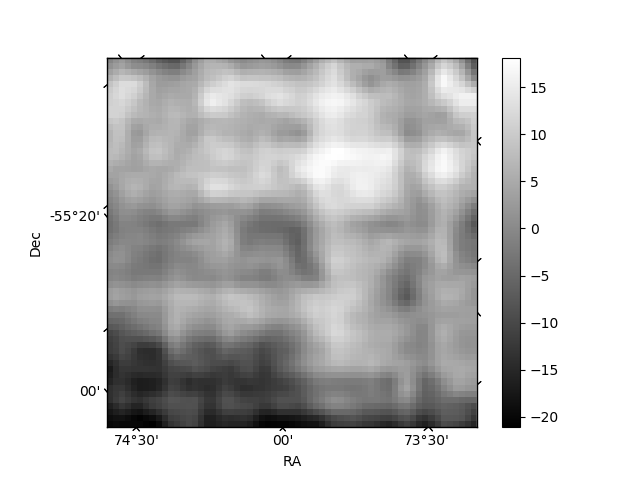
| Quadrant D | 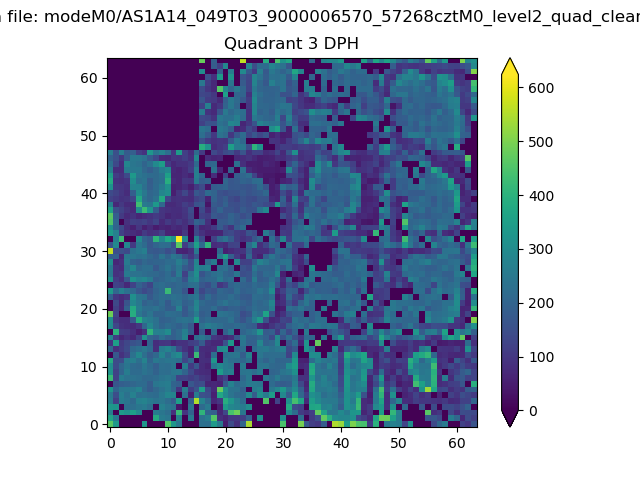 |
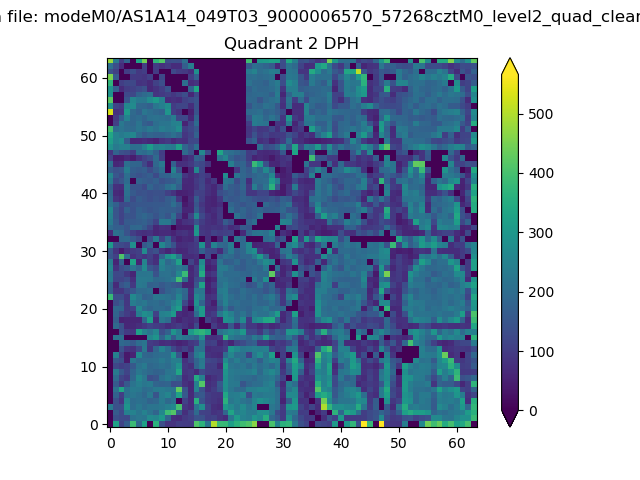 |
Quadrant C |
| Plot type | Count rate plots | Images |
|---|---|---|
| Comparison with Poisson distribution Blue bars denote a histogram of data divided into 1 sec bins. Red curve is a Poisson curve with rate = median count rate of data. |
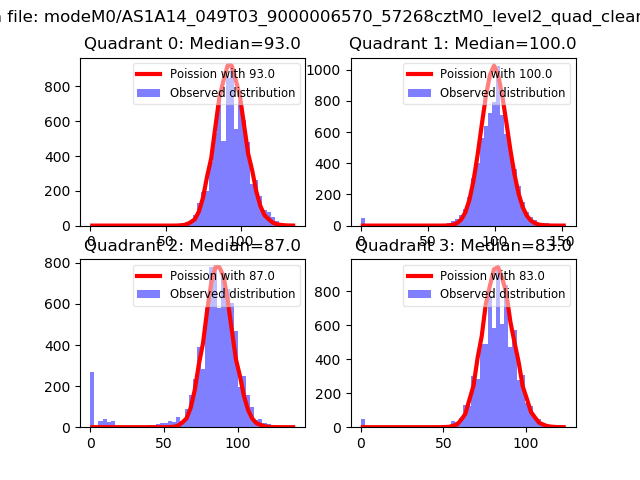 |
 |
| Quadrant-wise count rates Data is divided into 100 sec bins |
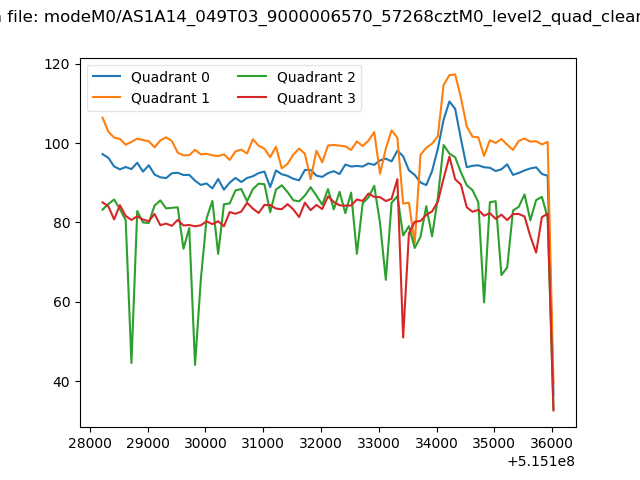 |
|
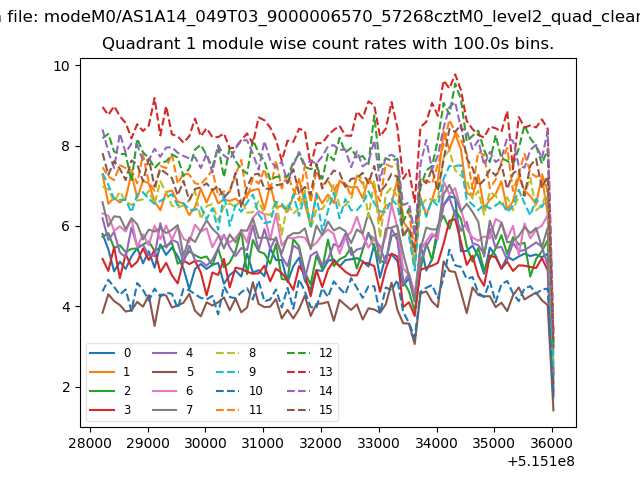
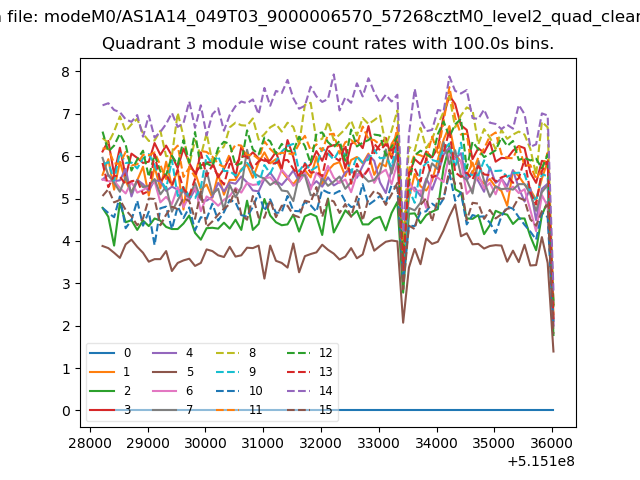
| Module-wise count rates for Quadrant A Data is divided into 100 sec bins |
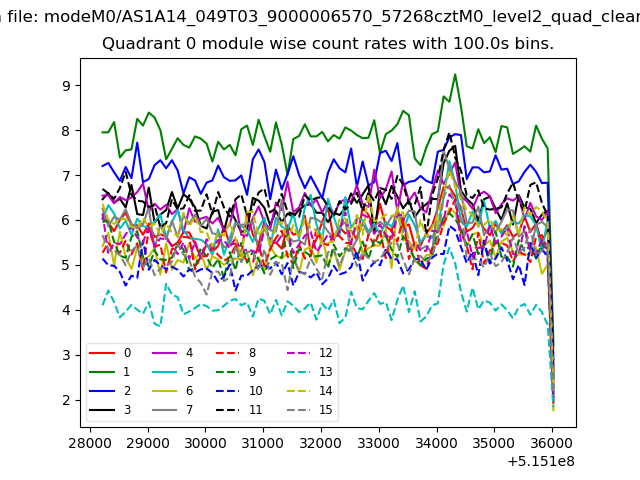 |
 |
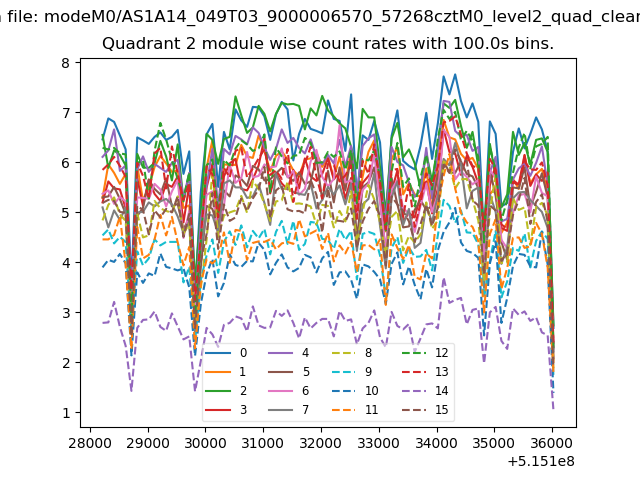
| Module-wise count rates for Quadrant B Data is divided into 100 sec bins |
 |
 |
| Module-wise count rates for Quadrant C Data is divided into 100 sec bins |
 |
 |
| Module-wise count rates for Quadrant D Data is divided into 100 sec bins |
 |
 |
| Parameter | Plot |
|---|---|
| CZT HV Monitor | 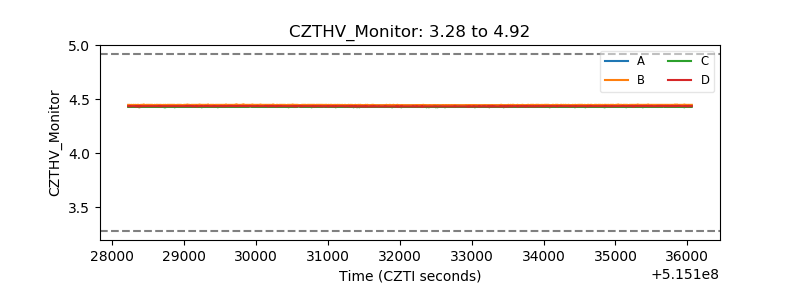 |
| D_VDD | 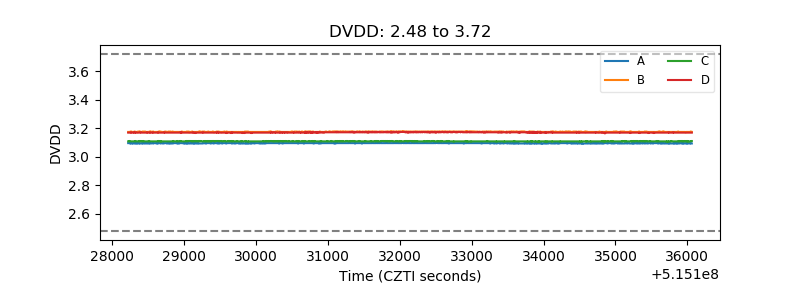 |
| Temperature 1 | 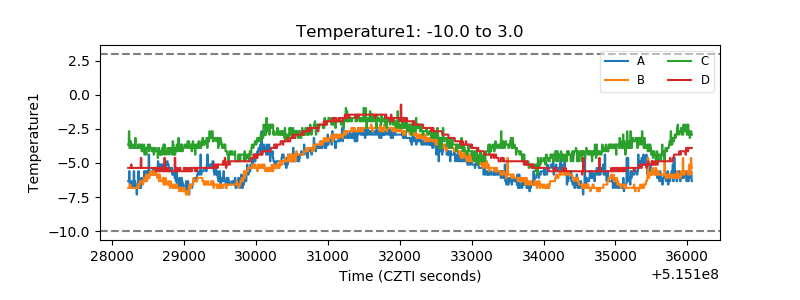 |
| Veto HV Monitor | 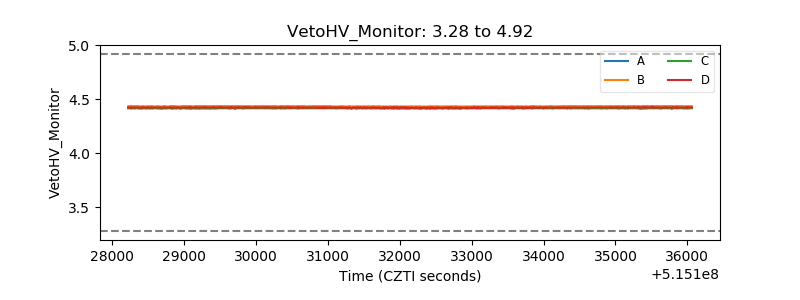 |
| Veto LLD | 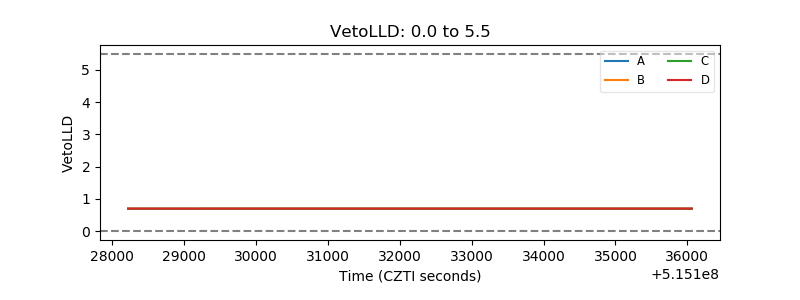 |
| Alpha Counter | 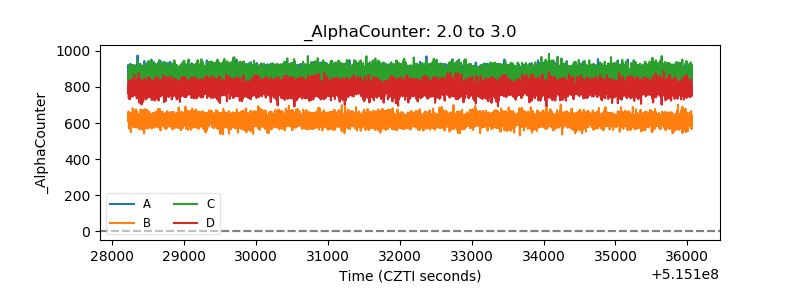 |
| _CPM_Rate | 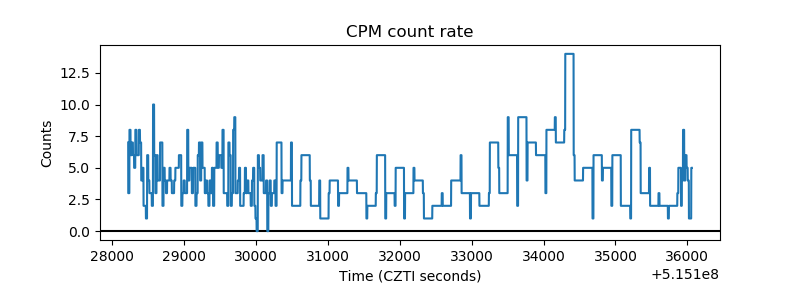 |
| CZT Counter | 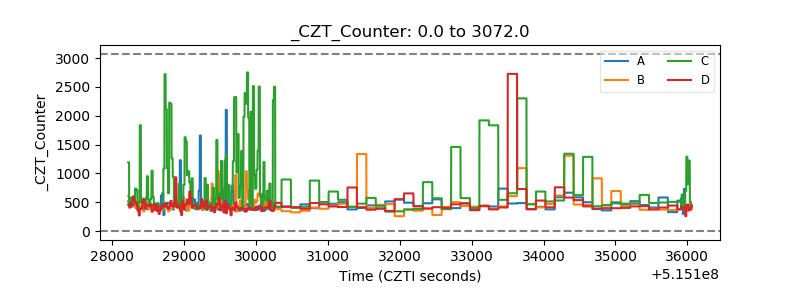 |
| +2.5 Volts monitor |  |
| +5 Volts monitor |  |
| _ROLL_ROT | 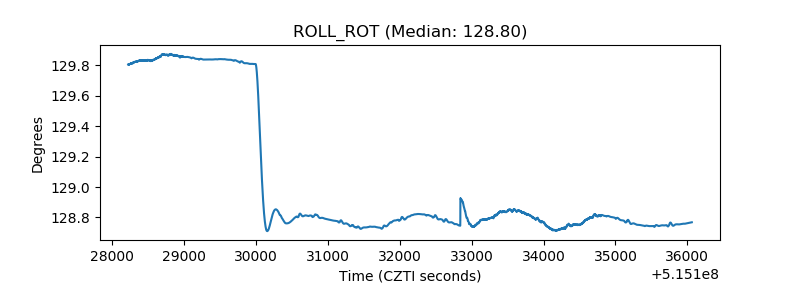 |
| _Roll_DEC | 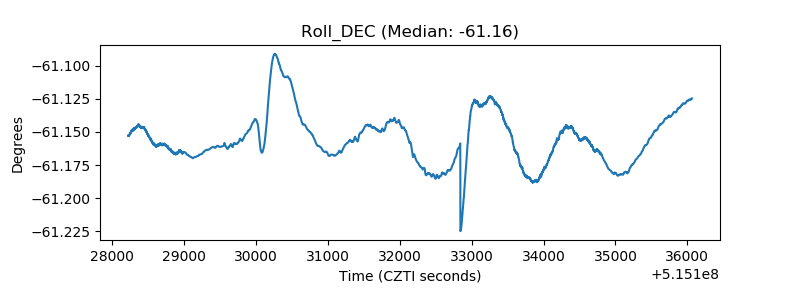 |
| _Roll_RA | 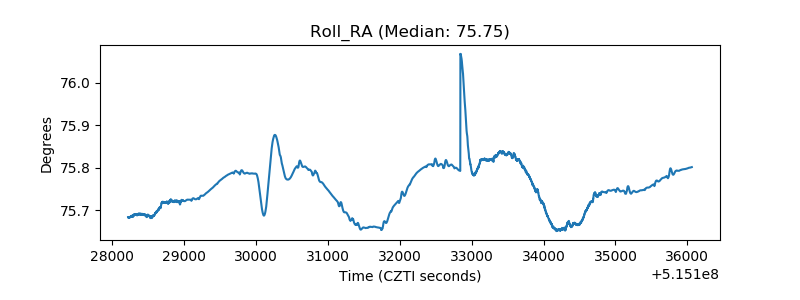 |
| Veto Counter | 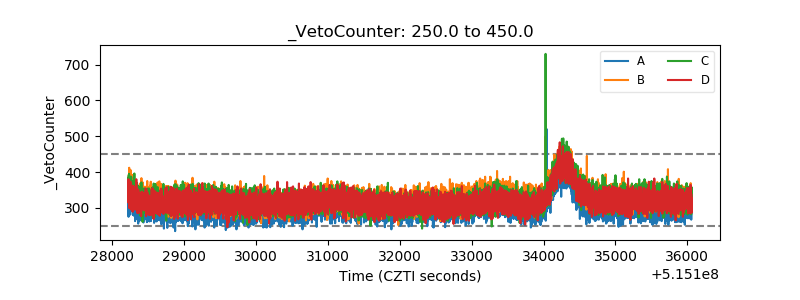 |