| Param | Original file | Final file |
|---|---|---|
| Filename | modeM0/AS1A14_049T03_9000006570_57271cztM0_level2.fits | modeM0/AS1A14_049T03_9000006570_57271cztM0_level2_quad_clean.evt |
| Size (bytes) | 1,281,404,160 | 217,310,400 |
| Size | 1.2 GB | 207.2 MB |
| Events in quadrant A | 12,174,225 | 1,352,890 |
| Events in quadrant B | 8,992,710 | 1,430,168 |
| Events in quadrant C | 15,111,876 | 1,275,940 |
| Events in quadrant D | 9,709,556 | 1,233,384 |
| Mode M0 | |||
|---|---|---|---|
| Quadrant | BADHDUFLAG | Total packets | Discarded packets |
| A | 0 | 48829 | 3 |
| B | 0 | 40415 | 2 |
| C | 0 | 58011 | 2 |
| D | 0 | 42453 | 3 |
| Mode M9 | |||
|---|---|---|---|
| Quadrant | BADHDUFLAG | Total packets | Discarded packets |
| A | 0 | 10 | 0 |
| B | 0 | 10 | 0 |
| C | 0 | 10 | 0 |
| D | 0 | 10 | 0 |
| Mode SS | |||
|---|---|---|---|
| Quadrant | BADHDUFLAG | Total packets | Discarded packets |
| A | 0 | 376 | 0 |
| B | 0 | 376 | 0 |
| C | 0 | 376 | 0 |
| D | 0 | 376 | 0 |
| Quadrant | Total seconds | Saturated seconds | Saturation percentage |
|---|---|---|---|
| A | 18666 | 975 | 5.223401% |
| B | 18666 | 556 | 2.978678% |
| C | 18667 | 1622 | 8.689131% |
| D | 18666 | 470 | 2.517947% |
Noise dominated data is calculated using 1-second bins in cleaned event files. If a bin has >2000 counts, and if more than 50% of those come from <1% of pixels, then it is considered to be noise-dominated and hence unusable.
| Quadrant | # 1 sec bins | Bins with >0 counts | Bins with >2000 counts | High rate bins dominated by noise | Noise dominated (total time) | Noise dominated (detector-on time) | Marked lightcurve |
|---|---|---|---|---|---|---|---|
| A | 19962 | 18717 | 565 | 565 | 2.83% | 3.02% | 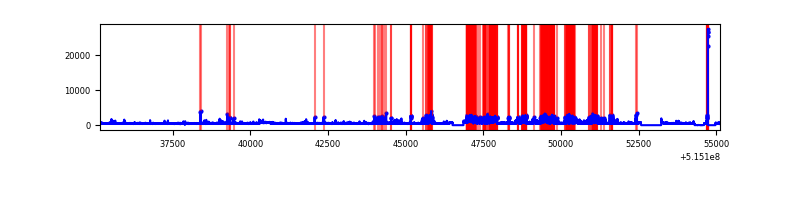 |
| B | 19962 | 18717 | 88 | 88 | 0.44% | 0.47% | 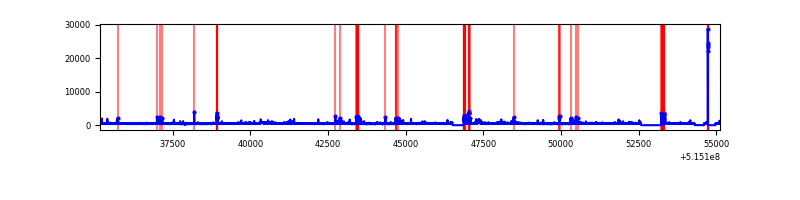 |
| C | 19963 | 18718 | 1180 | 1180 | 5.91% | 6.30% | 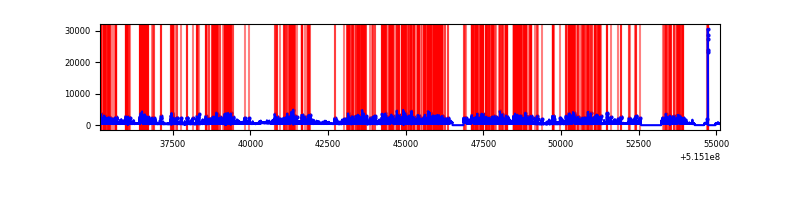 |
| D | 19963 | 18718 | 225 | 225 | 1.13% | 1.20% | 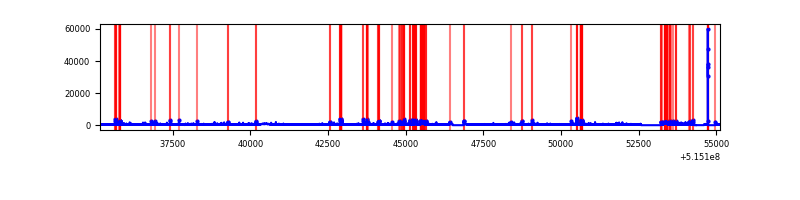 |
Top three noisy pixels from each quadrant. If the there are fewer than three noisy pixels in the level2.evt file, extra rows are filled as -1
| Pixel properties | Quadrant properties | ||||||
|---|---|---|---|---|---|---|---|
| Quadrant | DetID | PixID | Counts | Sigma | Mean | Median | Sigma |
| A | 10 | 251 | 3204478 | 6560.23 | 1985 | 1934 | 488.2 |
| A | 8 | 4 | 825688 | 1687.41 | 1985 | 1934 | 488.2 |
| A | 3 | 95 | 241900 | 491.56 | 1985 | 1934 | 488.2 |
| B | 10 | 16 | 477196 | 1131.8 | 1960 | 1889 | 420.0 |
| B | 5 | 185 | 197731 | 466.34 | 1960 | 1889 | 420.0 |
| B | 0 | 199 | 112087 | 262.4 | 1960 | 1889 | 420.0 |
| C | 15 | 224 | 6611974 | 12912.45 | 1893 | 1872 | 511.9 |
| C | 14 | 254 | 299055 | 580.53 | 1893 | 1872 | 511.9 |
| C | 14 | 67 | 252299 | 489.19 | 1893 | 1872 | 511.9 |
| D | 2 | 249 | 624205 | 1159.25 | 1936 | 1852 | 536.9 |
| D | 8 | 160 | 296449 | 548.74 | 1936 | 1852 | 536.9 |
| D | 8 | 240 | 248080 | 458.65 | 1936 | 1852 | 536.9 |
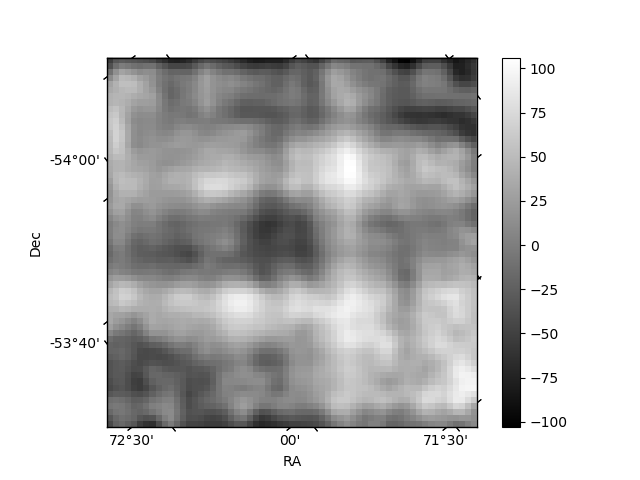
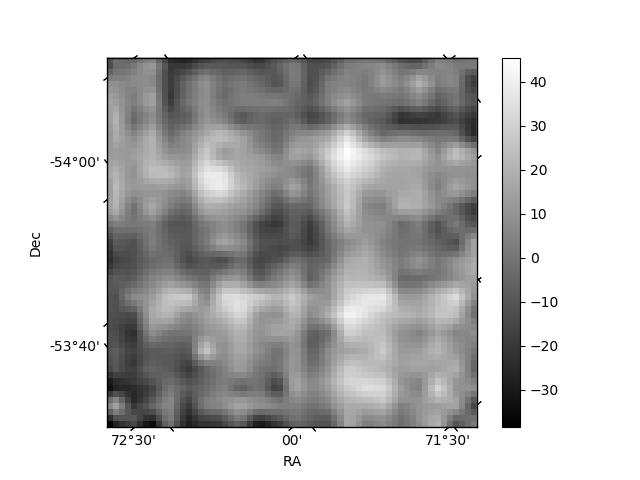
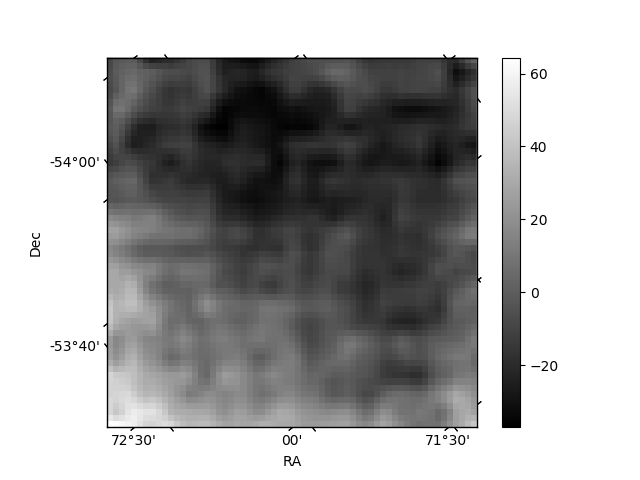
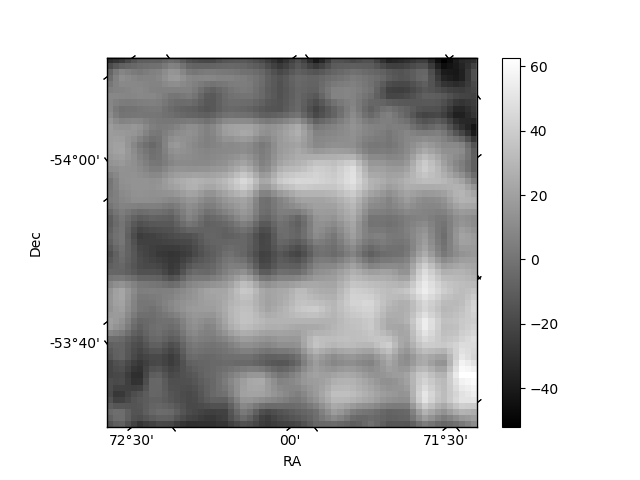
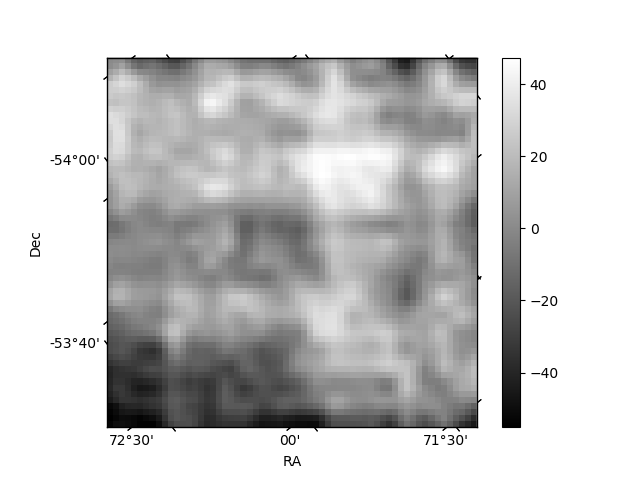
Histogram calculated using DETX and DETY for each event in the final _common_clean file
| Quadrant A | 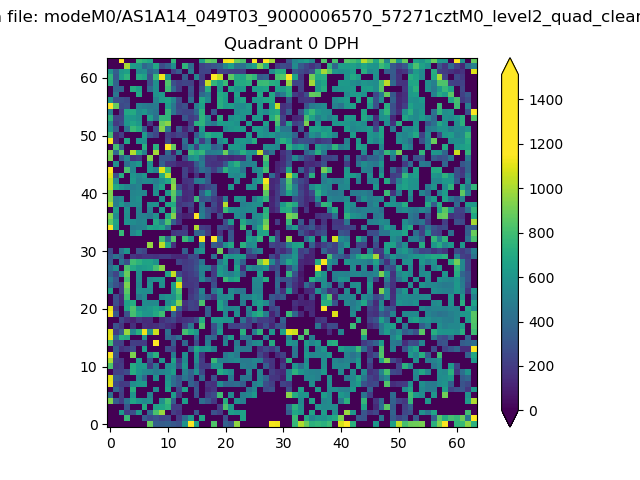 |
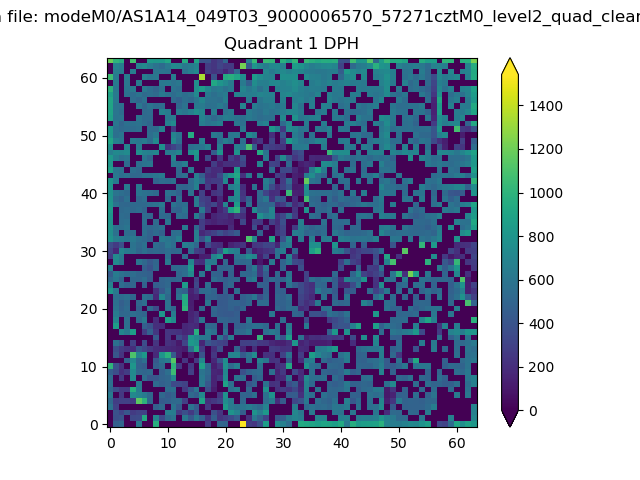 |
Quadrant B |
|---|---|---|---|
| Quadrant D | 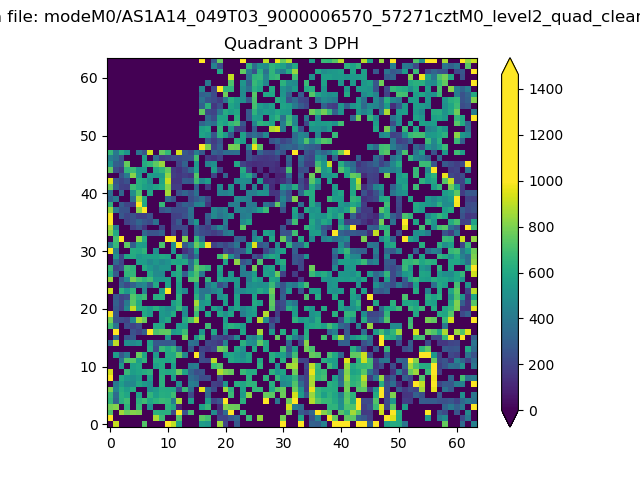 |
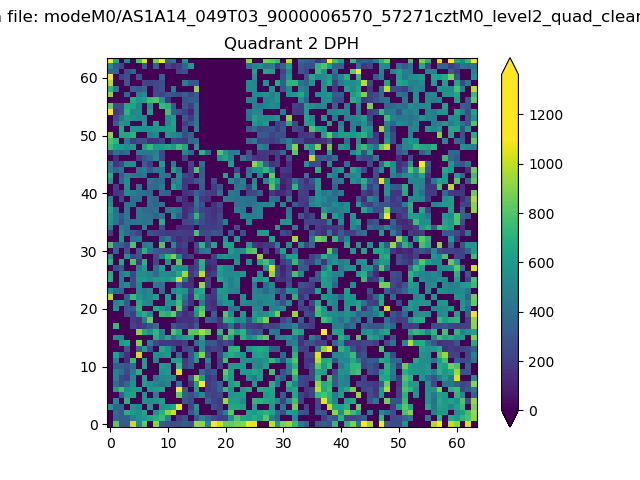 |
Quadrant C |
| Plot type | Count rate plots | Images |
|---|---|---|
| Comparison with Poisson distribution Blue bars denote a histogram of data divided into 1 sec bins. Red curve is a Poisson curve with rate = median count rate of data. |
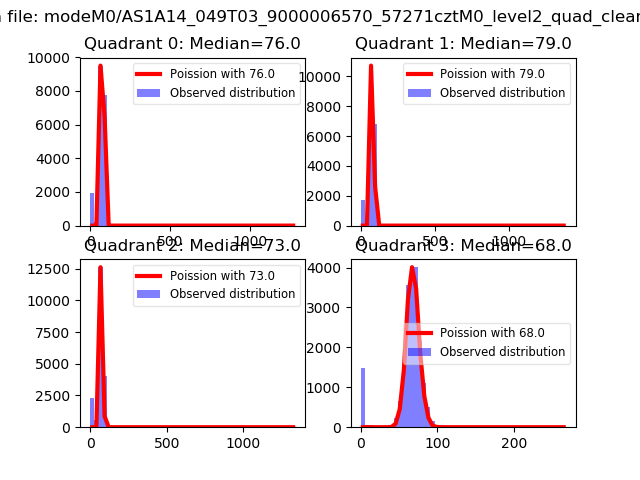 |
 |
| Quadrant-wise count rates Data is divided into 100 sec bins |
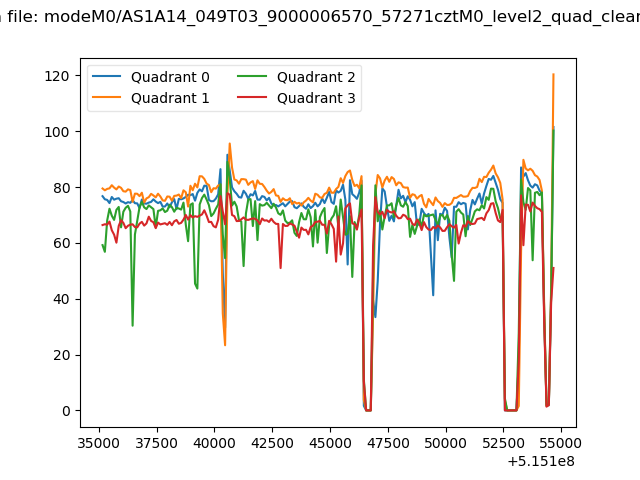 |
|
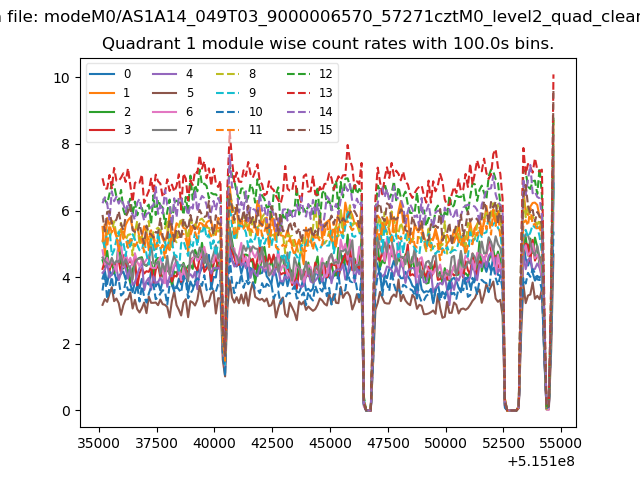
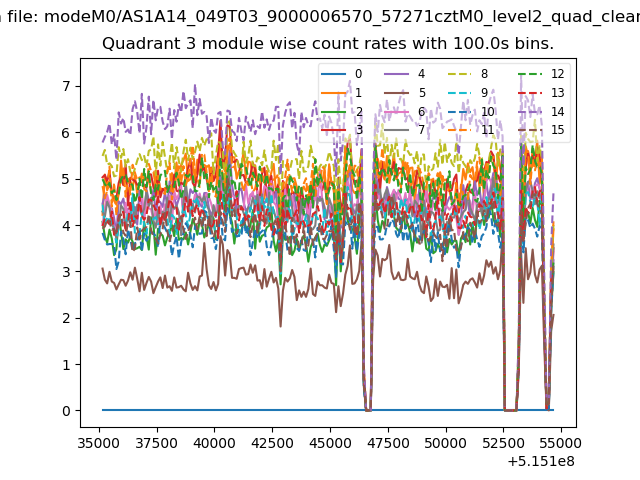
| Module-wise count rates for Quadrant A Data is divided into 100 sec bins |
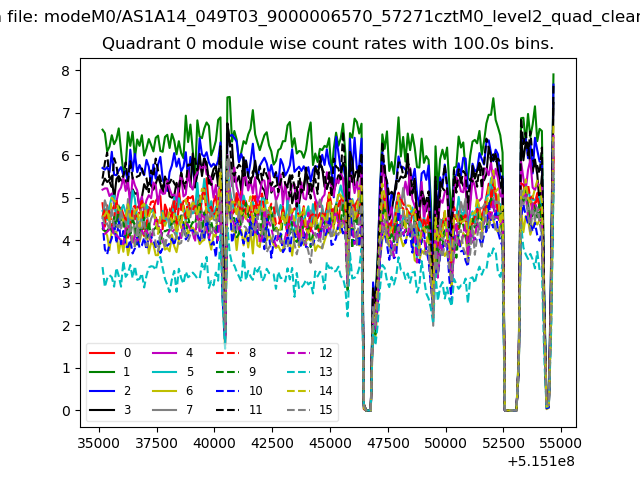 |
 |
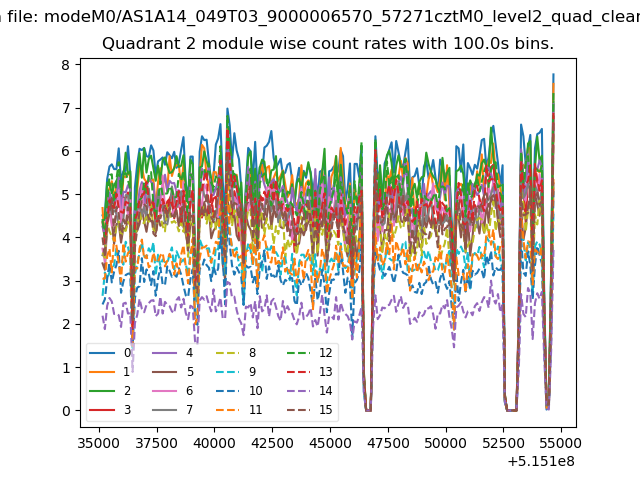
| Module-wise count rates for Quadrant B Data is divided into 100 sec bins |
 |
 |
| Module-wise count rates for Quadrant C Data is divided into 100 sec bins |
 |
 |
| Module-wise count rates for Quadrant D Data is divided into 100 sec bins |
 |
 |
| Parameter | Plot |
|---|---|
| CZT HV Monitor | 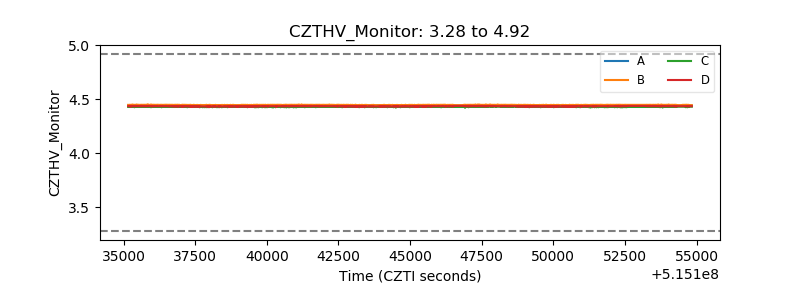 |
| D_VDD | 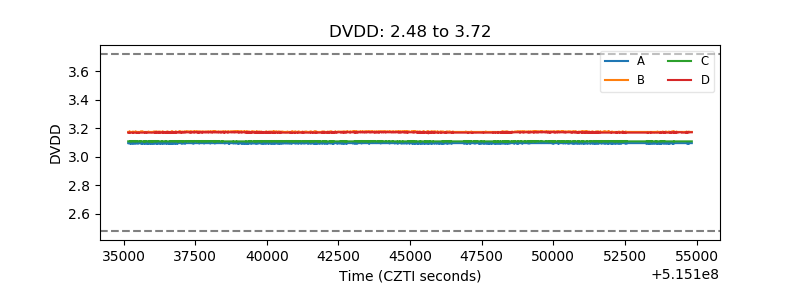 |
| Temperature 1 | 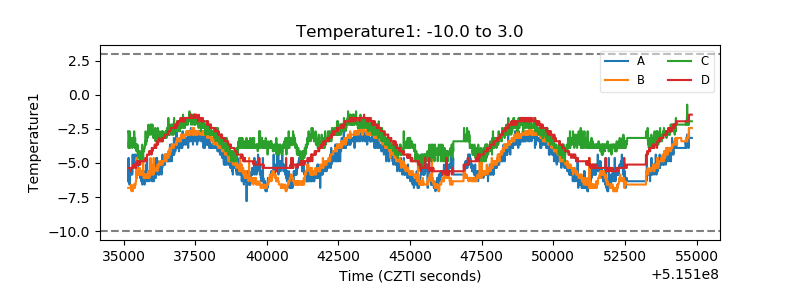 |
| Veto HV Monitor | 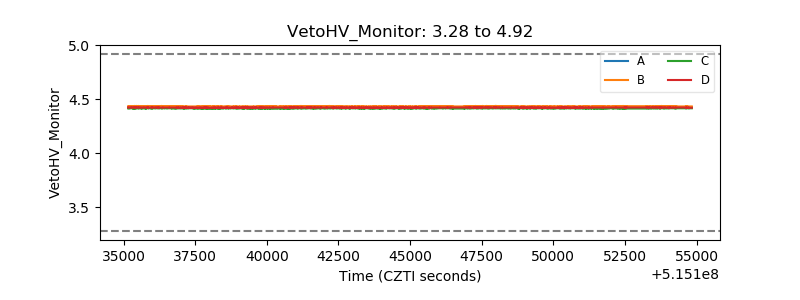 |
| Veto LLD | 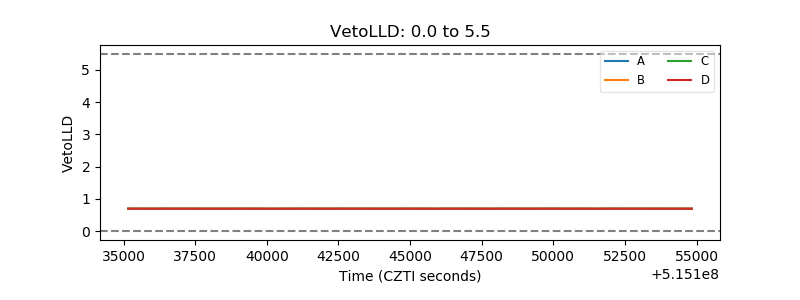 |
| Alpha Counter | 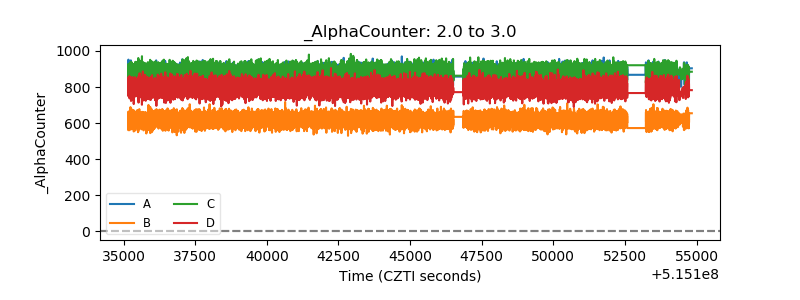 |
| _CPM_Rate | 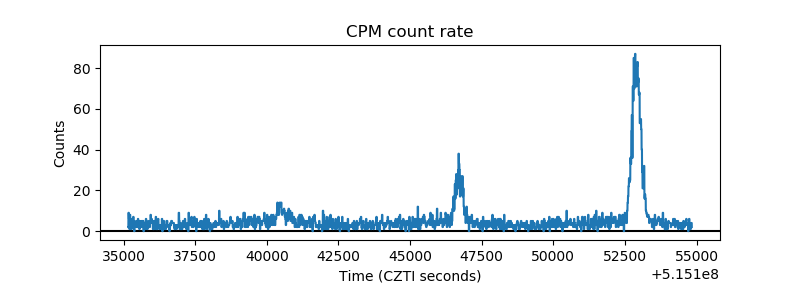 |
| CZT Counter | 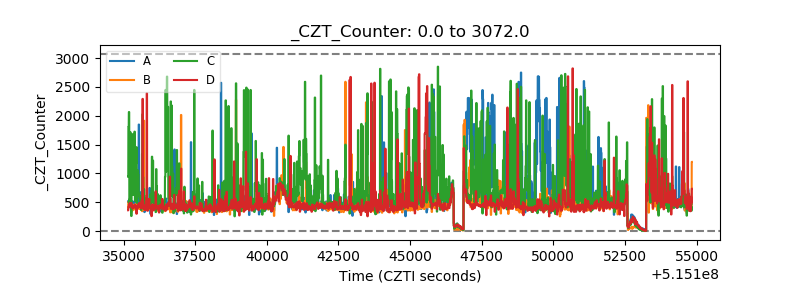 |
| +2.5 Volts monitor |  |
| +5 Volts monitor |  |
| _ROLL_ROT | 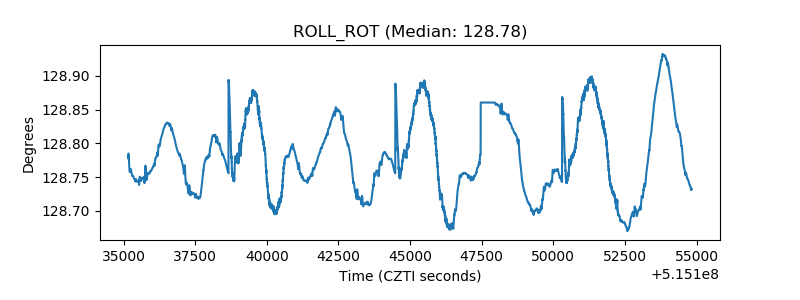 |
| _Roll_DEC | 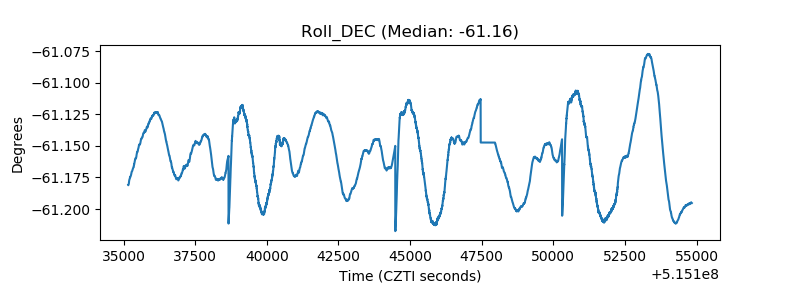 |
| _Roll_RA | 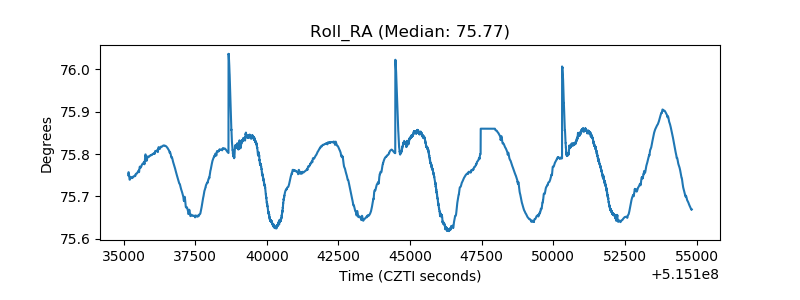 |
| Veto Counter | 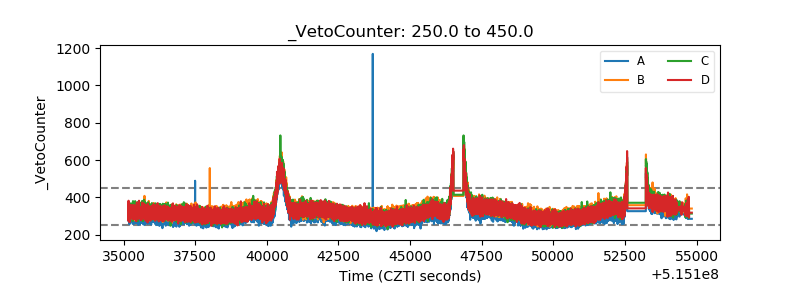 |