| Param | Original file | Final file |
|---|---|---|
| Filename | modeM0/AS1A14_049T03_9000006570_57274cztM0_level2.fits | modeM0/AS1A14_049T03_9000006570_57274cztM0_level2_quad_clean.evt |
| Size (bytes) | 532,869,120 | 90,800,640 |
| Size | 508.2 MB | 86.6 MB |
| Events in quadrant A | 7,165,108 | 507,587 |
| Events in quadrant B | 3,397,446 | 663,171 |
| Events in quadrant C | 5,253,397 | 558,892 |
| Events in quadrant D | 3,400,248 | 562,685 |
| Mode M0 | |||
|---|---|---|---|
| Quadrant | BADHDUFLAG | Total packets | Discarded packets |
| A | 0 | 25756 | 40 |
| B | 0 | 14759 | 36 |
| C | 0 | 20215 | 45 |
| D | 0 | 14775 | 18 |
| Mode M9 | |||
|---|---|---|---|
| Quadrant | BADHDUFLAG | Total packets | Discarded packets |
| A | 0 | 10 | 0 |
| B | 0 | 10 | 0 |
| C | 0 | 10 | 0 |
| D | 0 | 10 | 0 |
| Mode SS | |||
|---|---|---|---|
| Quadrant | BADHDUFLAG | Total packets | Discarded packets |
| A | 0 | 134 | 0 |
| B | 0 | 134 | 0 |
| C | 0 | 134 | 0 |
| D | 0 | 134 | 0 |
| Quadrant | Total seconds | Saturated seconds | Saturation percentage |
|---|---|---|---|
| A | 6551 | 1524 | 23.263624% |
| B | 6543 | 150 | 2.292526% |
| C | 6550 | 546 | 8.335878% |
| D | 6552 | 75 | 1.144689% |
Noise dominated data is calculated using 1-second bins in cleaned event files. If a bin has >2000 counts, and if more than 50% of those come from <1% of pixels, then it is considered to be noise-dominated and hence unusable.
| Quadrant | # 1 sec bins | Bins with >0 counts | Bins with >2000 counts | High rate bins dominated by noise | Noise dominated (total time) | Noise dominated (detector-on time) | Marked lightcurve |
|---|---|---|---|---|---|---|---|
| A | 7552 | 6561 | 1079 | 1079 | 14.29% | 16.45% | 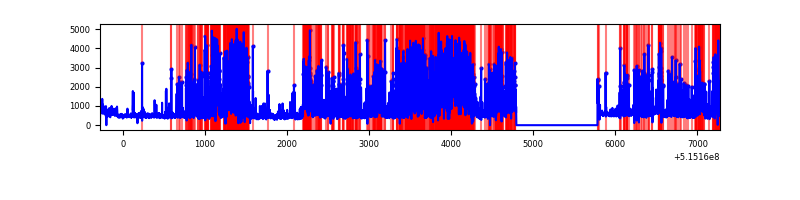 |
| B | 7552 | 6554 | 89 | 89 | 1.18% | 1.36% | 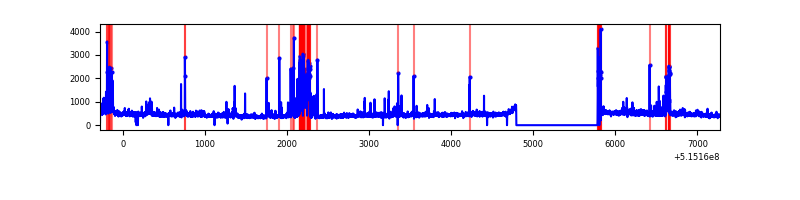 |
| C | 7552 | 6562 | 456 | 456 | 6.04% | 6.95% | 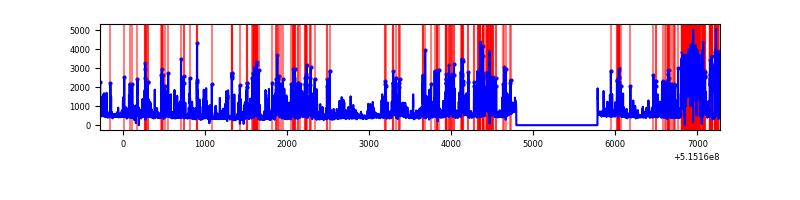 |
| D | 7552 | 6559 | 50 | 50 | 0.66% | 0.76% | 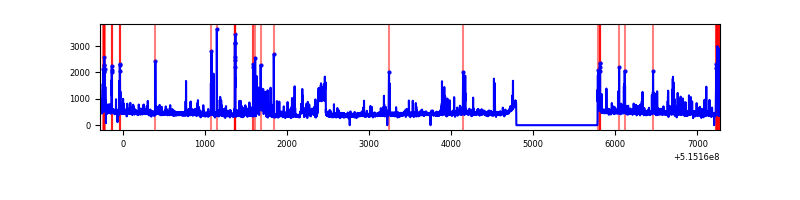 |
Top three noisy pixels from each quadrant. If the there are fewer than three noisy pixels in the level2.evt file, extra rows are filled as -1
| Pixel properties | Quadrant properties | ||||||
|---|---|---|---|---|---|---|---|
| Quadrant | DetID | PixID | Counts | Sigma | Mean | Median | Sigma |
| A | 3 | 95 | 4339739 | 28389.61 | 618 | 601 | 152.8 |
| A | 8 | 4 | 314075 | 2050.96 | 618 | 601 | 152.8 |
| A | 3 | 14 | 86910 | 564.69 | 618 | 601 | 152.8 |
| B | 10 | 16 | 292090 | 1953.66 | 686 | 661 | 149.2 |
| B | 10 | 247 | 120154 | 801.05 | 686 | 661 | 149.2 |
| B | 0 | 199 | 72956 | 484.64 | 686 | 661 | 149.2 |
| C | 15 | 224 | 2441929 | 13709.38 | 650 | 643 | 178.1 |
| C | 14 | 254 | 86956 | 484.7 | 650 | 643 | 178.1 |
| C | 14 | 67 | 81560 | 454.4 | 650 | 643 | 178.1 |
| D | 8 | 240 | 221947 | 1149.12 | 680 | 648 | 192.6 |
| D | 2 | 249 | 155433 | 803.74 | 680 | 648 | 192.6 |
| D | 7 | 96 | 95964 | 494.94 | 680 | 648 | 192.6 |
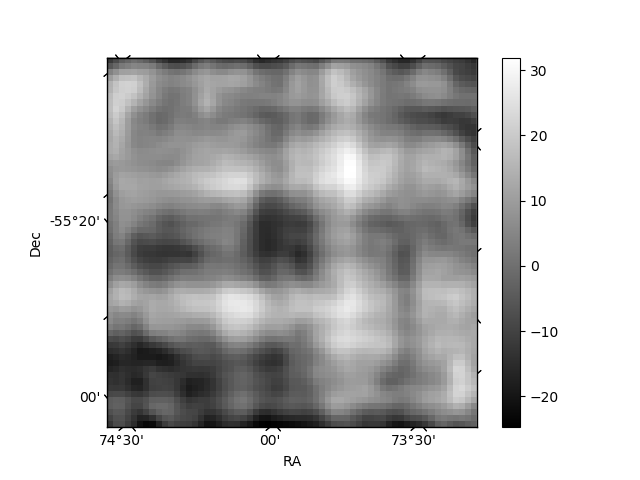
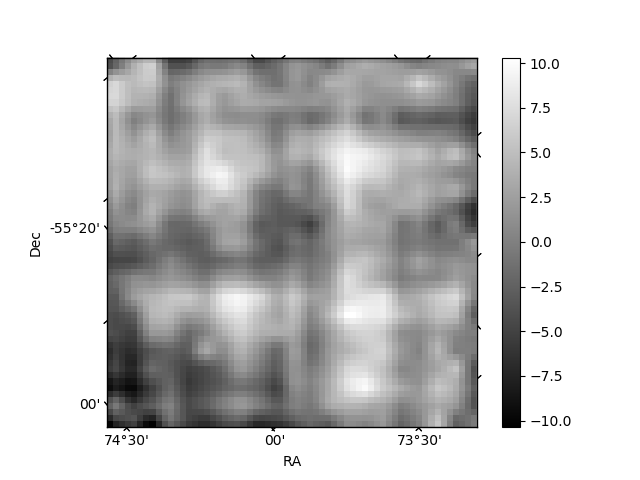
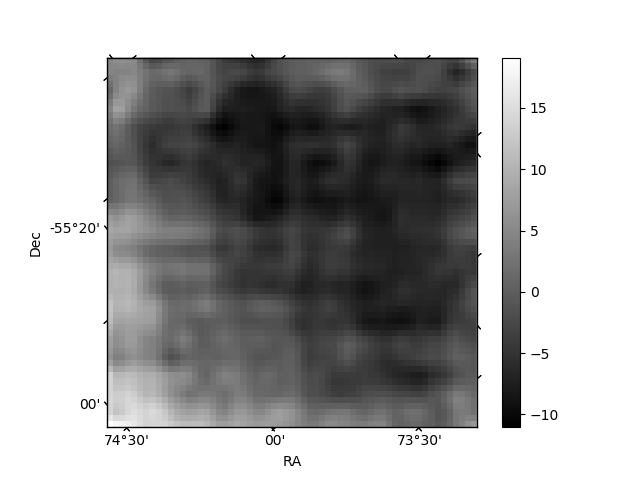
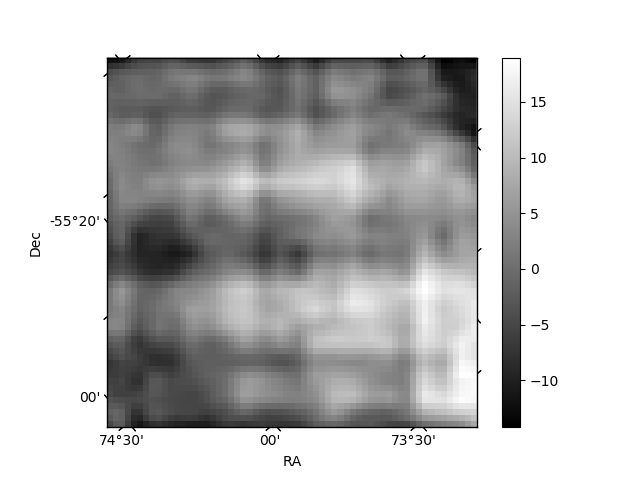
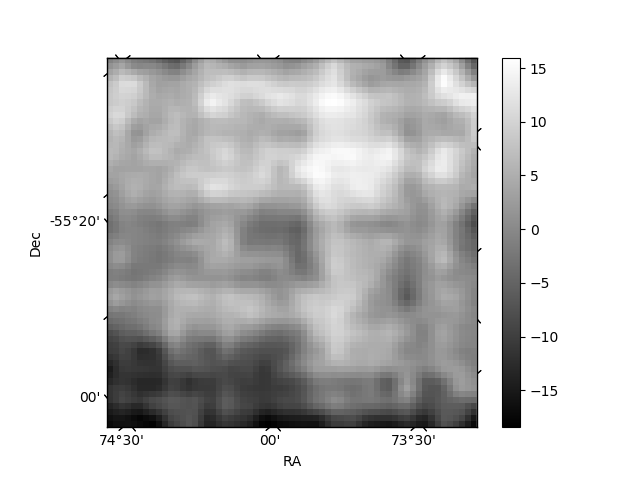
Histogram calculated using DETX and DETY for each event in the final _common_clean file
| Quadrant A | 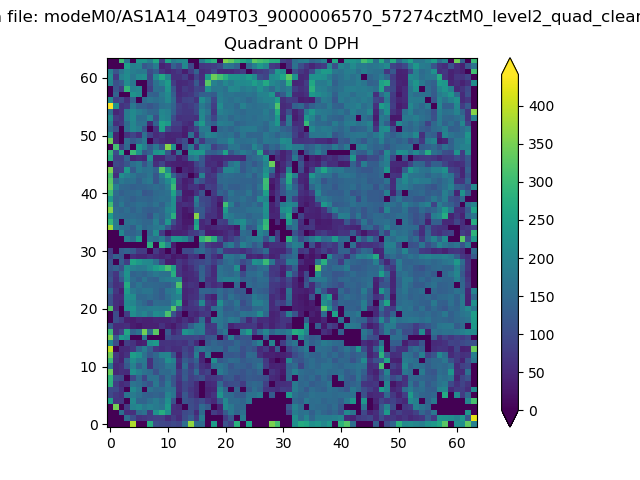 |
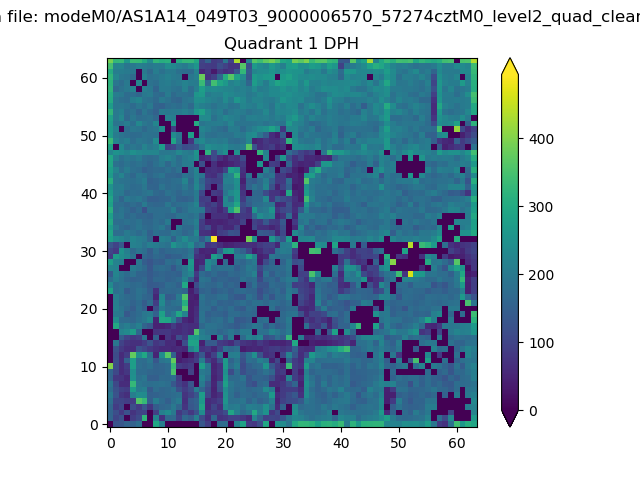 |
Quadrant B |
|---|---|---|---|
| Quadrant D | 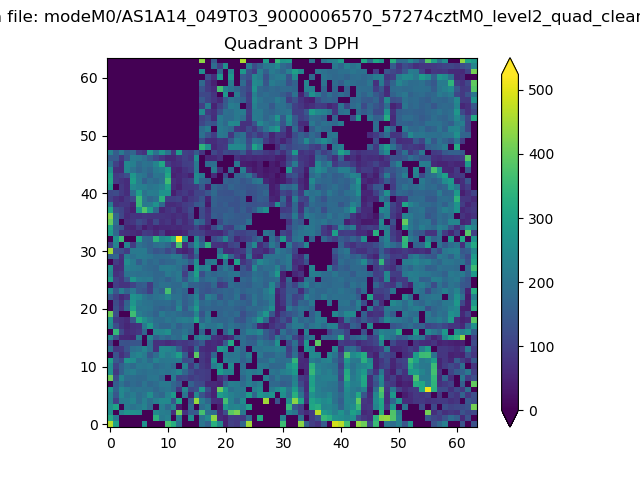 |
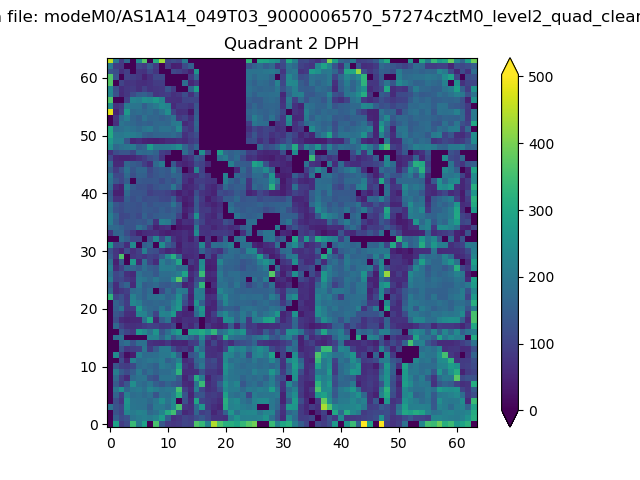 |
Quadrant C |
| Plot type | Count rate plots | Images |
|---|---|---|
| Comparison with Poisson distribution Blue bars denote a histogram of data divided into 1 sec bins. Red curve is a Poisson curve with rate = median count rate of data. |
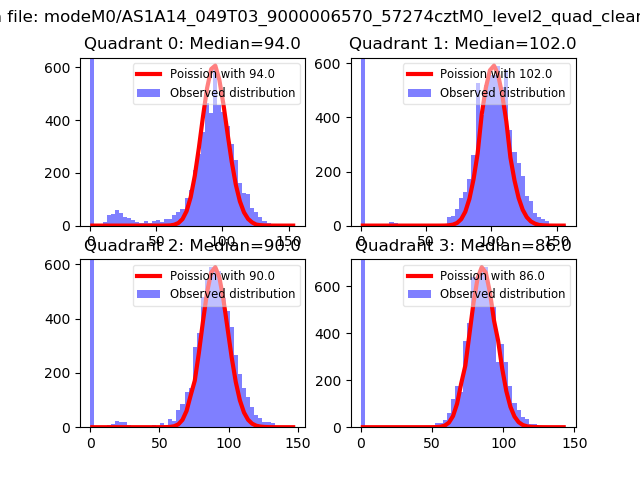 |
 |
| Quadrant-wise count rates Data is divided into 100 sec bins |
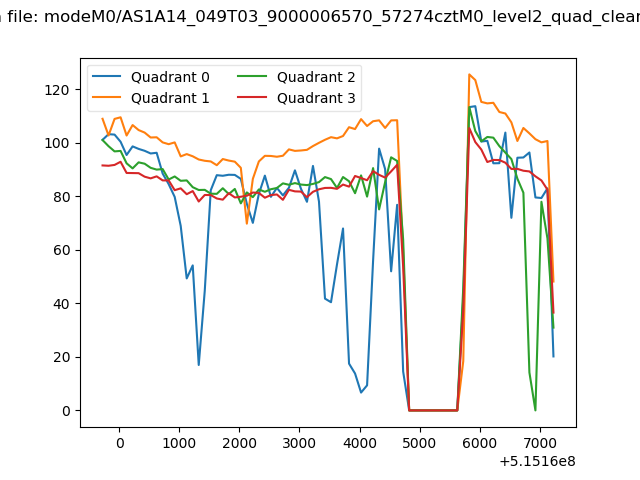 |
|
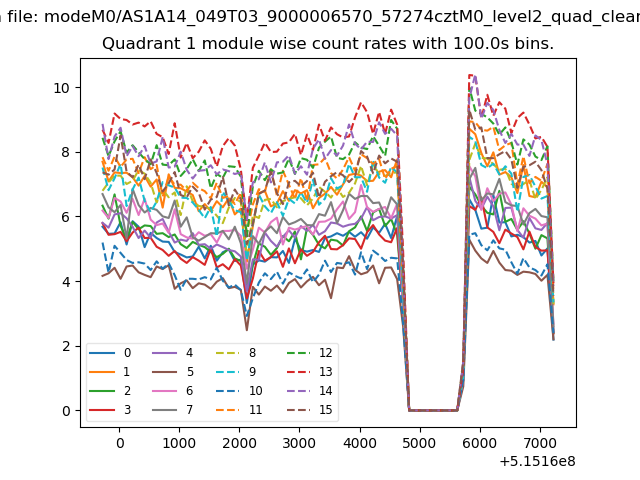
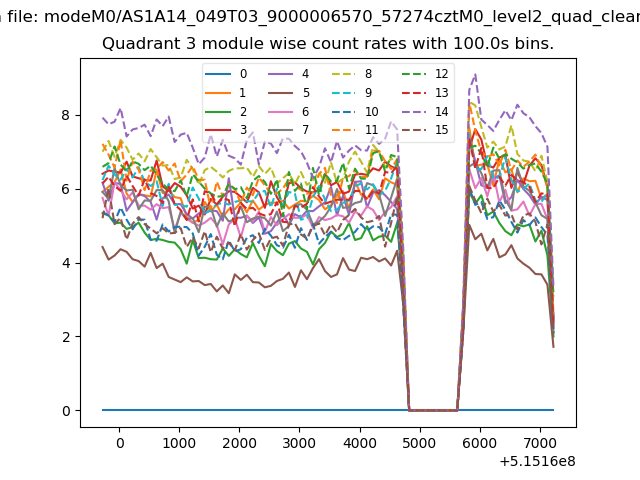
| Module-wise count rates for Quadrant A Data is divided into 100 sec bins |
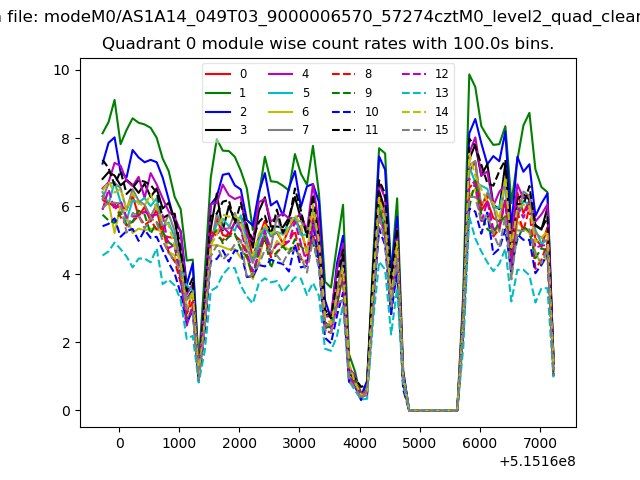 |
 |
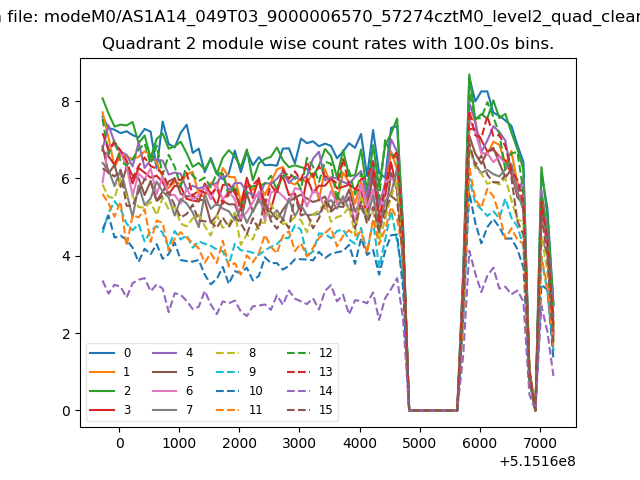
| Module-wise count rates for Quadrant B Data is divided into 100 sec bins |
 |
 |
| Module-wise count rates for Quadrant C Data is divided into 100 sec bins |
 |
 |
| Module-wise count rates for Quadrant D Data is divided into 100 sec bins |
 |
 |
| Parameter | Plot |
|---|---|
| CZT HV Monitor |  |
| D_VDD | 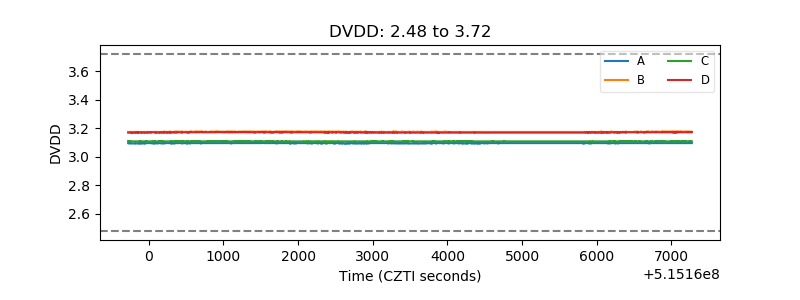 |
| Temperature 1 | 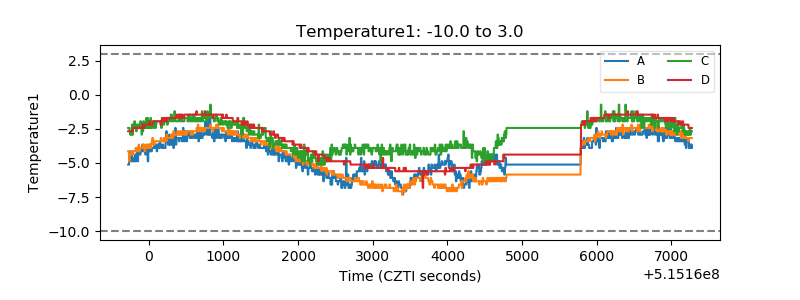 |
| Veto HV Monitor | 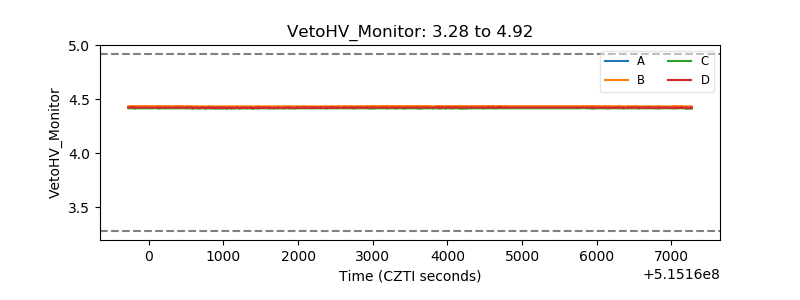 |
| Veto LLD | 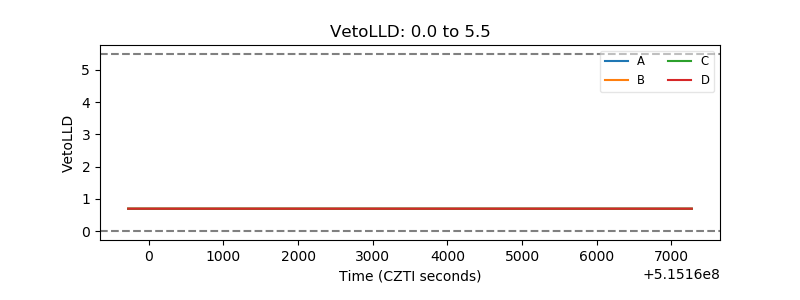 |
| Alpha Counter | 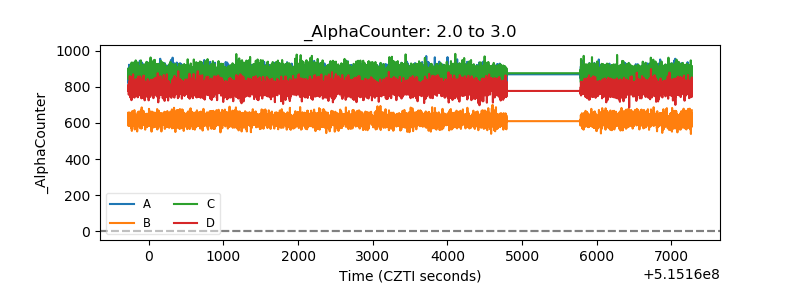 |
| _CPM_Rate | 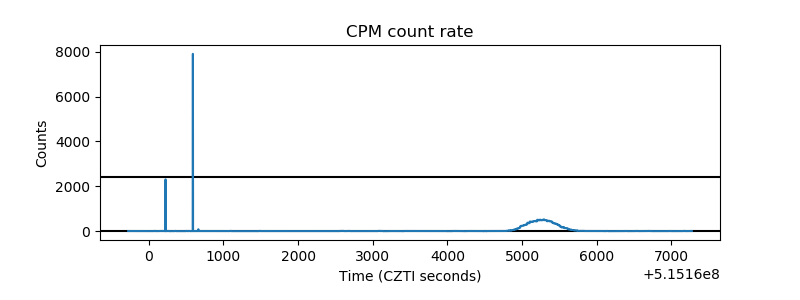 |
| CZT Counter | 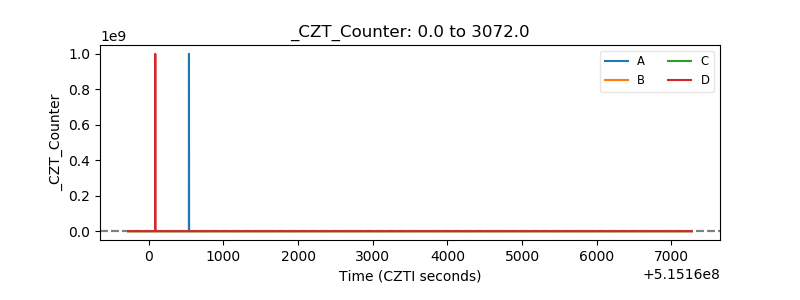 |
| +2.5 Volts monitor |  |
| +5 Volts monitor |  |
| _ROLL_ROT | 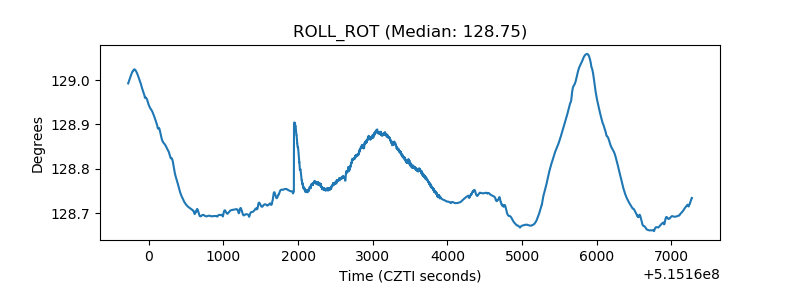 |
| _Roll_DEC | 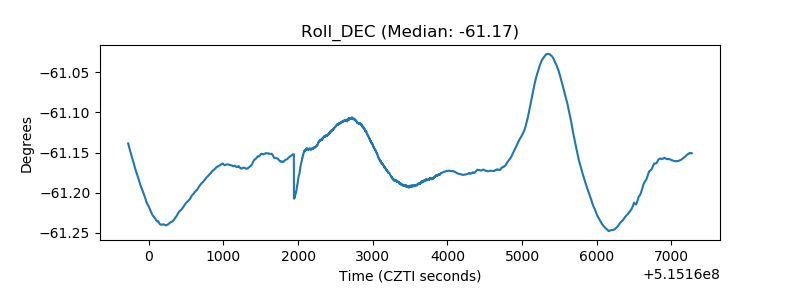 |
| _Roll_RA | 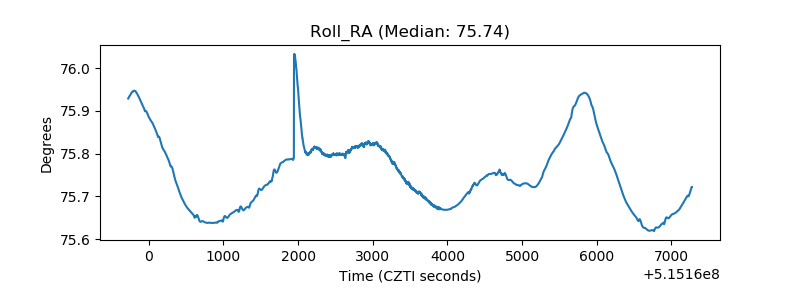 |
| Veto Counter | 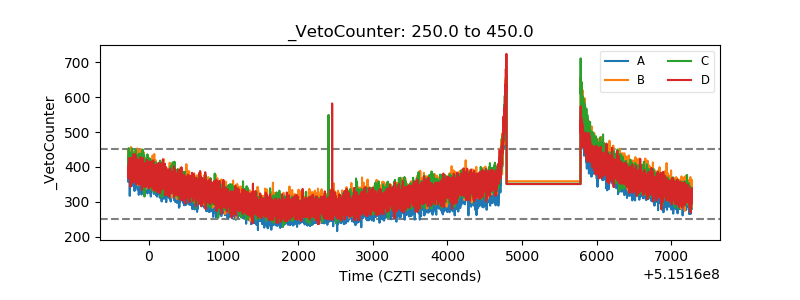 |