| Param | Original file | Final file |
|---|---|---|
| Filename | modeM0/AS1A14_049T03_9000006570_57275cztM0_level2.fits | modeM0/AS1A14_049T03_9000006570_57275cztM0_level2_quad_clean.evt |
| Size (bytes) | 460,071,360 | 80,804,160 |
| Size | 438.8 MB | 77.1 MB |
| Events in quadrant A | 5,237,177 | 489,654 |
| Events in quadrant B | 3,105,688 | 587,242 |
| Events in quadrant C | 4,950,530 | 482,703 |
| Events in quadrant D | 3,294,176 | 488,222 |
| Mode M0 | |||
|---|---|---|---|
| Quadrant | BADHDUFLAG | Total packets | Discarded packets |
| A | 0 | 19465 | 1 |
| B | 0 | 13226 | 1 |
| C | 0 | 18728 | 1 |
| D | 0 | 13952 | 2 |
| Mode M9 | |||
|---|---|---|---|
| Quadrant | BADHDUFLAG | Total packets | Discarded packets |
| A | 0 | 11 | 0 |
| B | 0 | 11 | 0 |
| C | 0 | 11 | 0 |
| D | 0 | 11 | 0 |
| Mode SS | |||
|---|---|---|---|
| Quadrant | BADHDUFLAG | Total packets | Discarded packets |
| A | 0 | 118 | 0 |
| B | 0 | 118 | 0 |
| C | 0 | 118 | 0 |
| D | 0 | 118 | 0 |
| Quadrant | Total seconds | Saturated seconds | Saturation percentage |
|---|---|---|---|
| A | 5696 | 827 | 14.518961% |
| B | 5696 | 120 | 2.106742% |
| C | 5697 | 600 | 10.531859% |
| D | 5696 | 190 | 3.335674% |
Noise dominated data is calculated using 1-second bins in cleaned event files. If a bin has >2000 counts, and if more than 50% of those come from <1% of pixels, then it is considered to be noise-dominated and hence unusable.
| Quadrant | # 1 sec bins | Bins with >0 counts | Bins with >2000 counts | High rate bins dominated by noise | Noise dominated (total time) | Noise dominated (detector-on time) | Marked lightcurve |
|---|---|---|---|---|---|---|---|
| A | 6821 | 5697 | 620 | 620 | 9.09% | 10.88% | 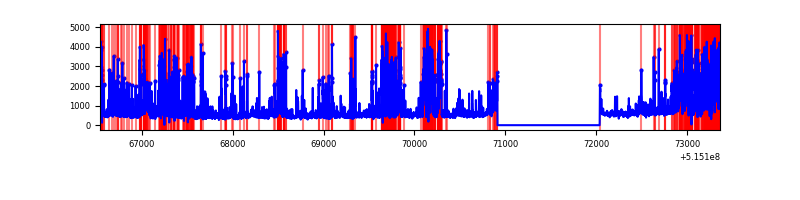 |
| B | 6821 | 5697 | 70 | 70 | 1.03% | 1.23% | 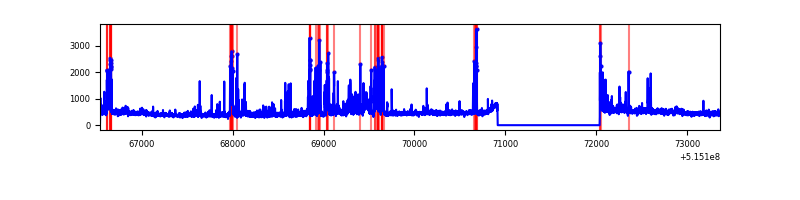 |
| C | 6822 | 5698 | 473 | 473 | 6.93% | 8.30% | 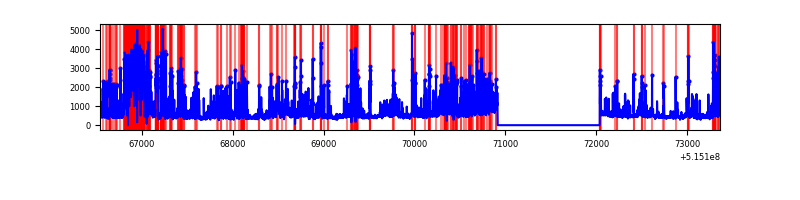 |
| D | 6821 | 5697 | 159 | 159 | 2.33% | 2.79% | 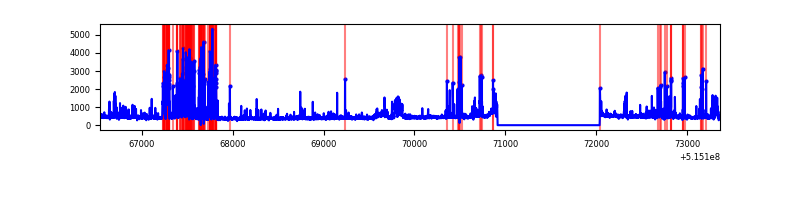 |
Top three noisy pixels from each quadrant. If the there are fewer than three noisy pixels in the level2.evt file, extra rows are filled as -1
| Pixel properties | Quadrant properties | ||||||
|---|---|---|---|---|---|---|---|
| Quadrant | DetID | PixID | Counts | Sigma | Mean | Median | Sigma |
| A | 3 | 95 | 1788573 | 12663.52 | 569 | 554 | 141.2 |
| A | 7 | 64 | 720582 | 5099.55 | 569 | 554 | 141.2 |
| A | 8 | 4 | 362878 | 2566.13 | 569 | 554 | 141.2 |
| B | 5 | 185 | 358947 | 2776.05 | 598 | 578 | 129.1 |
| B | 0 | 199 | 86244 | 663.6 | 598 | 578 | 129.1 |
| B | 8 | 234 | 75213 | 578.15 | 598 | 578 | 129.1 |
| C | 15 | 224 | 2253052 | 14942.24 | 553 | 546 | 150.7 |
| C | 12 | 252 | 246289 | 1630.16 | 553 | 546 | 150.7 |
| C | 14 | 254 | 132975 | 878.48 | 553 | 546 | 150.7 |
| D | 2 | 249 | 564448 | 3456.27 | 575 | 548 | 163.2 |
| D | 8 | 240 | 181979 | 1112.03 | 575 | 548 | 163.2 |
| D | 12 | 128 | 63082 | 383.29 | 575 | 548 | 163.2 |
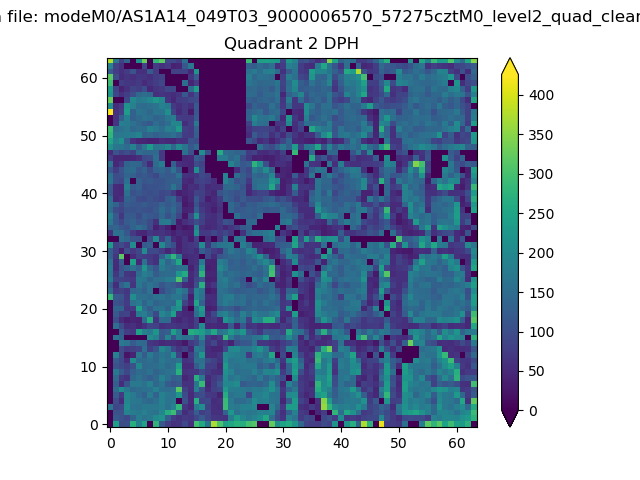
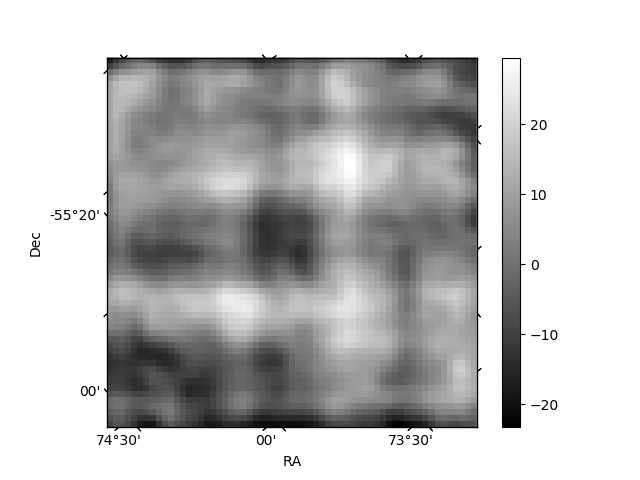
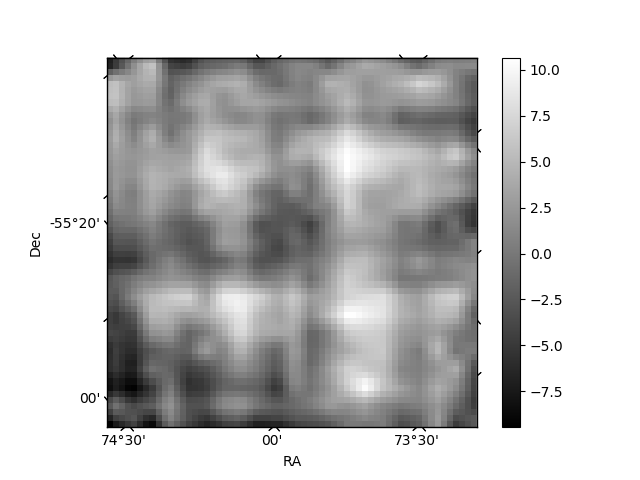
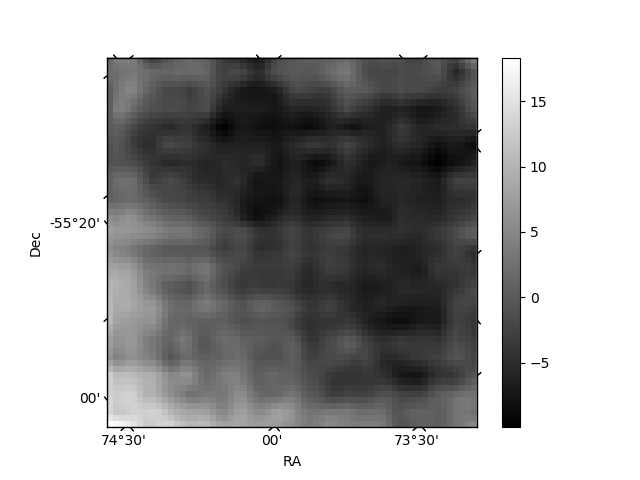
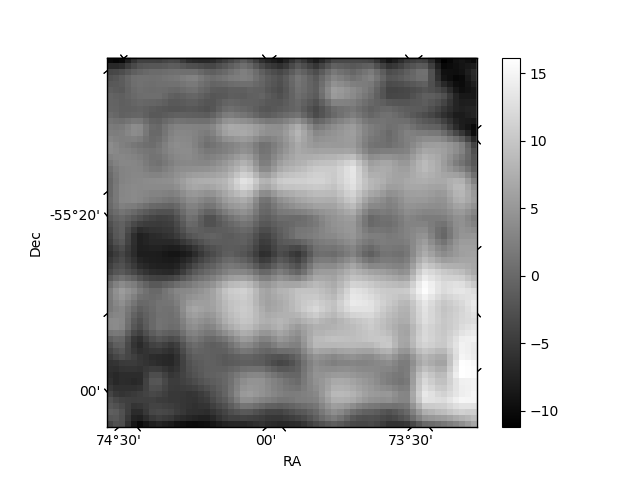
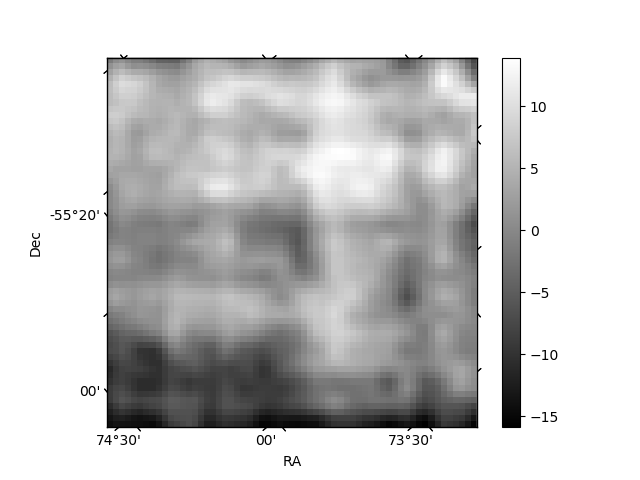
Histogram calculated using DETX and DETY for each event in the final _common_clean file
| Quadrant A | 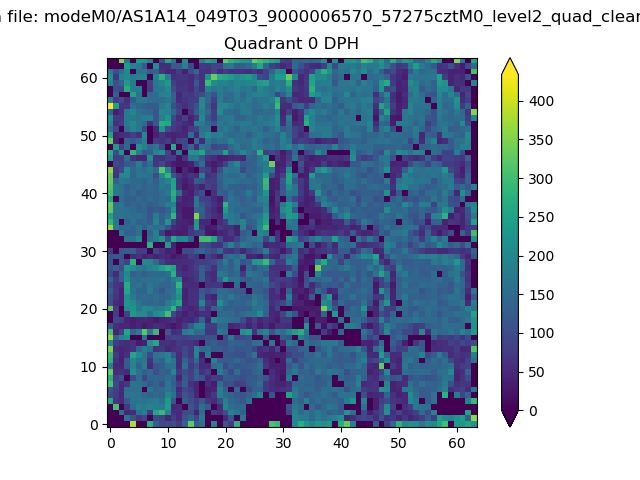 |
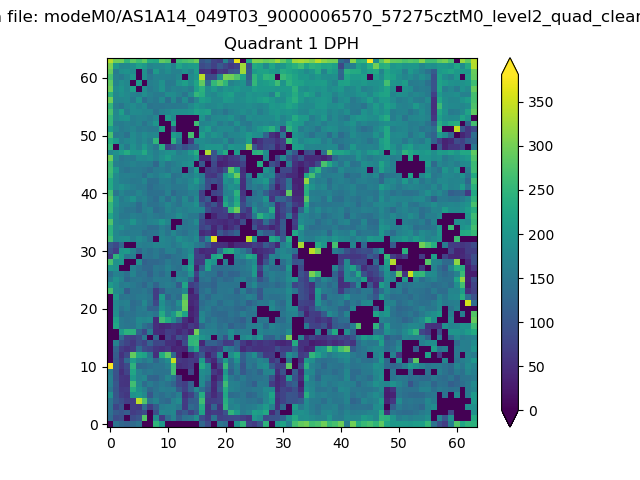 |
Quadrant B |
|---|---|---|---|
| Quadrant D | 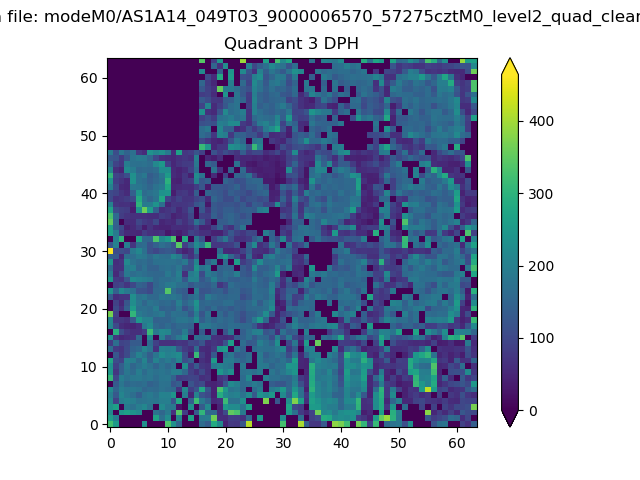 |
 |
Quadrant C |
| Plot type | Count rate plots | Images |
|---|---|---|
| Comparison with Poisson distribution Blue bars denote a histogram of data divided into 1 sec bins. Red curve is a Poisson curve with rate = median count rate of data. |
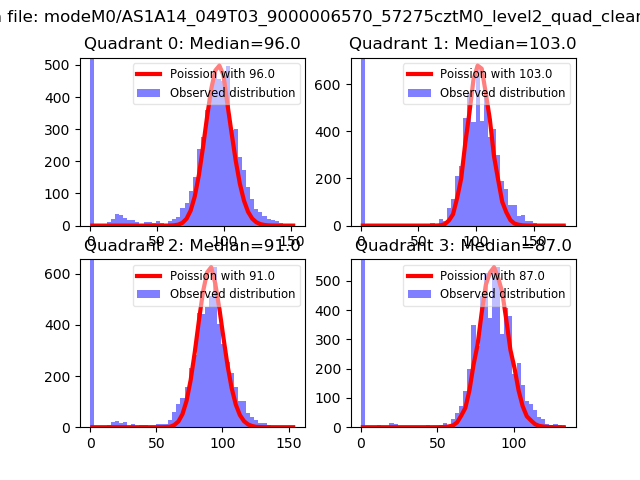 |
 |
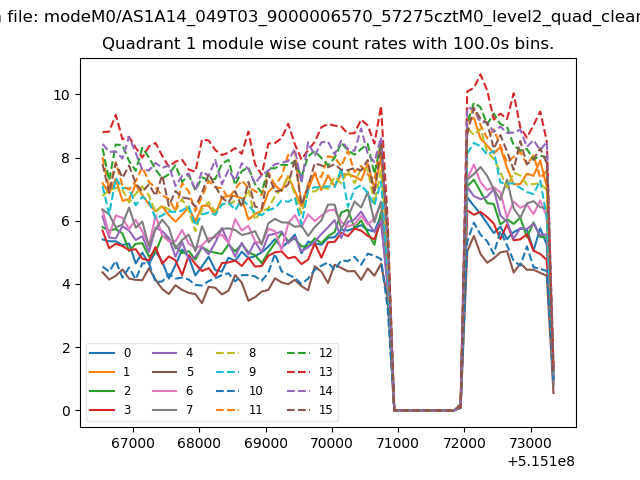
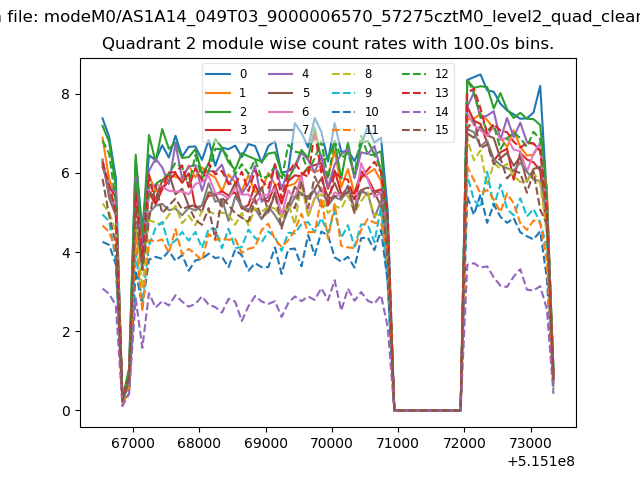
| Quadrant-wise count rates Data is divided into 100 sec bins |
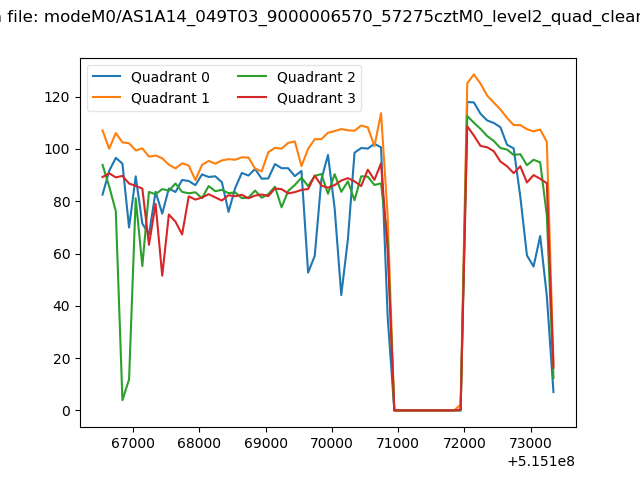 |
|
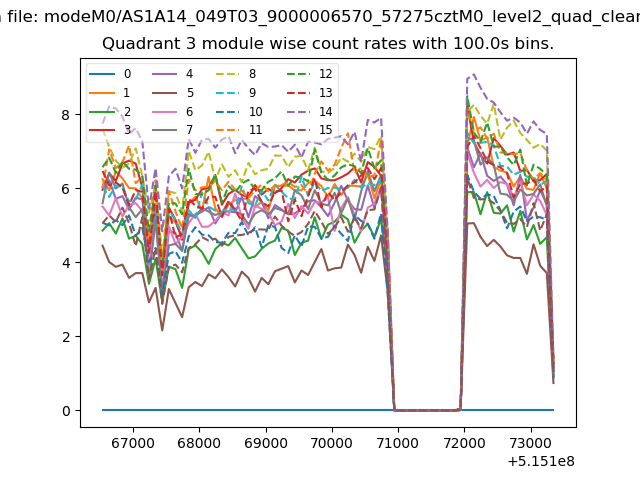
| Module-wise count rates for Quadrant A Data is divided into 100 sec bins |
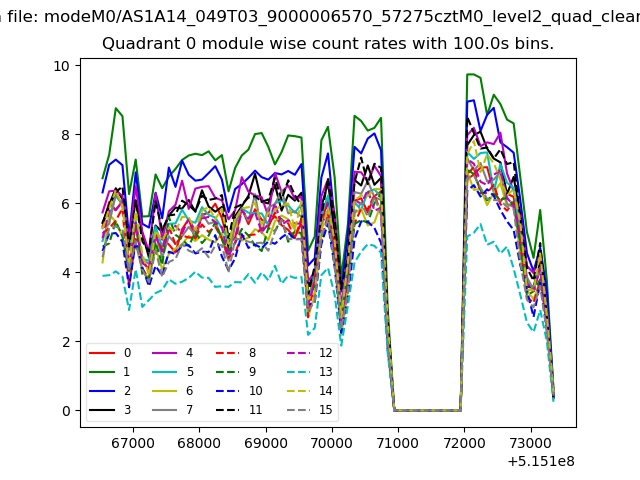 |
 |
| Module-wise count rates for Quadrant B Data is divided into 100 sec bins |
 |
 |
| Module-wise count rates for Quadrant C Data is divided into 100 sec bins |
 |
 |
| Module-wise count rates for Quadrant D Data is divided into 100 sec bins |
 |
 |
| Parameter | Plot |
|---|---|
| CZT HV Monitor | 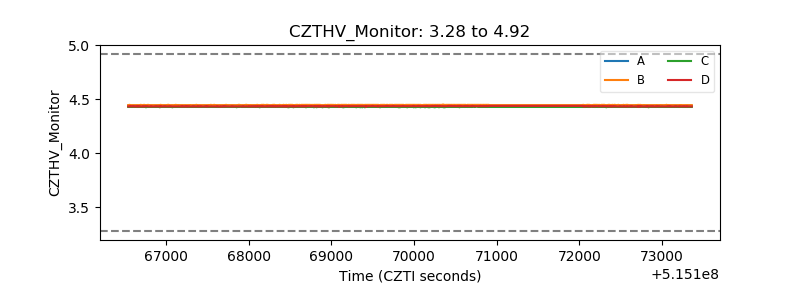 |
| D_VDD | 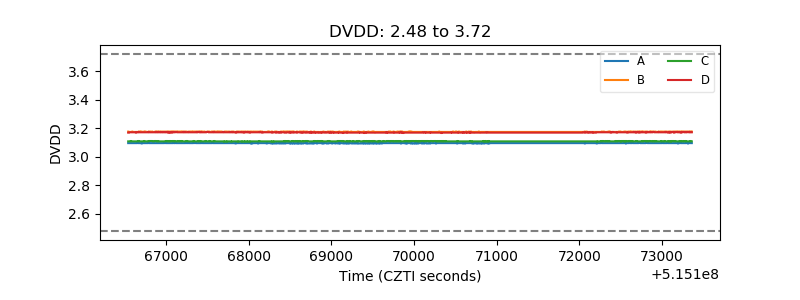 |
| Temperature 1 | 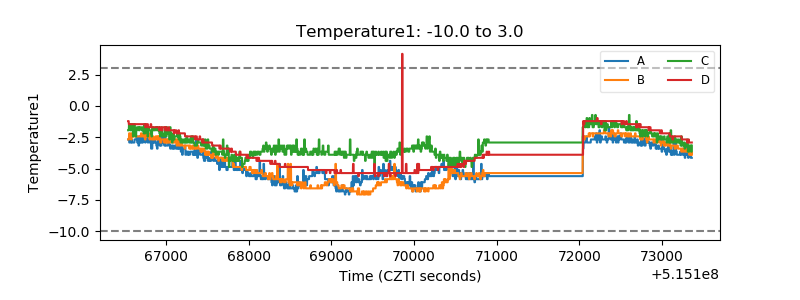 |
| Veto HV Monitor | 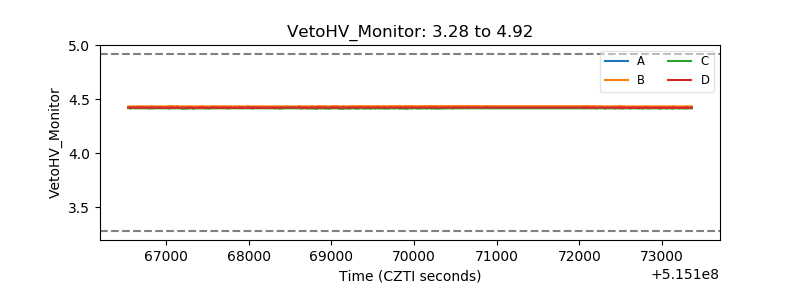 |
| Veto LLD | 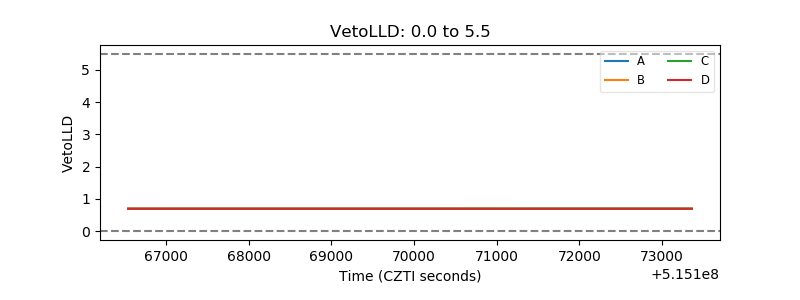 |
| Alpha Counter | 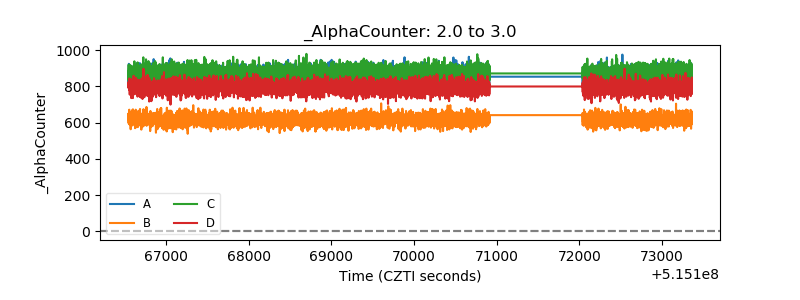 |
| _CPM_Rate | 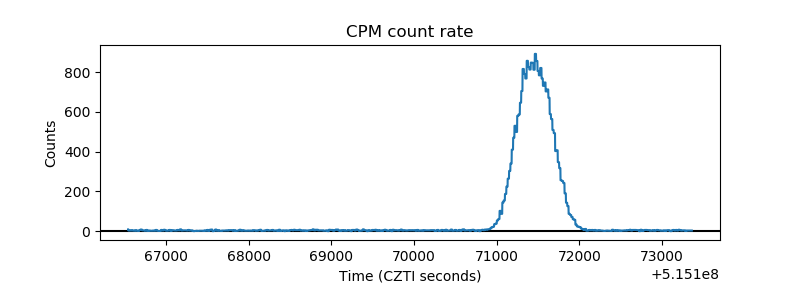 |
| CZT Counter | 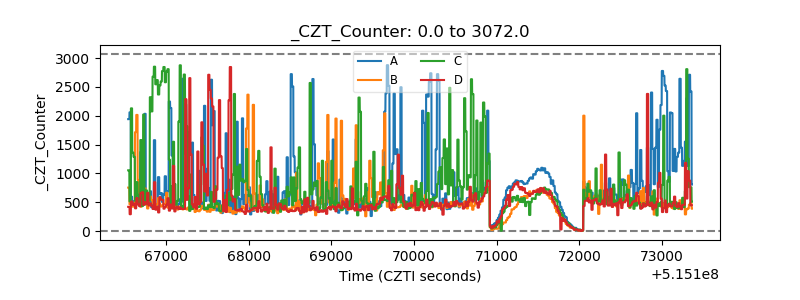 |
| +2.5 Volts monitor |  |
| +5 Volts monitor | 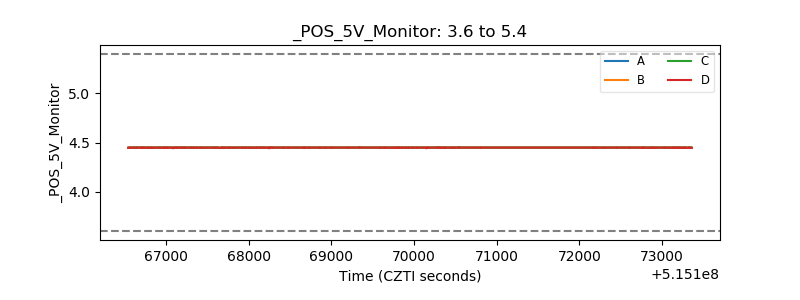 |
| _ROLL_ROT | 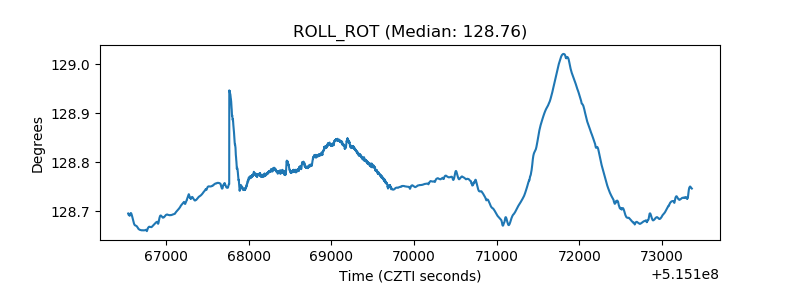 |
| _Roll_DEC | 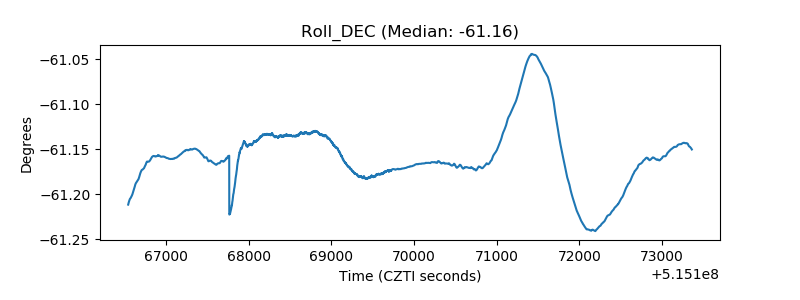 |
| _Roll_RA | 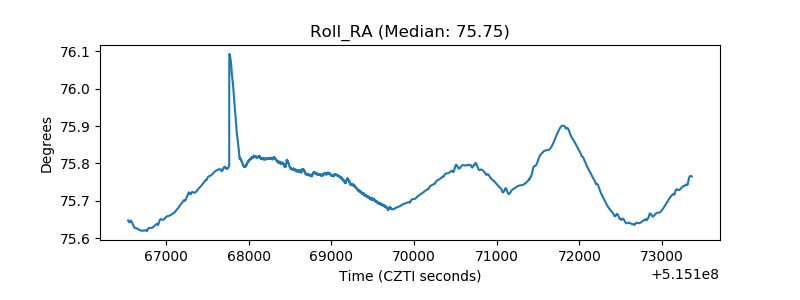 |
| Veto Counter | 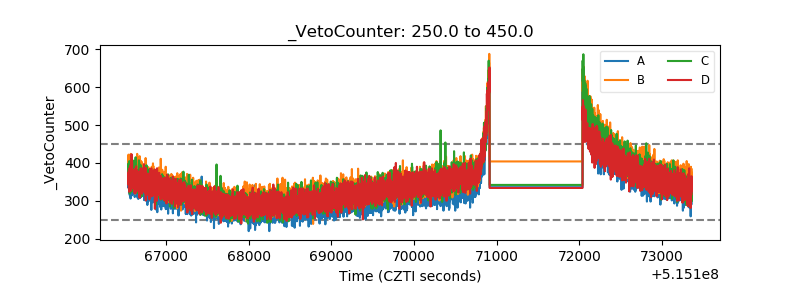 |