| Param | Original file | Final file |
|---|---|---|
| Filename | modeM0/AS1A14_049T03_9000006570_57276cztM0_level2.fits | modeM0/AS1A14_049T03_9000006570_57276cztM0_level2_quad_clean.evt |
| Size (bytes) | 555,477,120 | 80,256,960 |
| Size | 529.7 MB | 76.5 MB |
| Events in quadrant A | 9,239,797 | 380,473 |
| Events in quadrant B | 2,890,820 | 618,934 |
| Events in quadrant C | 4,573,880 | 516,986 |
| Events in quadrant D | 3,407,601 | 508,294 |
| Mode M0 | |||
|---|---|---|---|
| Quadrant | BADHDUFLAG | Total packets | Discarded packets |
| A | 0 | 31490 | 1 |
| B | 0 | 12666 | 1 |
| C | 0 | 17706 | 1 |
| D | 0 | 14187 | 1 |
| Mode M9 | |||
|---|---|---|---|
| Quadrant | BADHDUFLAG | Total packets | Discarded packets |
| A | 0 | 11 | 0 |
| B | 0 | 11 | 0 |
| C | 0 | 11 | 0 |
| D | 0 | 11 | 0 |
| Mode SS | |||
|---|---|---|---|
| Quadrant | BADHDUFLAG | Total packets | Discarded packets |
| A | 0 | 120 | 0 |
| B | 0 | 120 | 0 |
| C | 0 | 120 | 0 |
| D | 0 | 120 | 0 |
| Quadrant | Total seconds | Saturated seconds | Saturation percentage |
|---|---|---|---|
| A | 5791 | 2285 | 39.457779% |
| B | 5791 | 92 | 1.588672% |
| C | 5792 | 432 | 7.458564% |
| D | 5792 | 150 | 2.589779% |
Noise dominated data is calculated using 1-second bins in cleaned event files. If a bin has >2000 counts, and if more than 50% of those come from <1% of pixels, then it is considered to be noise-dominated and hence unusable.
| Quadrant | # 1 sec bins | Bins with >0 counts | Bins with >2000 counts | High rate bins dominated by noise | Noise dominated (total time) | Noise dominated (detector-on time) | Marked lightcurve |
|---|---|---|---|---|---|---|---|
| A | 6971 | 5790 | 1854 | 1854 | 26.60% | 32.02% | 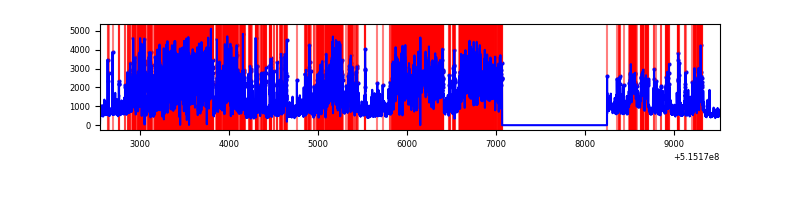 |
| B | 6971 | 5791 | 33 | 33 | 0.47% | 0.57% | 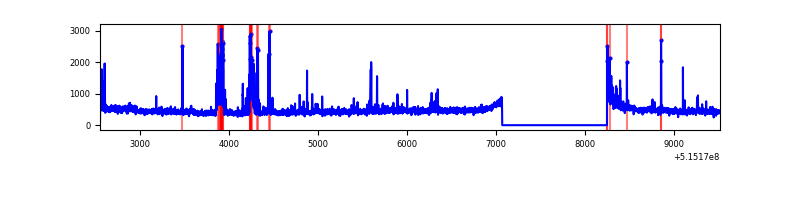 |
| C | 6972 | 5791 | 291 | 291 | 4.17% | 5.03% | 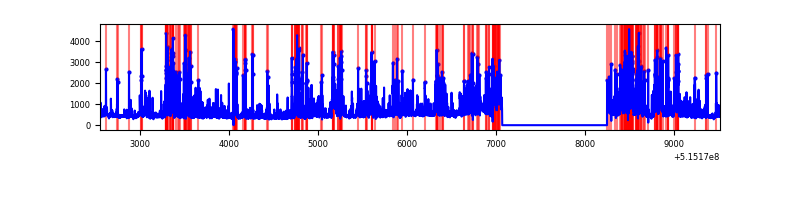 |
| D | 6972 | 5792 | 144 | 144 | 2.07% | 2.49% | 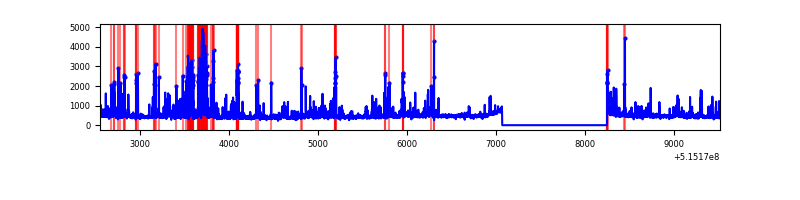 |
Top three noisy pixels from each quadrant. If the there are fewer than three noisy pixels in the level2.evt file, extra rows are filled as -1
| Pixel properties | Quadrant properties | ||||||
|---|---|---|---|---|---|---|---|
| Quadrant | DetID | PixID | Counts | Sigma | Mean | Median | Sigma |
| A | 3 | 95 | 6680832 | 52730.83 | 512 | 499 | 126.7 |
| A | 8 | 4 | 296559 | 2336.93 | 512 | 499 | 126.7 |
| A | 3 | 14 | 214358 | 1688.08 | 512 | 499 | 126.7 |
| B | 7 | 252 | 168334 | 1269.36 | 620 | 599 | 132.1 |
| B | 5 | 185 | 66019 | 495.08 | 620 | 599 | 132.1 |
| B | 0 | 199 | 56860 | 425.76 | 620 | 599 | 132.1 |
| C | 15 | 224 | 1904252 | 11830.91 | 583 | 578 | 160.9 |
| C | 14 | 254 | 151785 | 939.72 | 583 | 578 | 160.9 |
| C | 14 | 67 | 85523 | 527.91 | 583 | 578 | 160.9 |
| D | 2 | 249 | 317197 | 1872.46 | 595 | 568 | 169.1 |
| D | 3 | 224 | 225209 | 1328.47 | 595 | 568 | 169.1 |
| D | 8 | 240 | 187524 | 1105.61 | 595 | 568 | 169.1 |
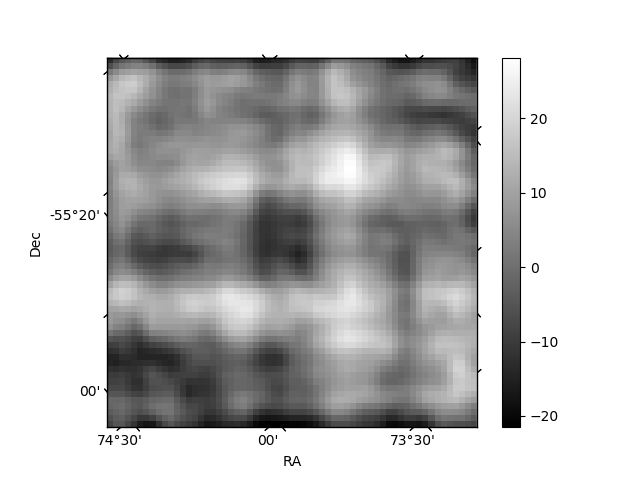
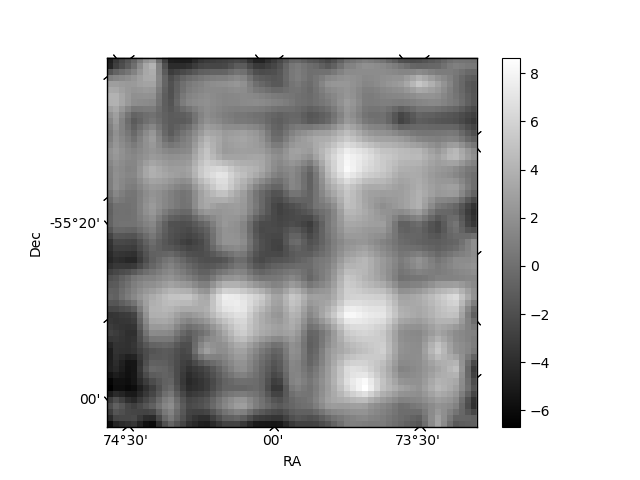
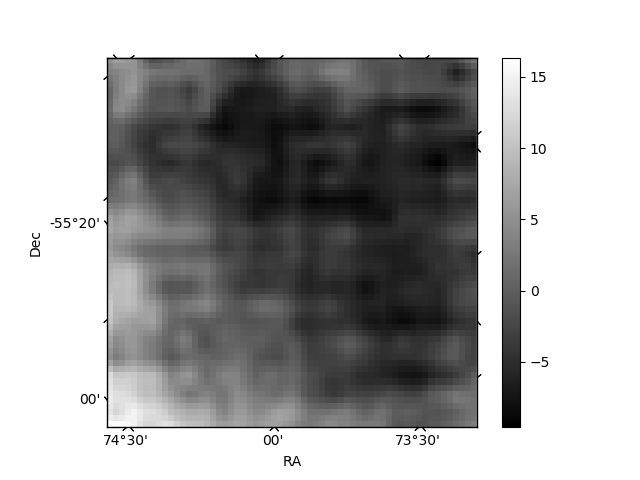
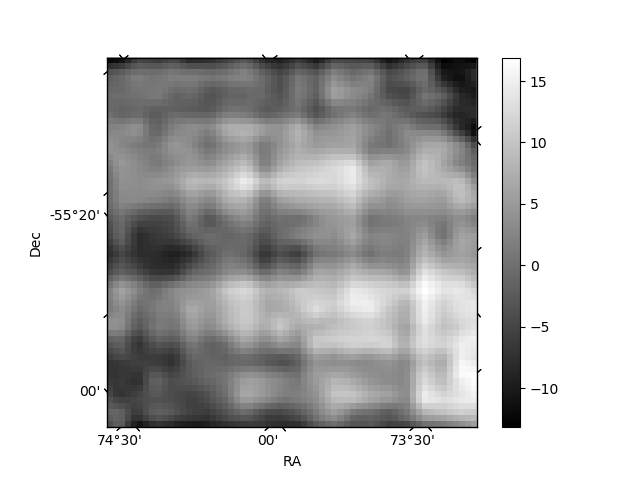
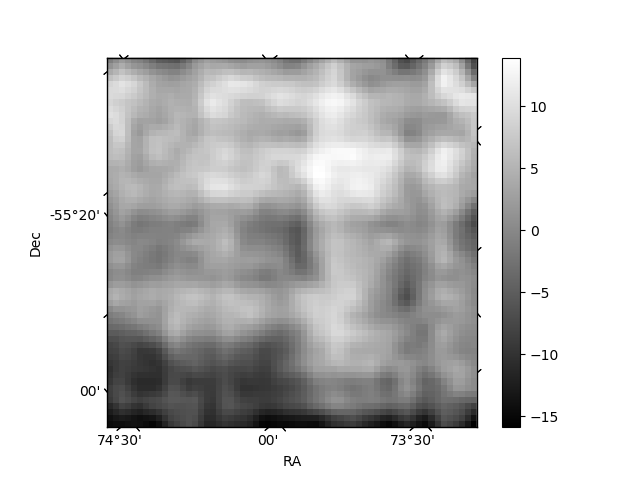
Histogram calculated using DETX and DETY for each event in the final _common_clean file
| Quadrant A | 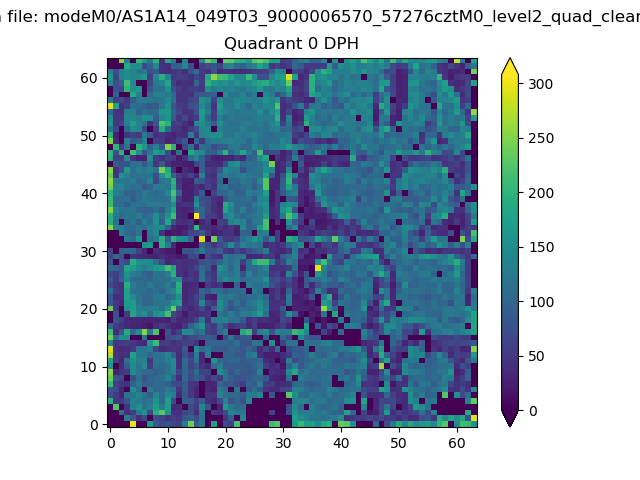 |
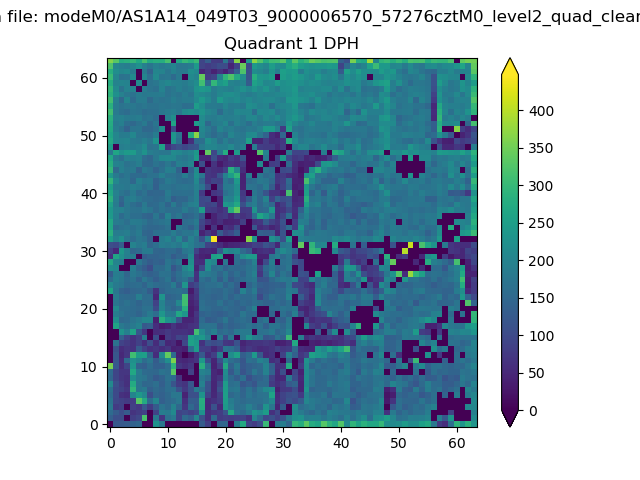 |
Quadrant B |
|---|---|---|---|
| Quadrant D | 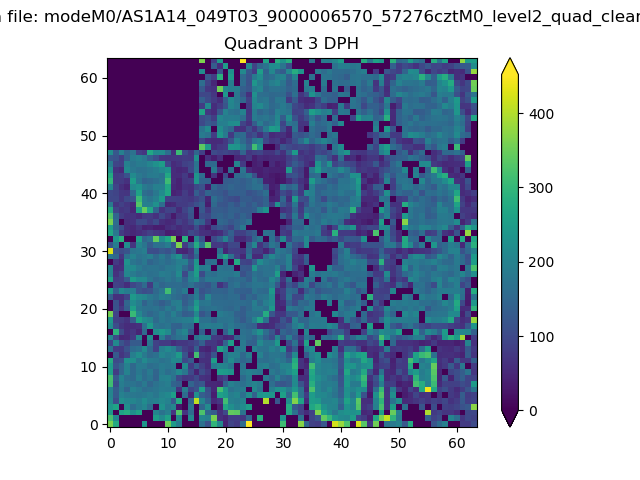 |
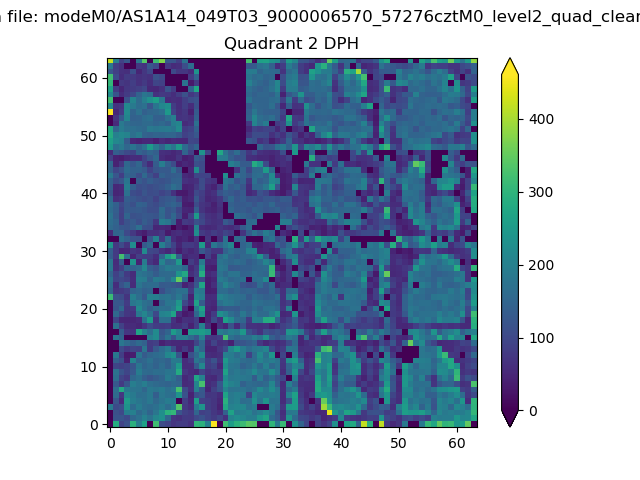 |
Quadrant C |
| Plot type | Count rate plots | Images |
|---|---|---|
| Comparison with Poisson distribution Blue bars denote a histogram of data divided into 1 sec bins. Red curve is a Poisson curve with rate = median count rate of data. |
 |
 |
| Quadrant-wise count rates Data is divided into 100 sec bins |
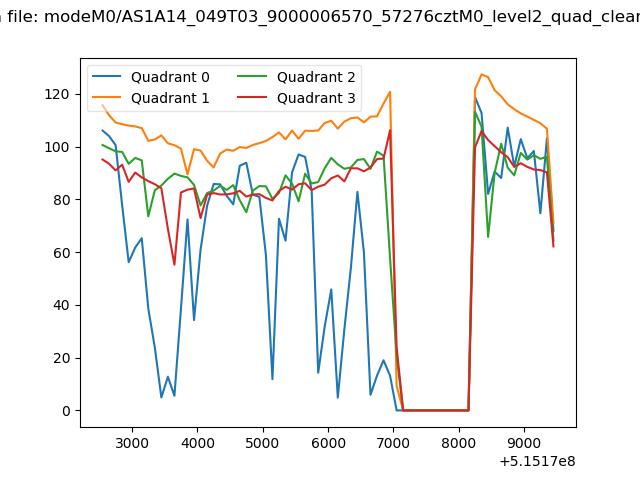 |
|
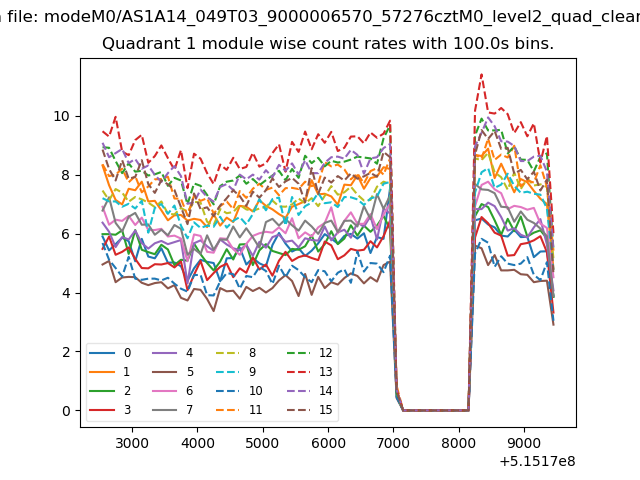
| Module-wise count rates for Quadrant A Data is divided into 100 sec bins |
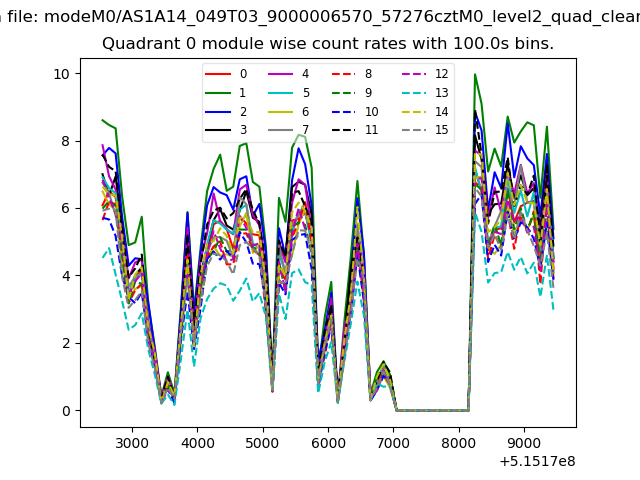 |
 |
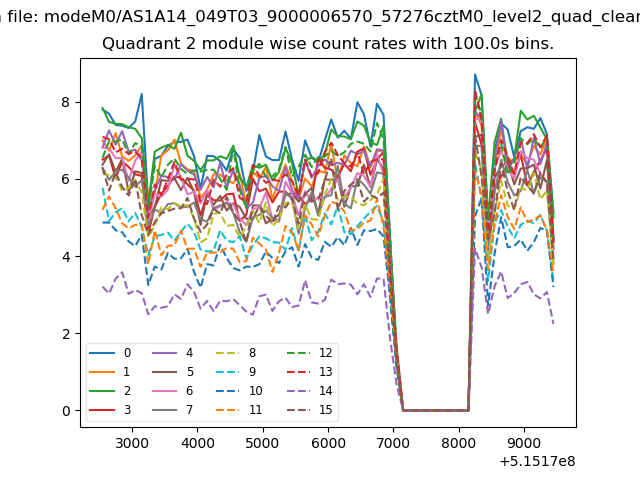
| Module-wise count rates for Quadrant B Data is divided into 100 sec bins |
 |
 |
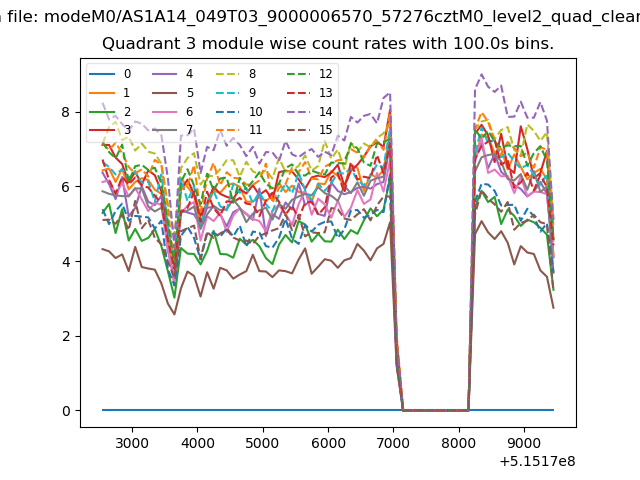
| Module-wise count rates for Quadrant C Data is divided into 100 sec bins |
 |
 |
| Module-wise count rates for Quadrant D Data is divided into 100 sec bins |
 |
 |
| Parameter | Plot |
|---|---|
| CZT HV Monitor | 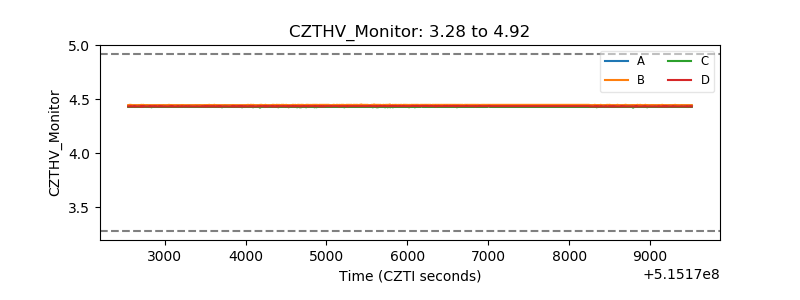 |
| D_VDD | 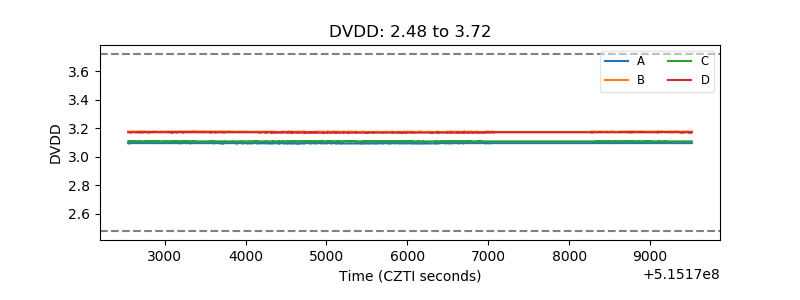 |
| Temperature 1 | 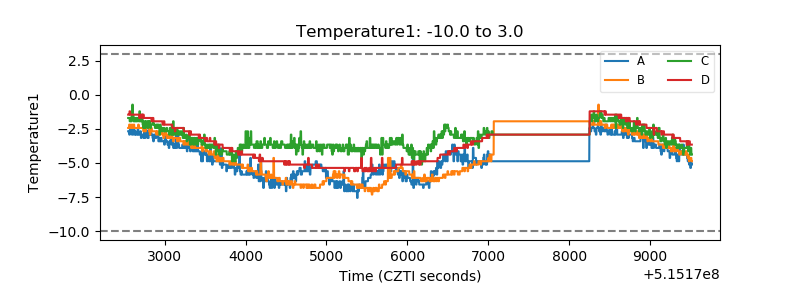 |
| Veto HV Monitor | 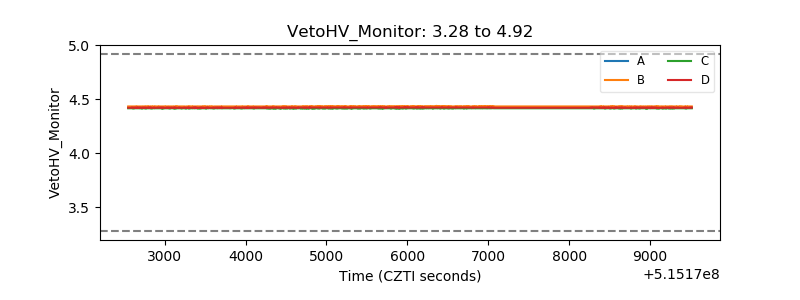 |
| Veto LLD | 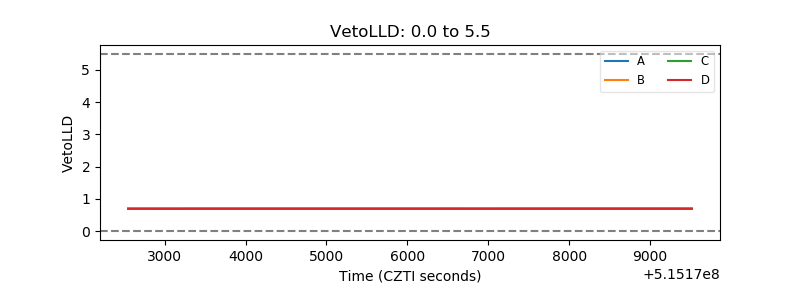 |
| Alpha Counter | 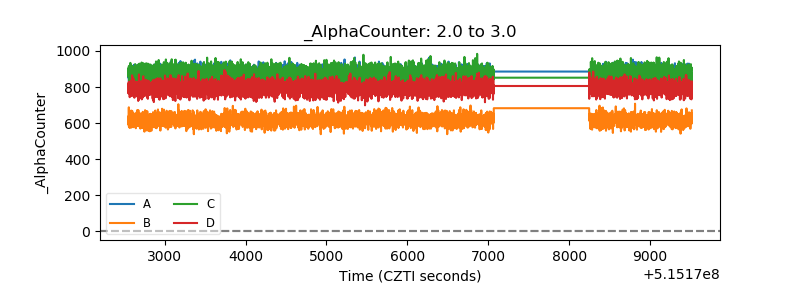 |
| _CPM_Rate | 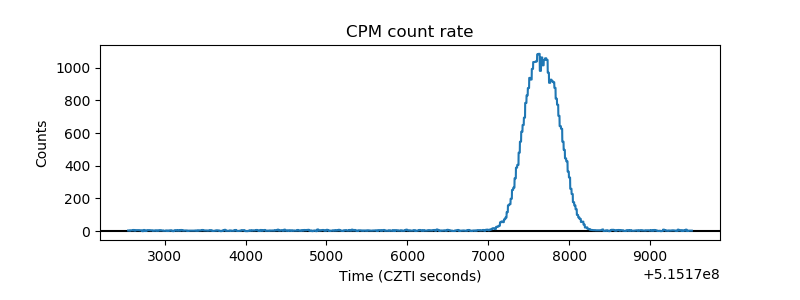 |
| CZT Counter | 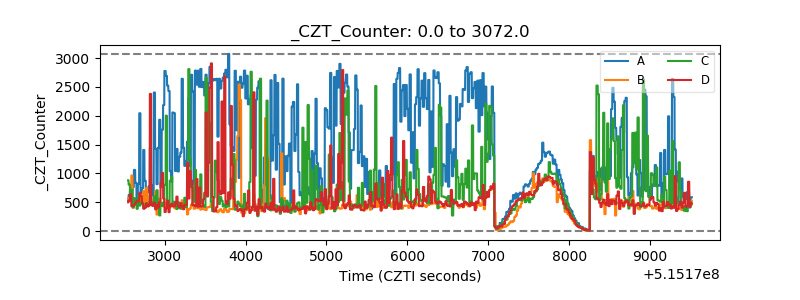 |
| +2.5 Volts monitor |  |
| +5 Volts monitor |  |
| _ROLL_ROT | 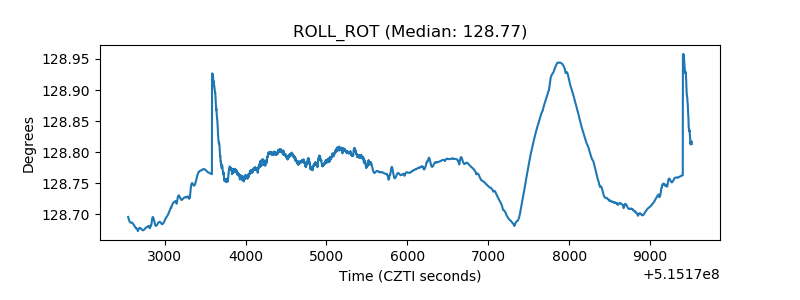 |
| _Roll_DEC | 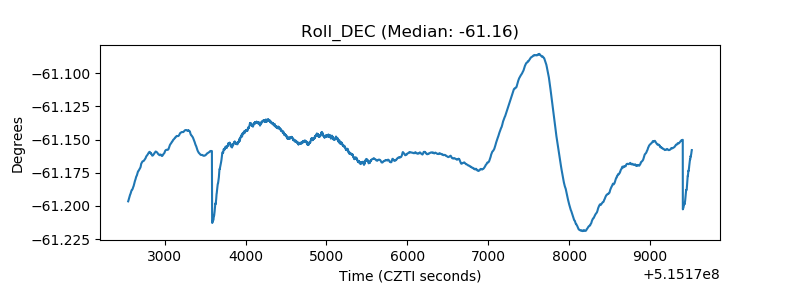 |
| _Roll_RA | 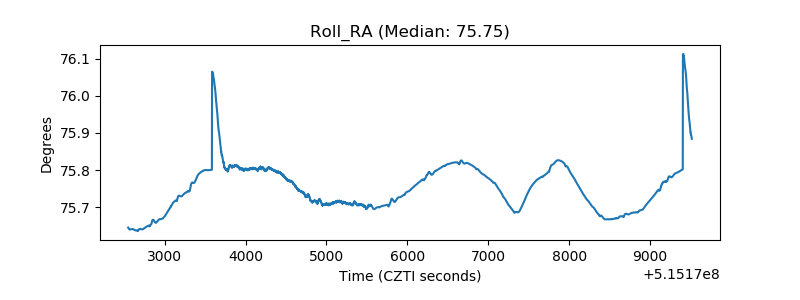 |
| Veto Counter | 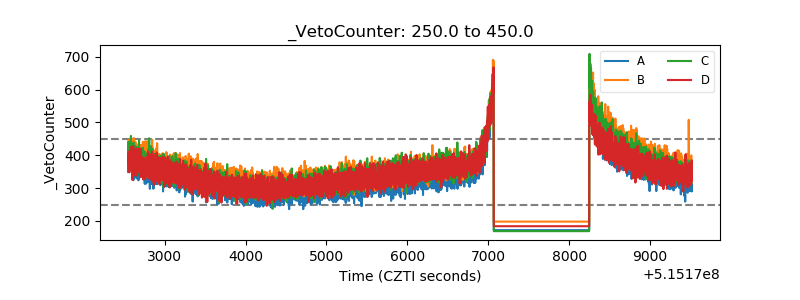 |