| Param | Original file | Final file |
|---|---|---|
| Filename | modeM0/AS1A14_049T03_9000006570_57280cztM0_level2.fits | modeM0/AS1A14_049T03_9000006570_57280cztM0_level2_quad_clean.evt |
| Size (bytes) | 419,443,200 | 90,365,760 |
| Size | 400.0 MB | 86.2 MB |
| Events in quadrant A | 3,950,329 | 588,817 |
| Events in quadrant B | 3,333,073 | 625,990 |
| Events in quadrant C | 4,136,035 | 537,737 |
| Events in quadrant D | 3,579,534 | 510,918 |
| Mode M0 | |||
|---|---|---|---|
| Quadrant | BADHDUFLAG | Total packets | Discarded packets |
| A | 0 | 16419 | 1 |
| B | 0 | 14868 | 1 |
| C | 0 | 17101 | 1 |
| D | 0 | 15714 | 1 |
| Mode M9 | |||
|---|---|---|---|
| Quadrant | BADHDUFLAG | Total packets | Discarded packets |
| A | 0 | 6 | 0 |
| B | 0 | 6 | 0 |
| C | 0 | 6 | 0 |
| D | 0 | 6 | 0 |
| Mode SS | |||
|---|---|---|---|
| Quadrant | BADHDUFLAG | Total packets | Discarded packets |
| A | 0 | 138 | 0 |
| B | 0 | 138 | 0 |
| C | 0 | 138 | 0 |
| D | 0 | 138 | 0 |
| Quadrant | Total seconds | Saturated seconds | Saturation percentage |
|---|---|---|---|
| A | 6782 | 81 | 1.194338% |
| B | 6783 | 110 | 1.621701% |
| C | 6783 | 194 | 2.860091% |
| D | 6783 | 91 | 1.341589% |
Noise dominated data is calculated using 1-second bins in cleaned event files. If a bin has >2000 counts, and if more than 50% of those come from <1% of pixels, then it is considered to be noise-dominated and hence unusable.
| Quadrant | # 1 sec bins | Bins with >0 counts | Bins with >2000 counts | High rate bins dominated by noise | Noise dominated (total time) | Noise dominated (detector-on time) | Marked lightcurve |
|---|---|---|---|---|---|---|---|
| A | 7686 | 7057 | 27 | 27 | 0.35% | 0.38% | 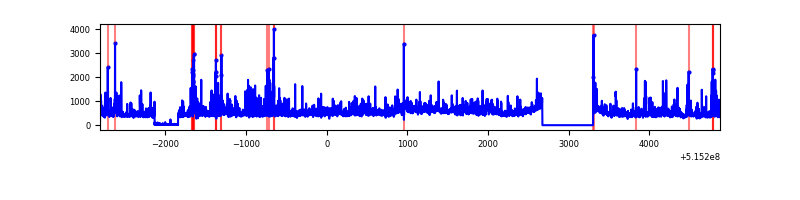 |
| B | 7687 | 7058 | 36 | 36 | 0.47% | 0.51% | 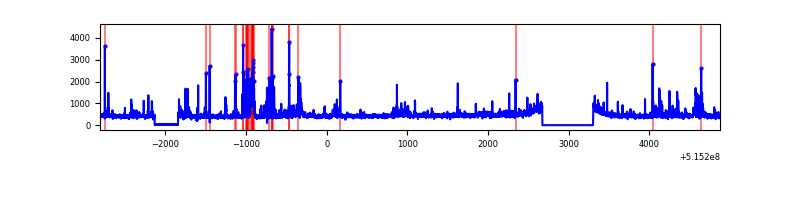 |
| C | 7687 | 7058 | 148 | 148 | 1.93% | 2.10% | 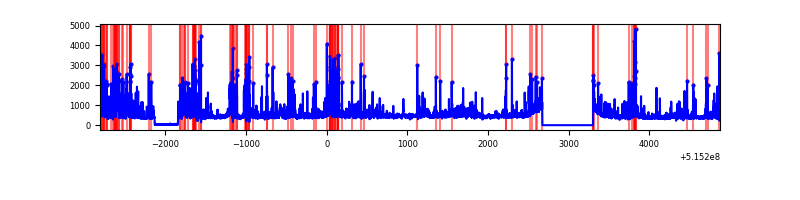 |
| D | 7687 | 7058 | 70 | 70 | 0.91% | 0.99% | 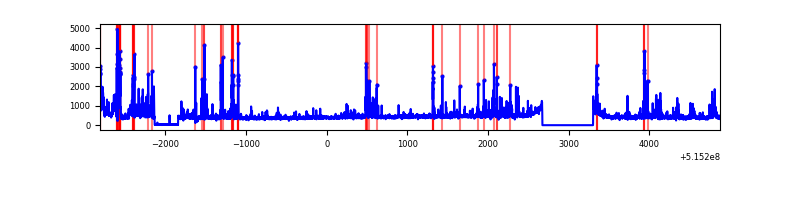 |
Top three noisy pixels from each quadrant. If the there are fewer than three noisy pixels in the level2.evt file, extra rows are filled as -1
| Pixel properties | Quadrant properties | ||||||
|---|---|---|---|---|---|---|---|
| Quadrant | DetID | PixID | Counts | Sigma | Mean | Median | Sigma |
| A | 3 | 14 | 627462 | 3513.32 | 716 | 698 | 178.4 |
| A | 8 | 4 | 425098 | 2378.97 | 716 | 698 | 178.4 |
| A | 3 | 95 | 52427 | 289.97 | 716 | 698 | 178.4 |
| B | 5 | 185 | 186430 | 1216.37 | 709 | 682 | 152.7 |
| B | 10 | 247 | 161356 | 1052.18 | 709 | 682 | 152.7 |
| B | 0 | 199 | 49605 | 320.37 | 709 | 682 | 152.7 |
| C | 15 | 224 | 1113817 | 6016.2 | 685 | 677 | 185.0 |
| C | 14 | 254 | 89611 | 480.66 | 685 | 677 | 185.0 |
| C | 12 | 252 | 68013 | 363.93 | 685 | 677 | 185.0 |
| D | 8 | 240 | 384575 | 1962.0 | 688 | 656 | 195.7 |
| D | 3 | 224 | 205637 | 1047.55 | 688 | 656 | 195.7 |
| D | 12 | 191 | 71474 | 361.91 | 688 | 656 | 195.7 |
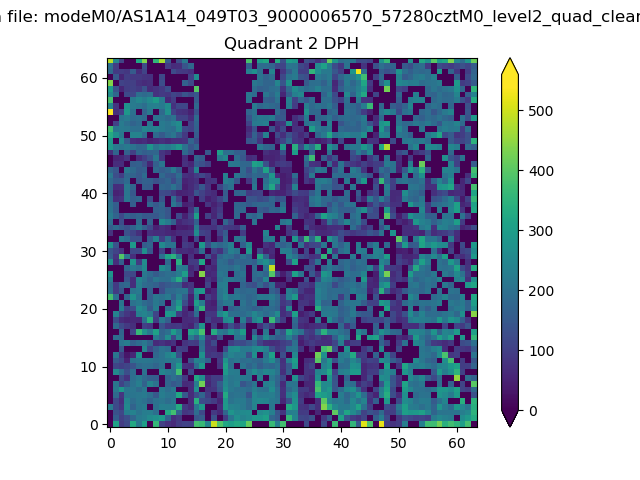
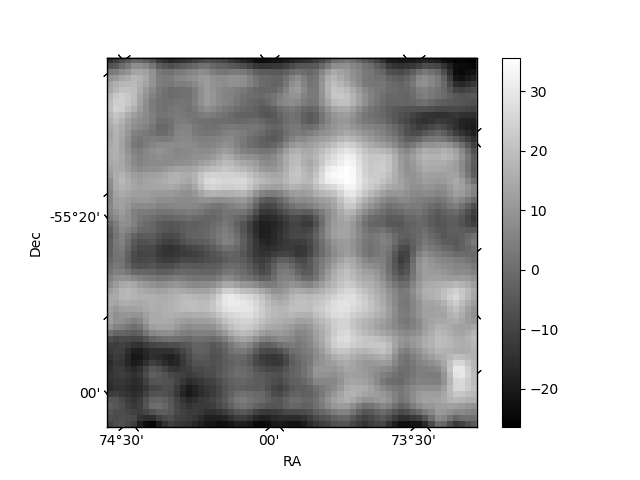
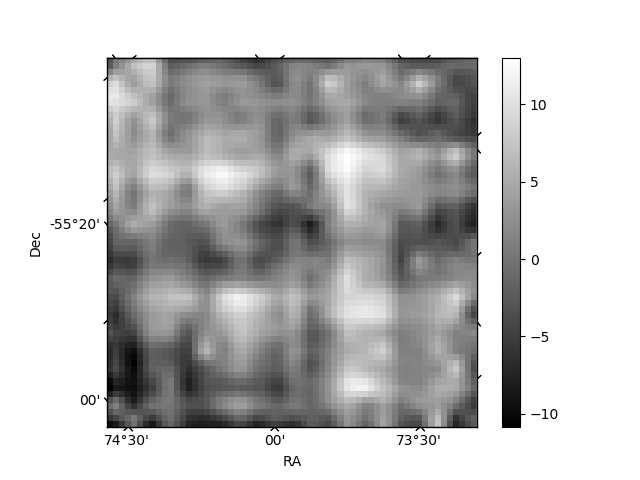
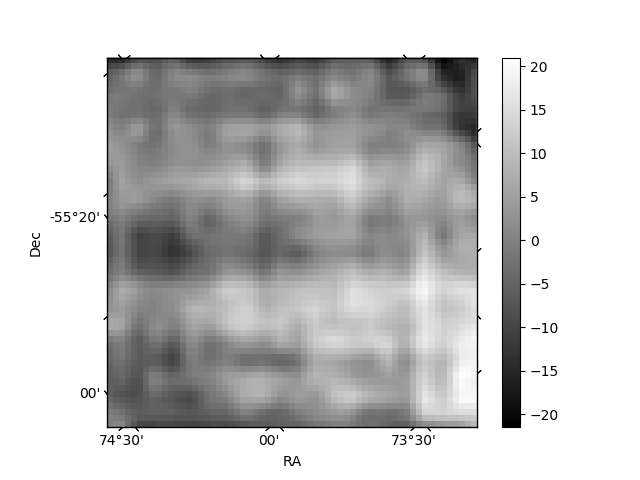
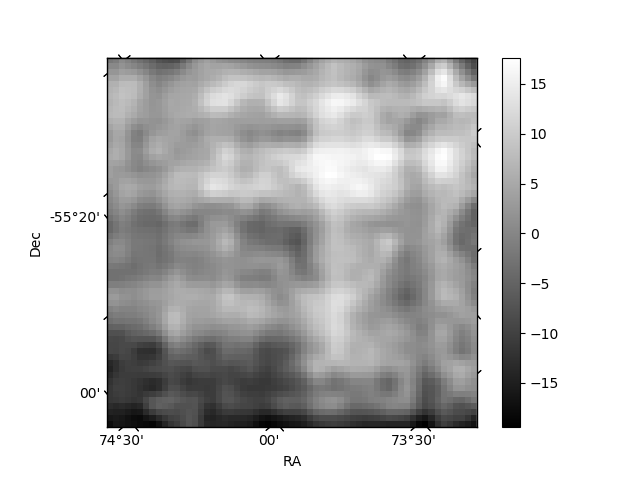
Histogram calculated using DETX and DETY for each event in the final _common_clean file
| Quadrant A | 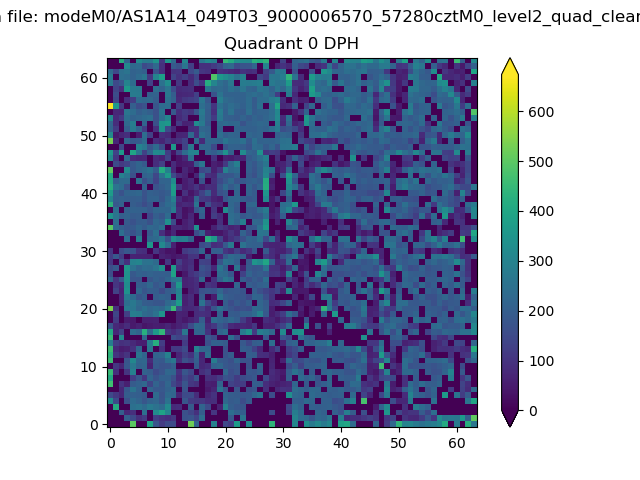 |
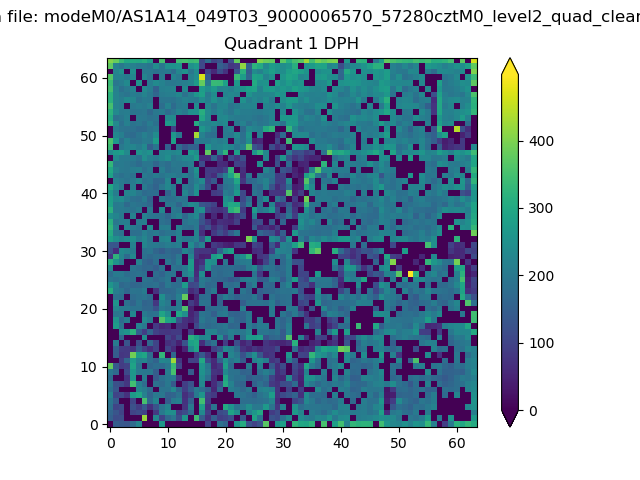 |
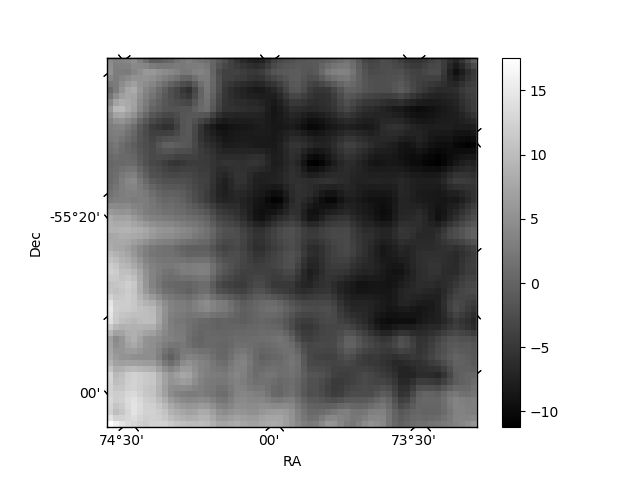
Quadrant B |
|---|---|---|---|
| Quadrant D | 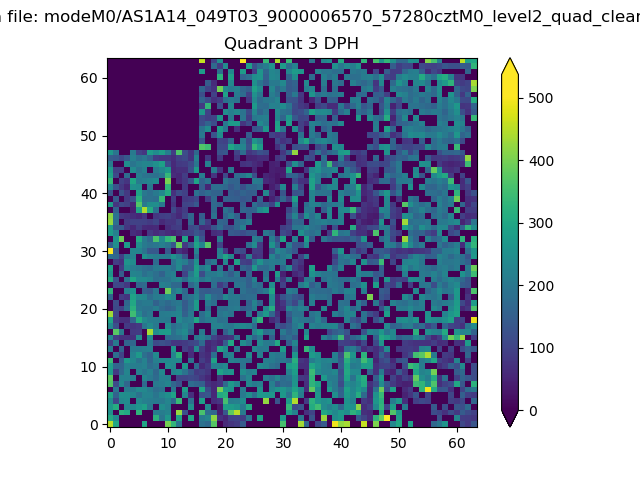 |
 |
Quadrant C |
| Plot type | Count rate plots | Images |
|---|---|---|
| Comparison with Poisson distribution Blue bars denote a histogram of data divided into 1 sec bins. Red curve is a Poisson curve with rate = median count rate of data. |
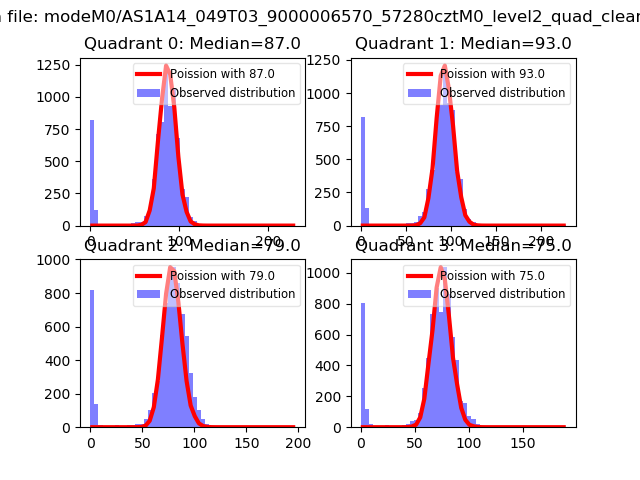 |
 |
| Quadrant-wise count rates Data is divided into 100 sec bins |
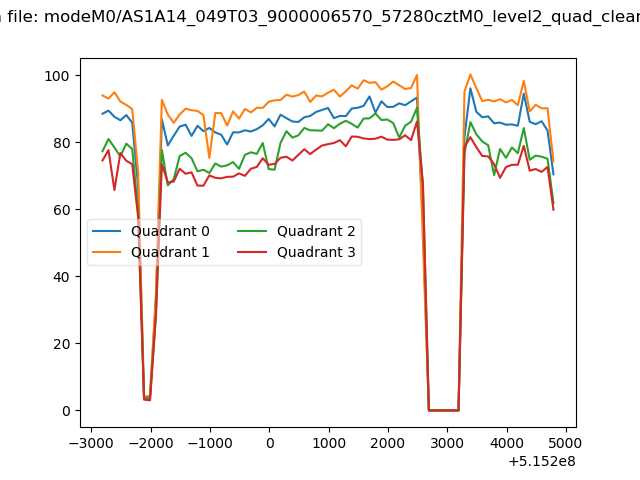 |
|
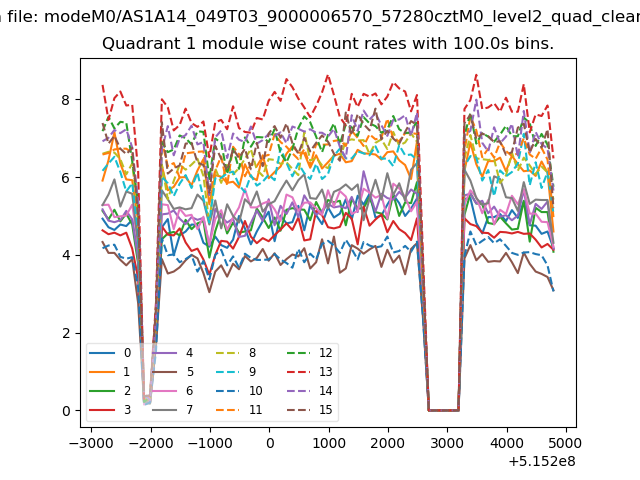
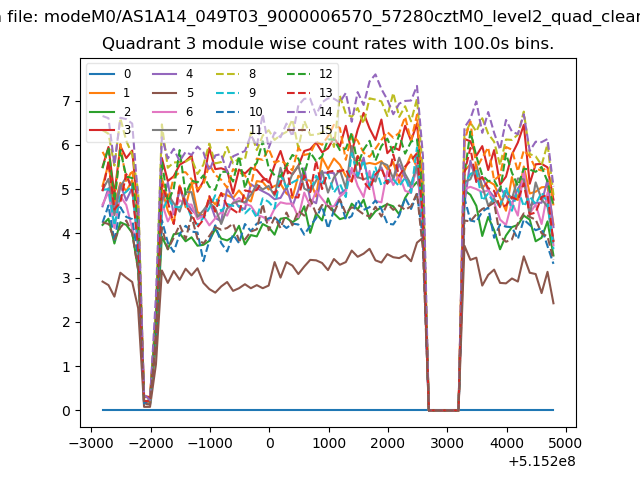
| Module-wise count rates for Quadrant A Data is divided into 100 sec bins |
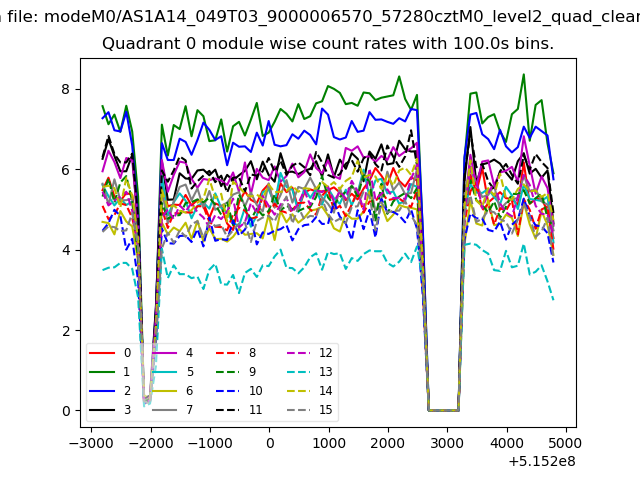 |
 |
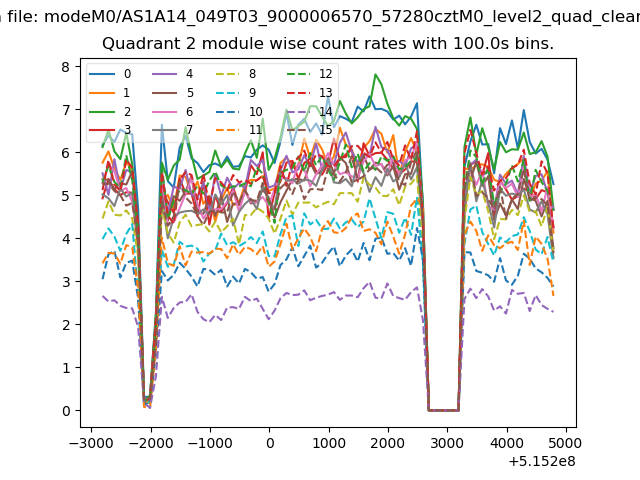
| Module-wise count rates for Quadrant B Data is divided into 100 sec bins |
 |
 |
| Module-wise count rates for Quadrant C Data is divided into 100 sec bins |
 |
 |
| Module-wise count rates for Quadrant D Data is divided into 100 sec bins |
 |
 |
| Parameter | Plot |
|---|---|
| CZT HV Monitor | 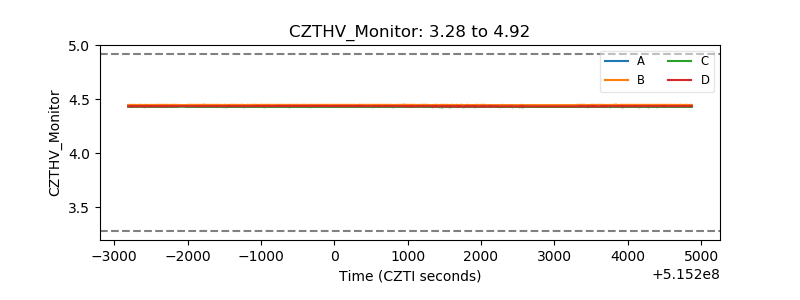 |
| D_VDD | 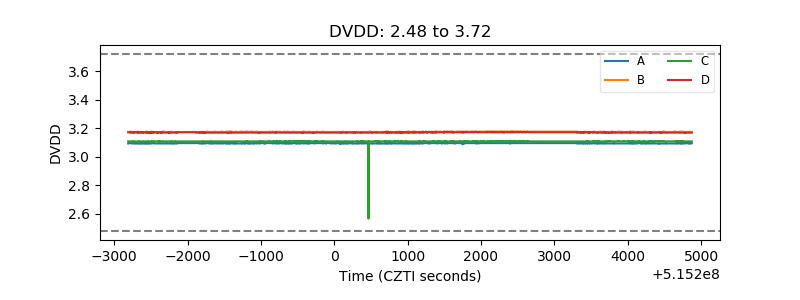 |
| Temperature 1 | 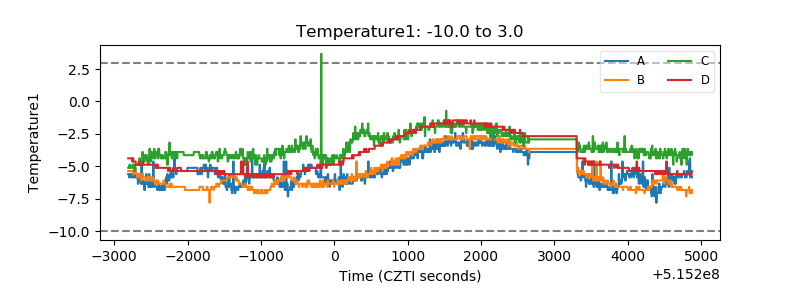 |
| Veto HV Monitor | 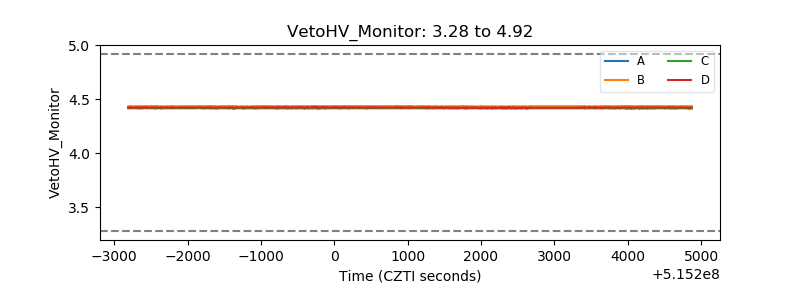 |
| Veto LLD | 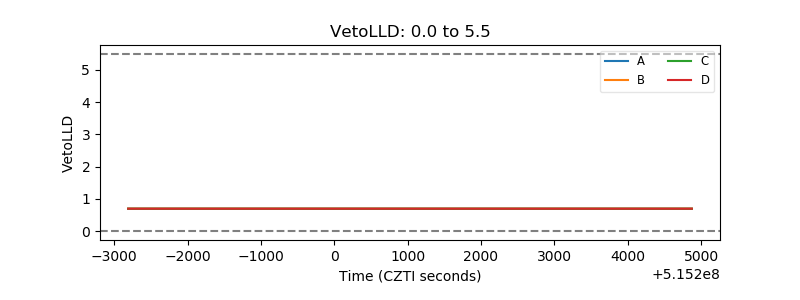 |
| Alpha Counter | 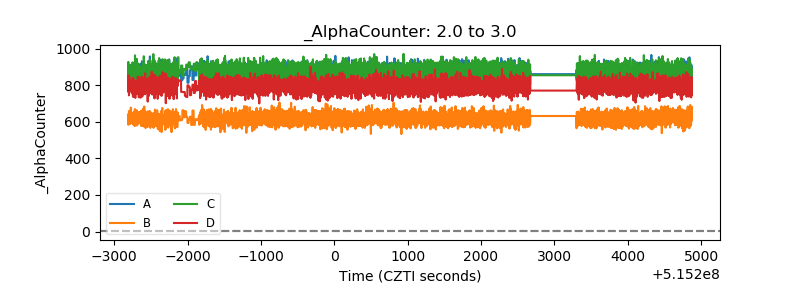 |
| _CPM_Rate | 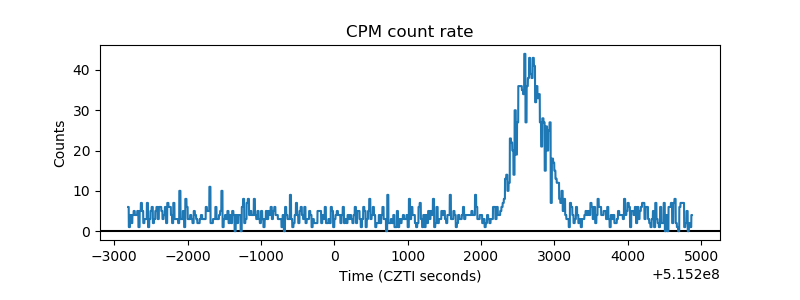 |
| CZT Counter | 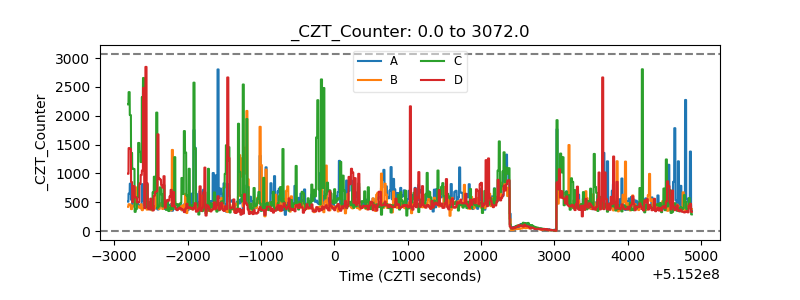 |
| +2.5 Volts monitor |  |
| +5 Volts monitor |  |
| _ROLL_ROT | 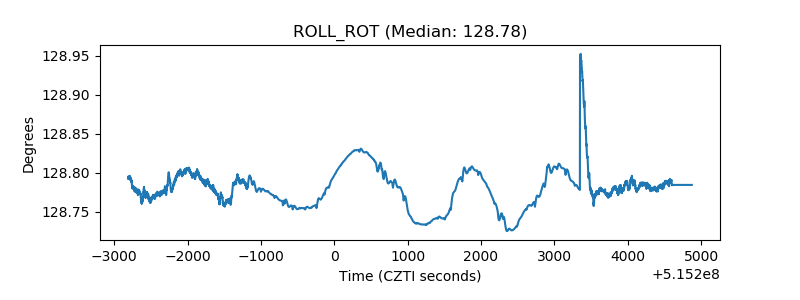 |
| _Roll_DEC | 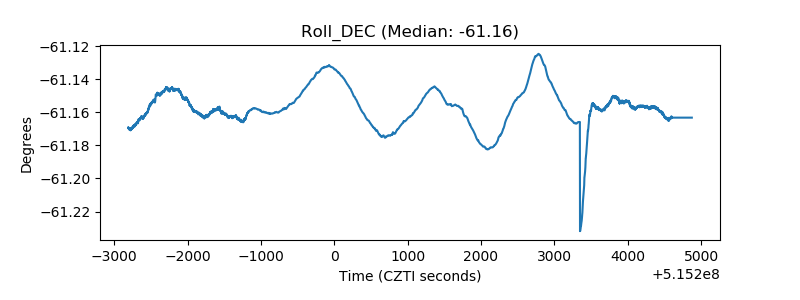 |
| _Roll_RA | 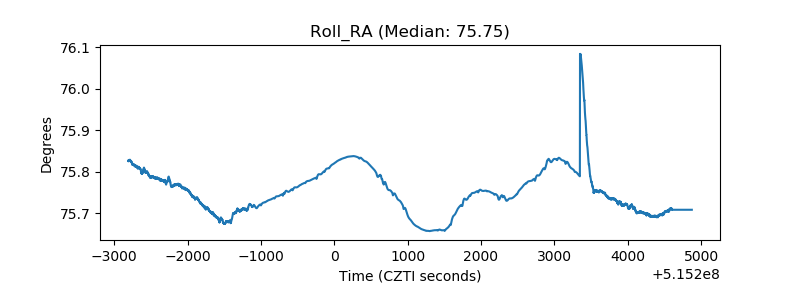 |
| Veto Counter | 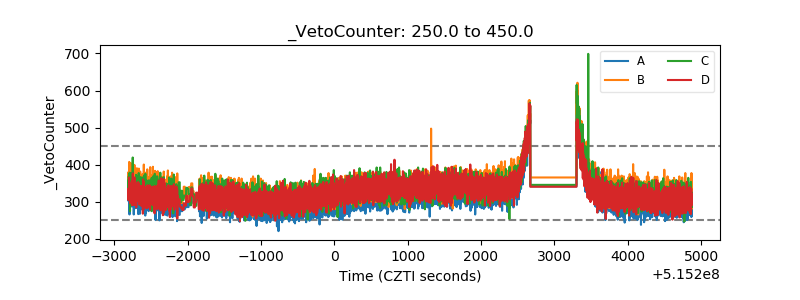 |