| Param | Original file | Final file |
|---|---|---|
| Filename | modeM0/AS1A14_049T03_9000006570_57282cztM0_level2.fits | modeM0/AS1A14_049T03_9000006570_57282cztM0_level2_quad_clean.evt |
| Size (bytes) | 1,023,733,440 | 198,216,000 |
| Size | 976.3 MB | 189.0 MB |
| Events in quadrant A | 8,837,068 | 1,266,126 |
| Events in quadrant B | 7,858,224 | 1,322,304 |
| Events in quadrant C | 11,732,234 | 1,147,888 |
| Events in quadrant D | 8,192,878 | 1,128,996 |
| Mode M0 | |||
|---|---|---|---|
| Quadrant | BADHDUFLAG | Total packets | Discarded packets |
| A | 0 | 37484 | 1 |
| B | 0 | 35313 | 1 |
| C | 0 | 46358 | 1 |
| D | 0 | 36413 | 1 |
| Mode M9 | |||
|---|---|---|---|
| Quadrant | BADHDUFLAG | Total packets | Discarded packets |
| A | 0 | 6 | 0 |
| B | 0 | 6 | 0 |
| C | 0 | 6 | 0 |
| D | 0 | 6 | 0 |
| Mode SS | |||
|---|---|---|---|
| Quadrant | BADHDUFLAG | Total packets | Discarded packets |
| A | 0 | 332 | 0 |
| B | 0 | 332 | 0 |
| C | 0 | 332 | 0 |
| D | 0 | 332 | 0 |
| Quadrant | Total seconds | Saturated seconds | Saturation percentage |
|---|---|---|---|
| A | 16460 | 113 | 0.686513% |
| B | 16461 | 185 | 1.123869% |
| C | 16461 | 924 | 5.613268% |
| D | 16461 | 166 | 1.008444% |
Noise dominated data is calculated using 1-second bins in cleaned event files. If a bin has >2000 counts, and if more than 50% of those come from <1% of pixels, then it is considered to be noise-dominated and hence unusable.
| Quadrant | # 1 sec bins | Bins with >0 counts | Bins with >2000 counts | High rate bins dominated by noise | Noise dominated (total time) | Noise dominated (detector-on time) | Marked lightcurve |
|---|---|---|---|---|---|---|---|
| A | 17365 | 16736 | 47 | 47 | 0.27% | 0.28% | 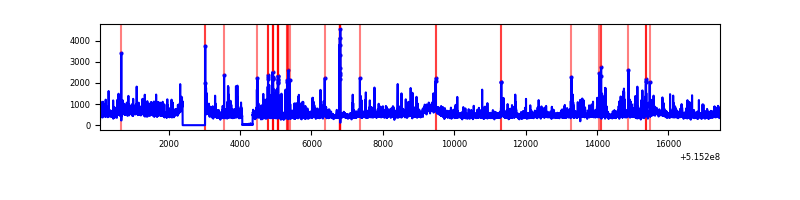 |
| B | 17366 | 16737 | 29 | 29 | 0.17% | 0.17% | 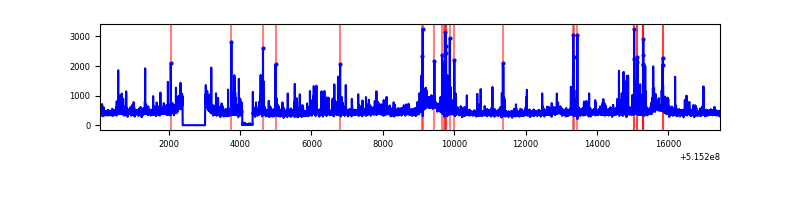 |
| C | 17366 | 16737 | 684 | 684 | 3.94% | 4.09% | 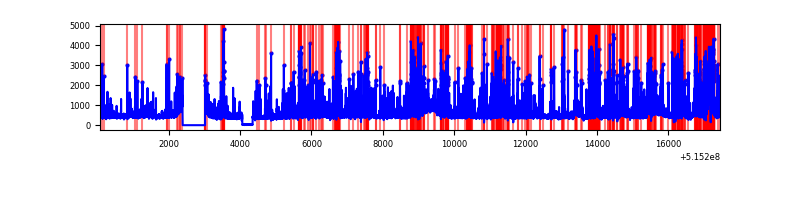 |
| D | 17366 | 16737 | 118 | 118 | 0.68% | 0.71% | 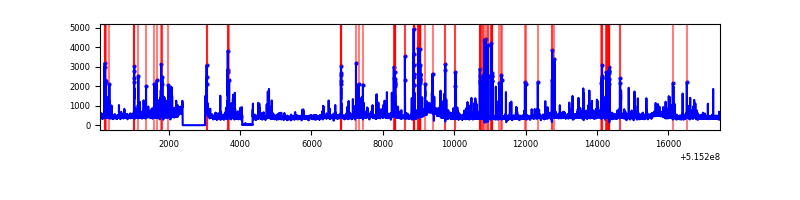 |
Top three noisy pixels from each quadrant. If the there are fewer than three noisy pixels in the level2.evt file, extra rows are filled as -1
| Pixel properties | Quadrant properties | ||||||
|---|---|---|---|---|---|---|---|
| Quadrant | DetID | PixID | Counts | Sigma | Mean | Median | Sigma |
| A | 8 | 4 | 923514 | 2112.34 | 1779 | 1729 | 436.4 |
| A | 3 | 14 | 723082 | 1653.04 | 1779 | 1729 | 436.4 |
| A | 3 | 95 | 124711 | 281.82 | 1779 | 1729 | 436.4 |
| B | 5 | 185 | 315927 | 833.6 | 1761 | 1691 | 377.0 |
| B | 0 | 199 | 145771 | 382.21 | 1761 | 1691 | 377.0 |
| B | 10 | 247 | 137709 | 360.83 | 1761 | 1691 | 377.0 |
| C | 15 | 224 | 3932706 | 8655.58 | 1687 | 1671 | 454.2 |
| C | 12 | 2 | 444655 | 975.39 | 1687 | 1671 | 454.2 |
| C | 12 | 252 | 165558 | 360.86 | 1687 | 1671 | 454.2 |
| D | 3 | 224 | 539921 | 1126.47 | 1716 | 1638 | 477.8 |
| D | 8 | 240 | 180514 | 374.34 | 1716 | 1638 | 477.8 |
| D | 5 | 173 | 133787 | 276.55 | 1716 | 1638 | 477.8 |
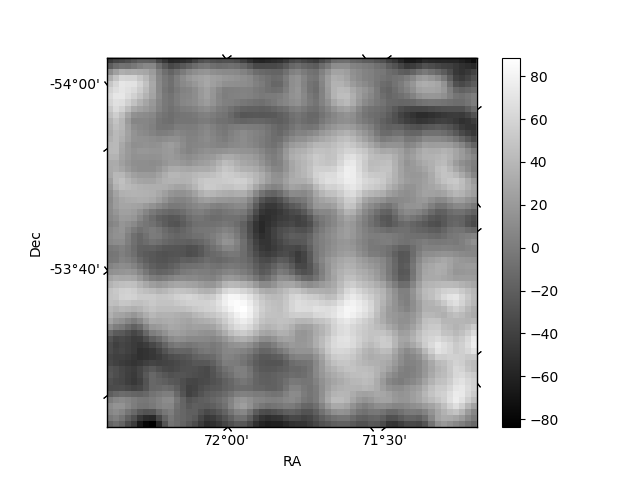
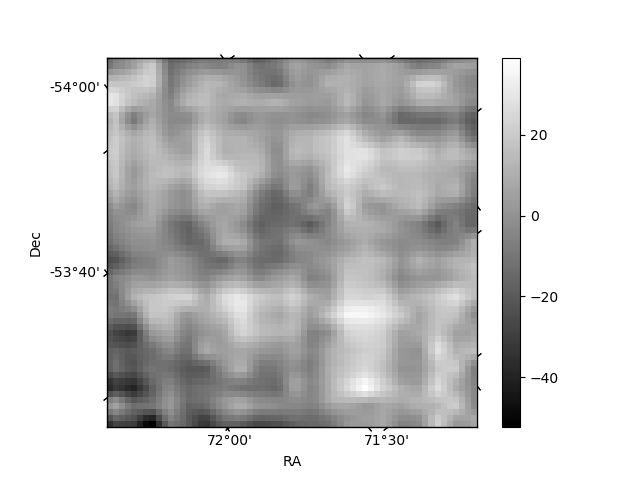
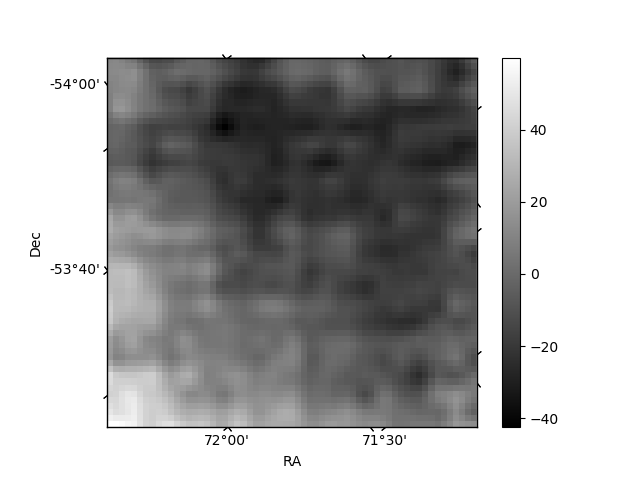
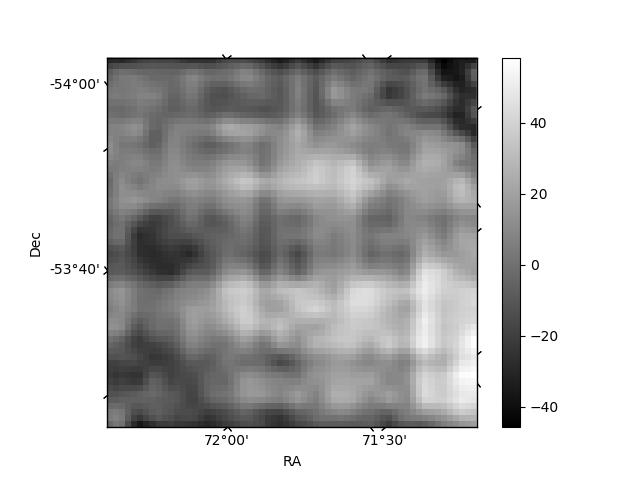
Histogram calculated using DETX and DETY for each event in the final _common_clean file
| Quadrant A | 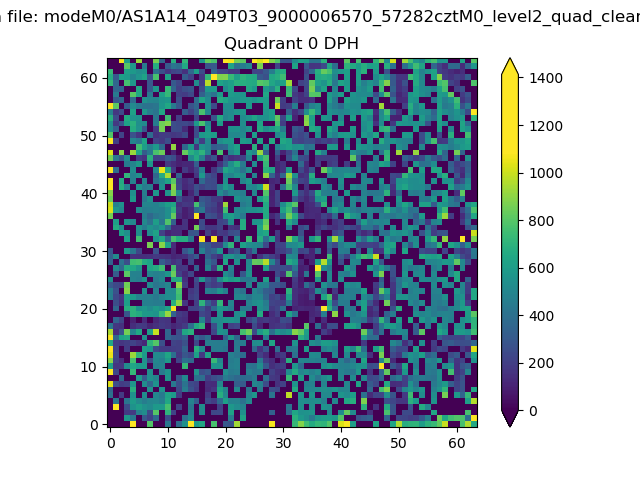 |
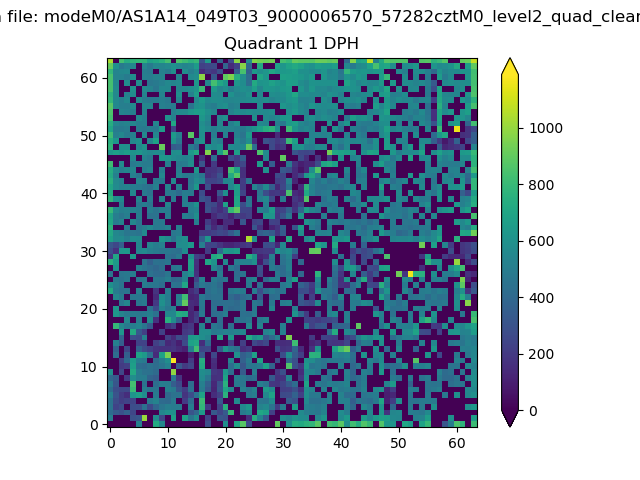 |
Quadrant B |
|---|---|---|---|
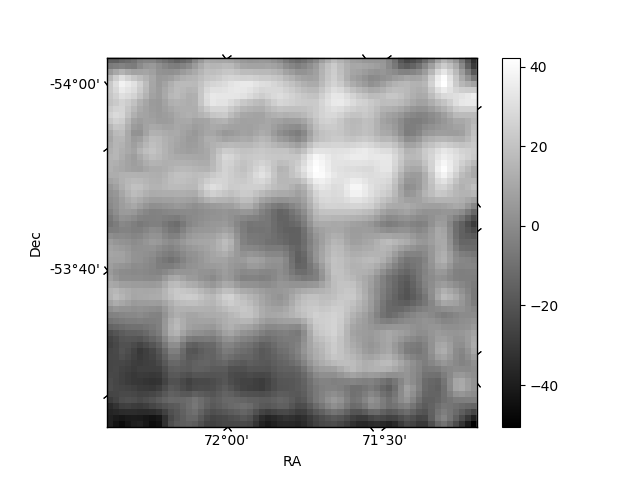
| Quadrant D | 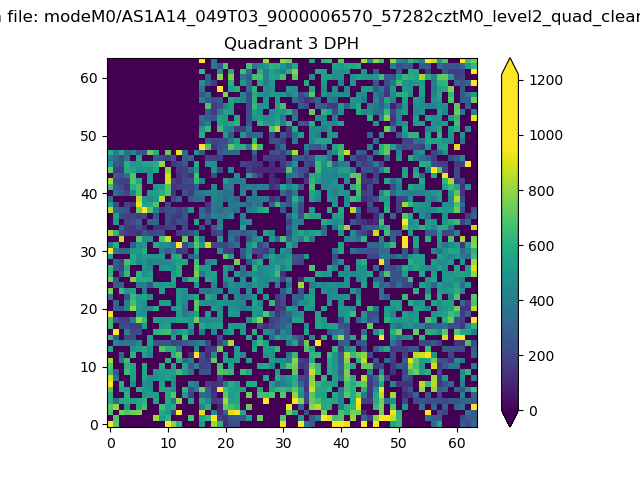 |
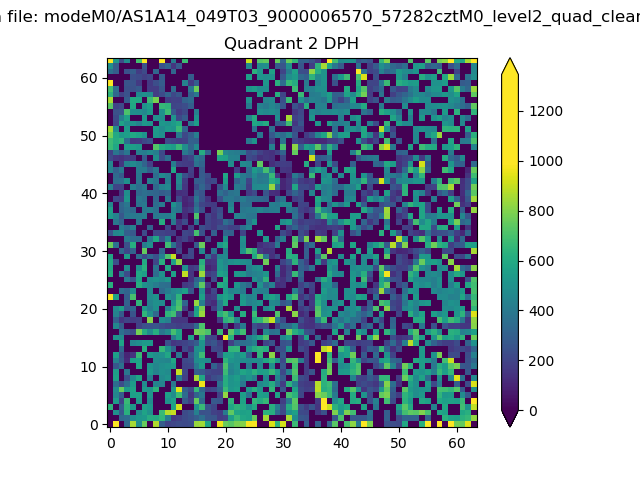 |
Quadrant C |
| Plot type | Count rate plots | Images |
|---|---|---|
| Comparison with Poisson distribution Blue bars denote a histogram of data divided into 1 sec bins. Red curve is a Poisson curve with rate = median count rate of data. |
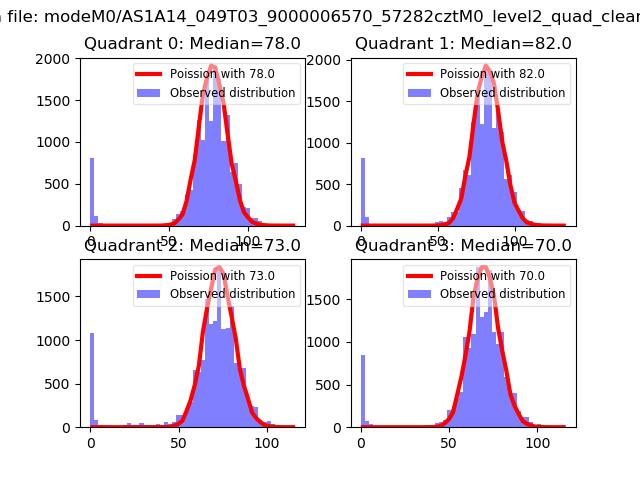 |
 |
| Quadrant-wise count rates Data is divided into 100 sec bins |
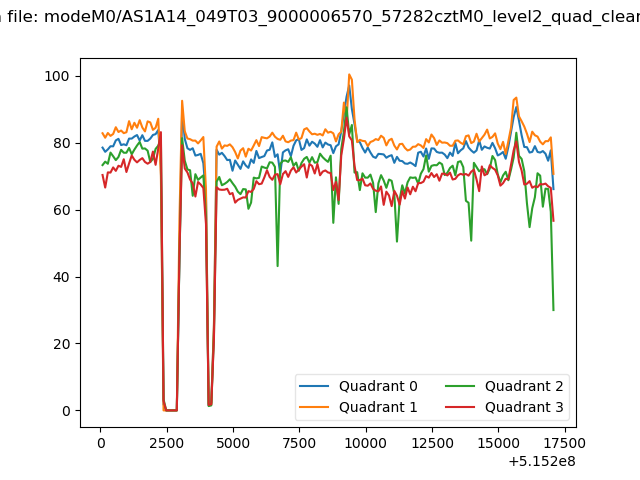 |
|
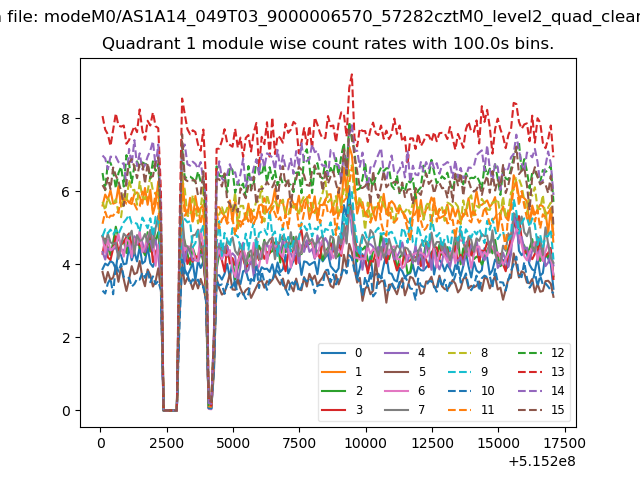
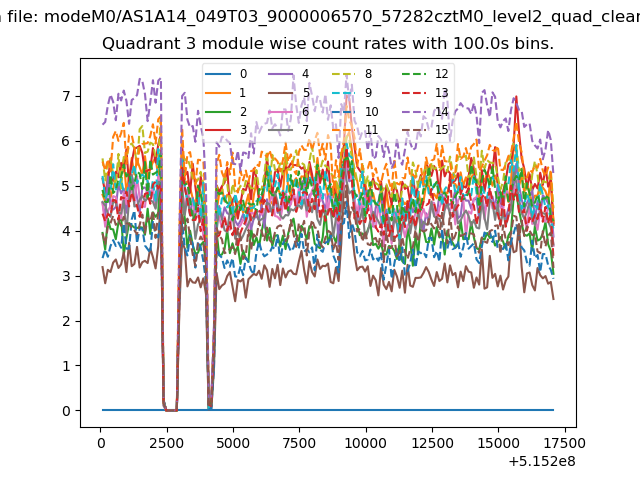
| Module-wise count rates for Quadrant A Data is divided into 100 sec bins |
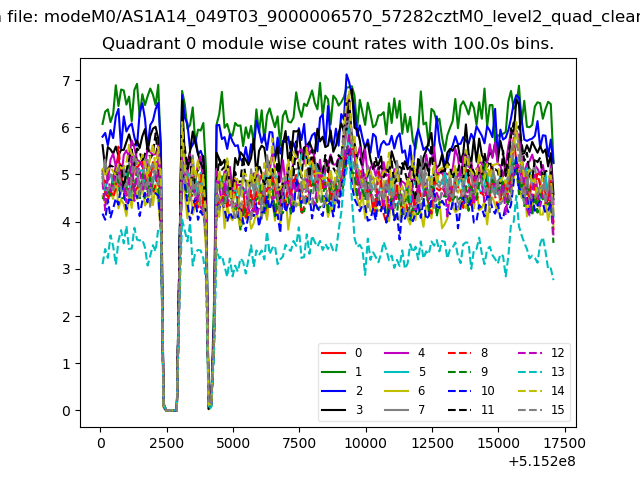 |
 |
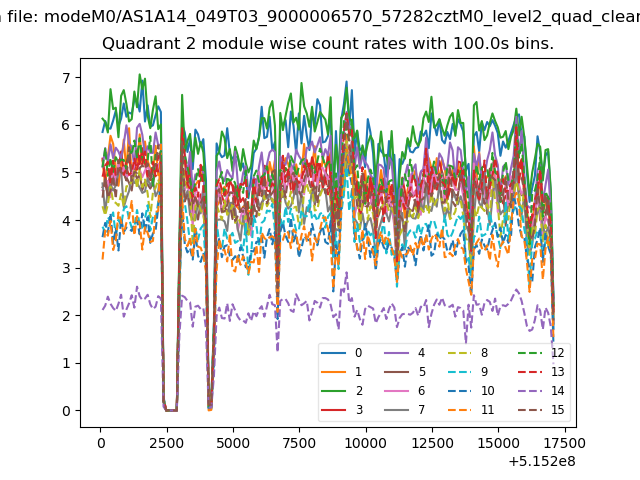
| Module-wise count rates for Quadrant B Data is divided into 100 sec bins |
 |
 |
| Module-wise count rates for Quadrant C Data is divided into 100 sec bins |
 |
 |
| Module-wise count rates for Quadrant D Data is divided into 100 sec bins |
 |
 |
| Parameter | Plot |
|---|---|
| CZT HV Monitor | 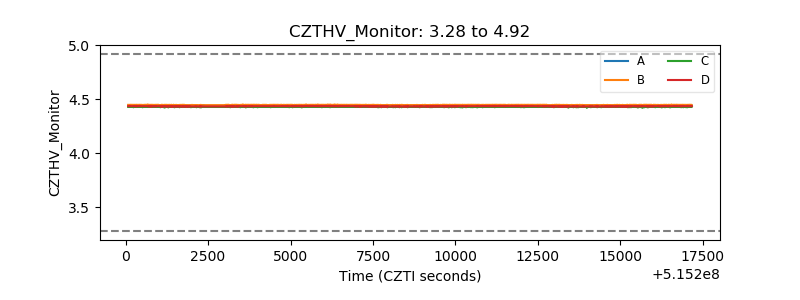 |
| D_VDD | 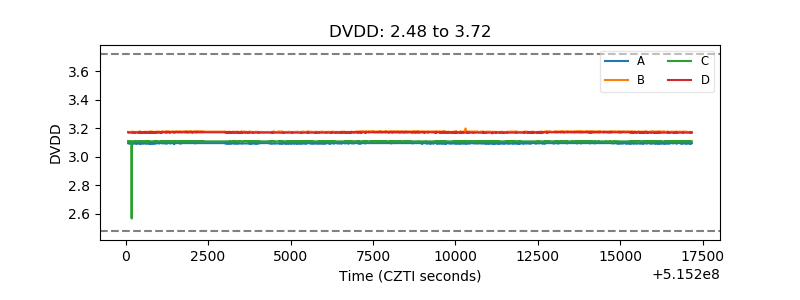 |
| Temperature 1 | 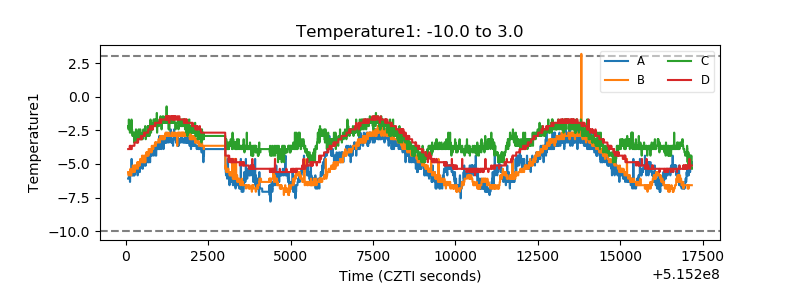 |
| Veto HV Monitor | 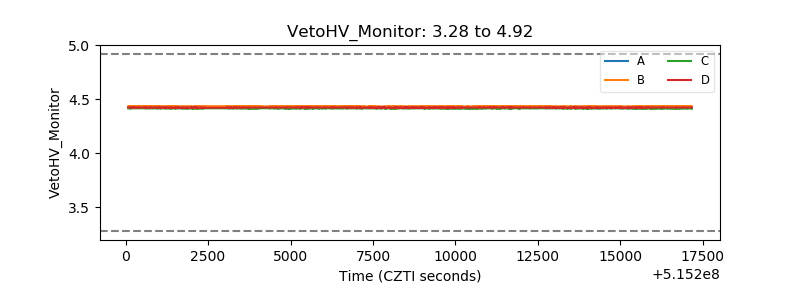 |
| Veto LLD | 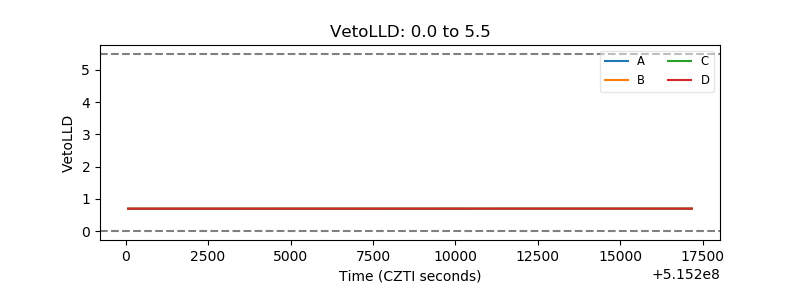 |
| Alpha Counter | 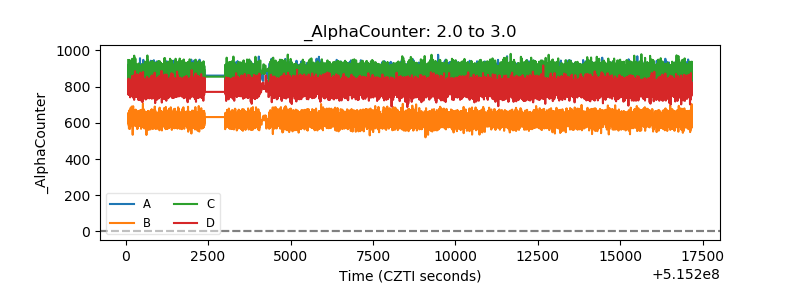 |
| _CPM_Rate | 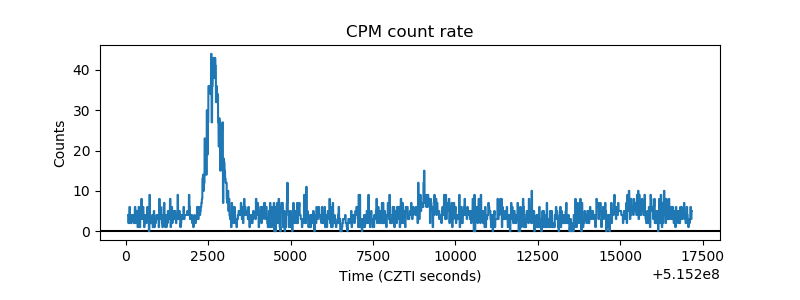 |
| CZT Counter | 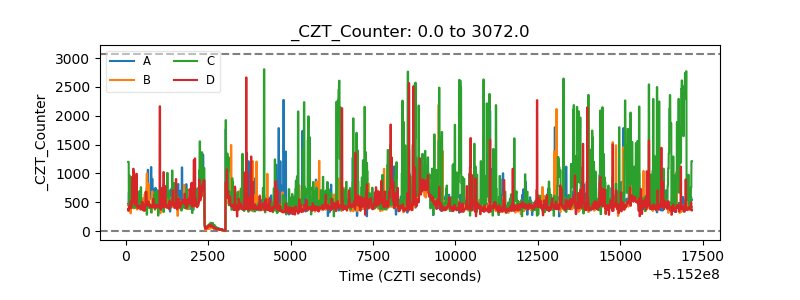 |
| +2.5 Volts monitor |  |
| +5 Volts monitor |  |
| _ROLL_ROT | 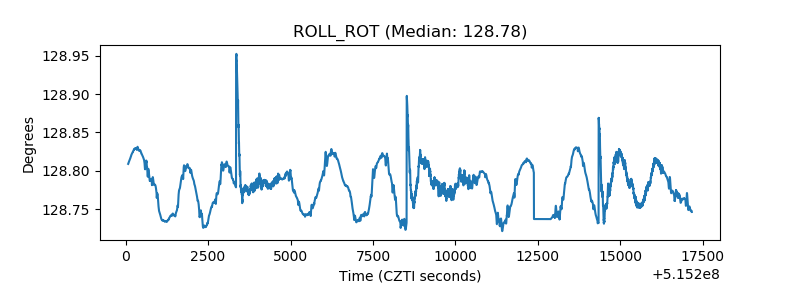 |
| _Roll_DEC | 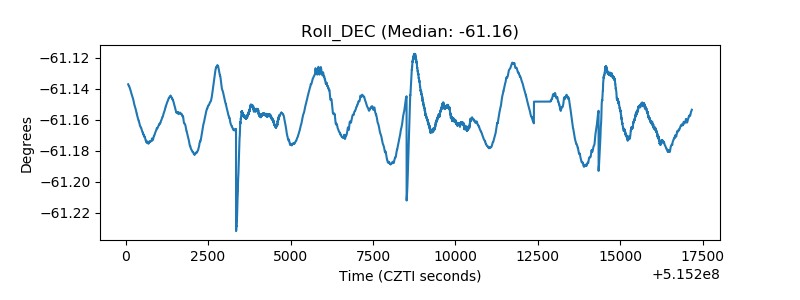 |
| _Roll_RA | 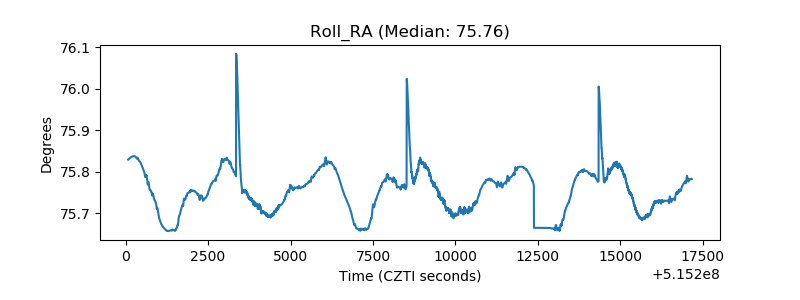 |
| Veto Counter | 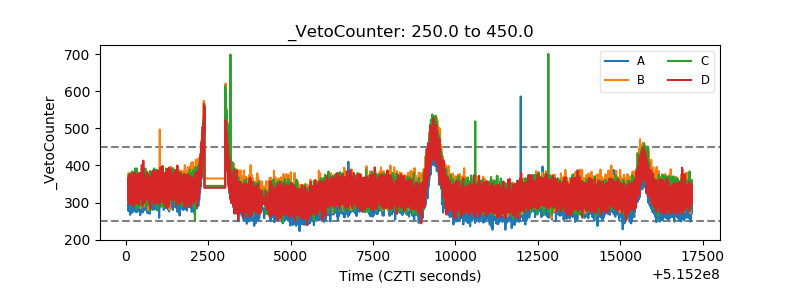 |