| Param | Original file | Final file |
|---|---|---|
| Filename | modeM0/AS1A14_049T03_9000006570_57283cztM0_level2.fits | modeM0/AS1A14_049T03_9000006570_57283cztM0_level2_quad_clean.evt |
| Size (bytes) | 513,383,040 | 110,692,800 |
| Size | 489.6 MB | 105.6 MB |
| Events in quadrant A | 3,820,105 | 734,967 |
| Events in quadrant B | 3,710,218 | 790,921 |
| Events in quadrant C | 6,631,657 | 642,381 |
| Events in quadrant D | 4,233,897 | 638,913 |
| Mode M0 | |||
|---|---|---|---|
| Quadrant | BADHDUFLAG | Total packets | Discarded packets |
| A | 0 | 16773 | 0 |
| B | 0 | 16755 | 0 |
| C | 0 | 25108 | 0 |
| D | 0 | 18439 | 0 |
| Mode SS | |||
|---|---|---|---|
| Quadrant | BADHDUFLAG | Total packets | Discarded packets |
| A | 0 | 158 | 0 |
| B | 0 | 158 | 0 |
| C | 0 | 158 | 0 |
| D | 0 | 158 | 0 |
| Quadrant | Total seconds | Saturated seconds | Saturation percentage |
|---|---|---|---|
| A | 7823 | 34 | 0.434616% |
| B | 7824 | 90 | 1.150307% |
| C | 7824 | 788 | 10.071575% |
| D | 7824 | 238 | 3.041922% |
Noise dominated data is calculated using 1-second bins in cleaned event files. If a bin has >2000 counts, and if more than 50% of those come from <1% of pixels, then it is considered to be noise-dominated and hence unusable.
| Quadrant | # 1 sec bins | Bins with >0 counts | Bins with >2000 counts | High rate bins dominated by noise | Noise dominated (total time) | Noise dominated (detector-on time) | Marked lightcurve |
|---|---|---|---|---|---|---|---|
| A | 7823 | 7823 | 18 | 18 | 0.23% | 0.23% | 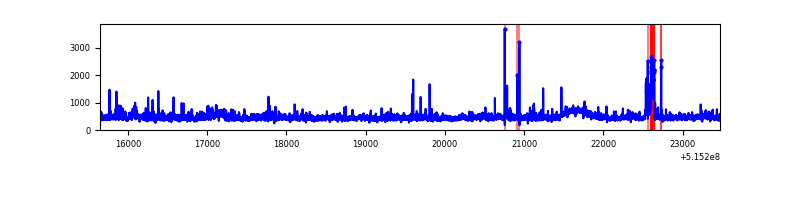 |
| B | 7824 | 7824 | 18 | 18 | 0.23% | 0.23% | 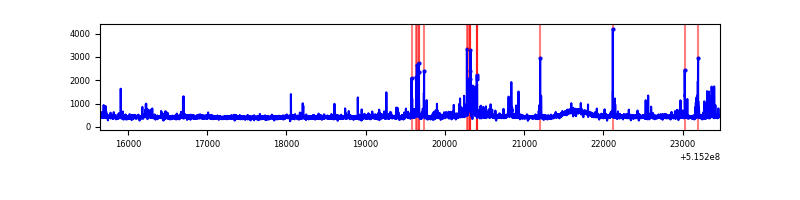 |
| C | 7824 | 7824 | 535 | 535 | 6.84% | 6.84% | 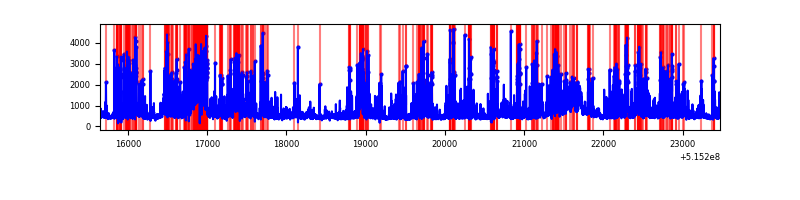 |
| D | 7824 | 7824 | 168 | 168 | 2.15% | 2.15% | 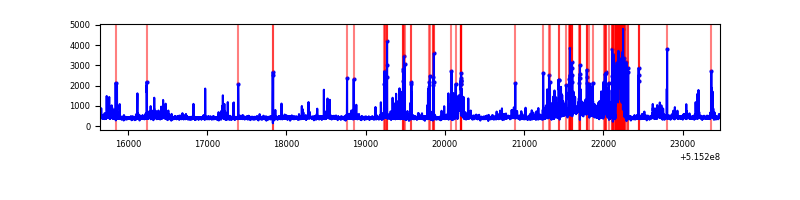 |
Top three noisy pixels from each quadrant. If the there are fewer than three noisy pixels in the level2.evt file, extra rows are filled as -1
| Pixel properties | Quadrant properties | ||||||
|---|---|---|---|---|---|---|---|
| Quadrant | DetID | PixID | Counts | Sigma | Mean | Median | Sigma |
| A | 8 | 4 | 345213 | 1668.93 | 834 | 812 | 206.4 |
| A | 7 | 64 | 131551 | 633.55 | 834 | 812 | 206.4 |
| A | 3 | 14 | 71530 | 342.69 | 834 | 812 | 206.4 |
| B | 5 | 185 | 110512 | 615.61 | 827 | 796 | 178.2 |
| B | 0 | 199 | 86443 | 480.56 | 827 | 796 | 178.2 |
| B | 7 | 252 | 72501 | 402.33 | 827 | 796 | 178.2 |
| C | 15 | 224 | 2631111 | 12420.32 | 782 | 775 | 211.8 |
| C | 12 | 2 | 493145 | 2324.95 | 782 | 775 | 211.8 |
| C | 6 | 223 | 104828 | 491.33 | 782 | 775 | 211.8 |
| D | 3 | 224 | 732148 | 3297.98 | 795 | 759 | 221.8 |
| D | 2 | 249 | 68181 | 304.02 | 795 | 759 | 221.8 |
| D | 5 | 173 | 67197 | 299.58 | 795 | 759 | 221.8 |
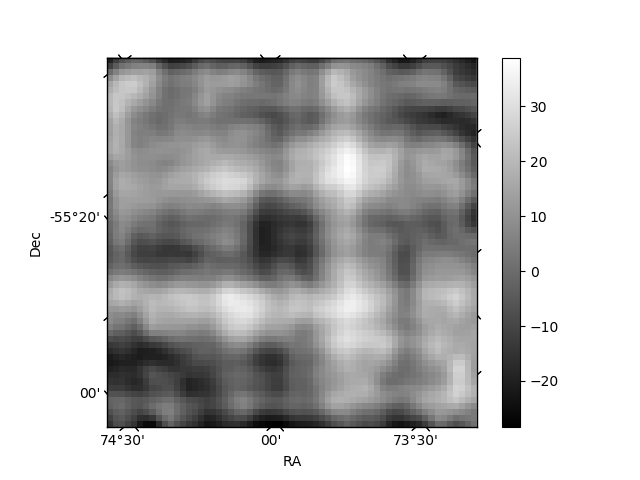
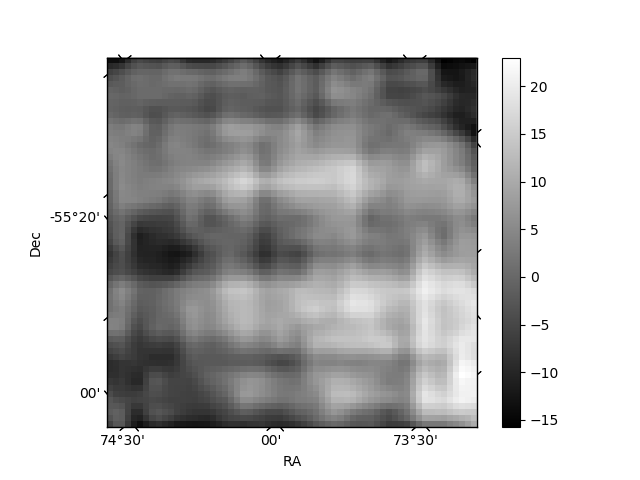
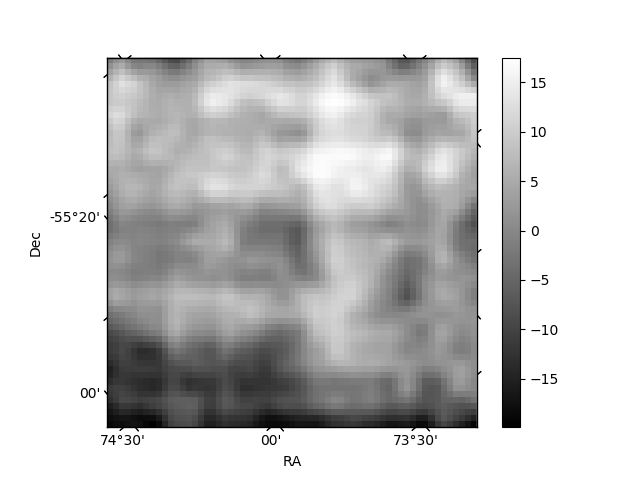
Histogram calculated using DETX and DETY for each event in the final _common_clean file
| Quadrant A | 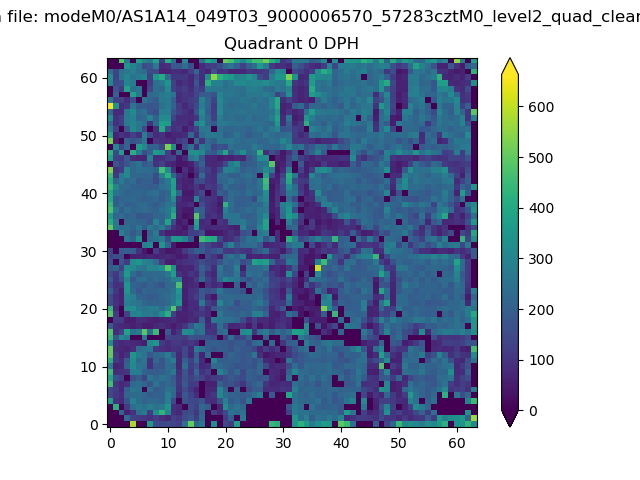 |
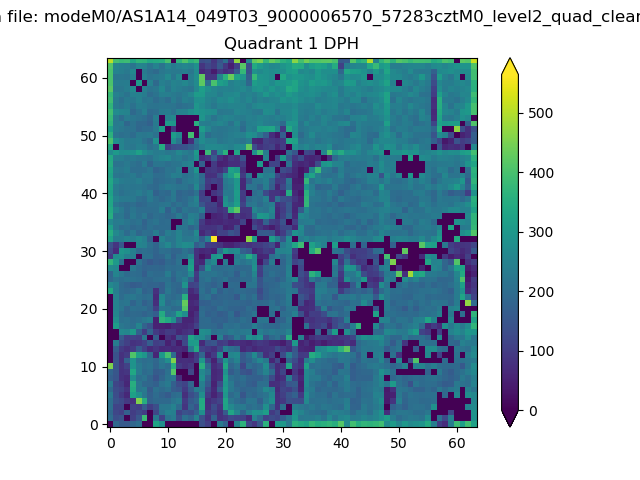 |
Quadrant B |
|---|---|---|---|
| Quadrant D | 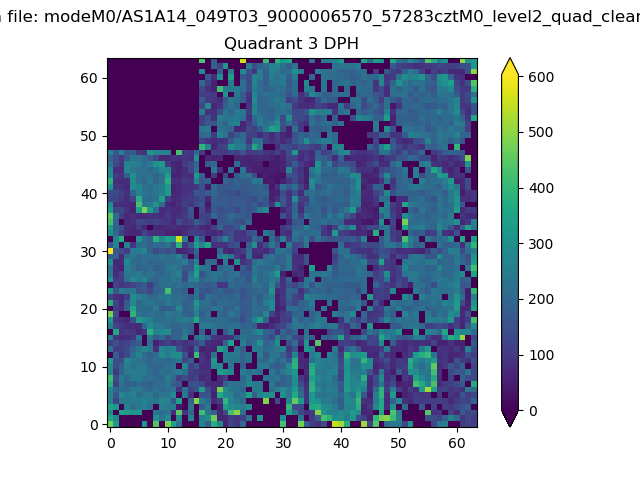 |
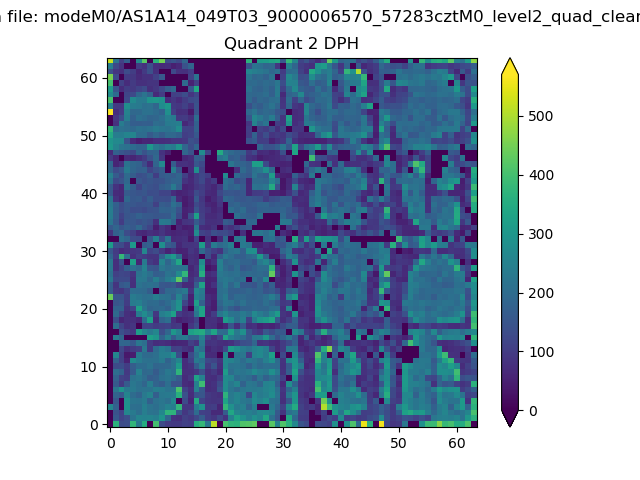 |
Quadrant C |
| Plot type | Count rate plots | Images |
|---|---|---|
| Comparison with Poisson distribution Blue bars denote a histogram of data divided into 1 sec bins. Red curve is a Poisson curve with rate = median count rate of data. |
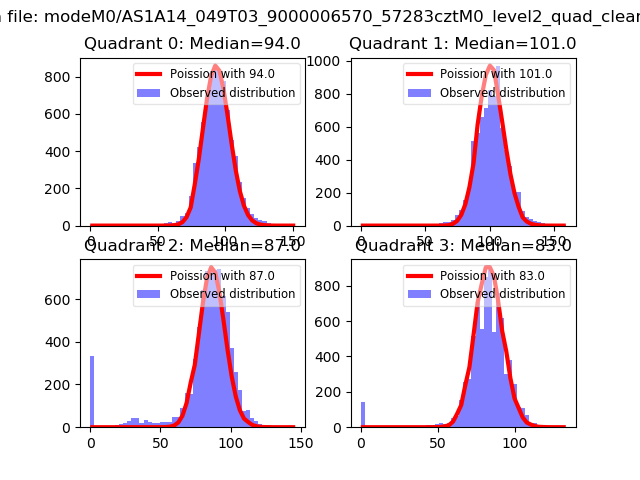 |
 |
| Quadrant-wise count rates Data is divided into 100 sec bins |
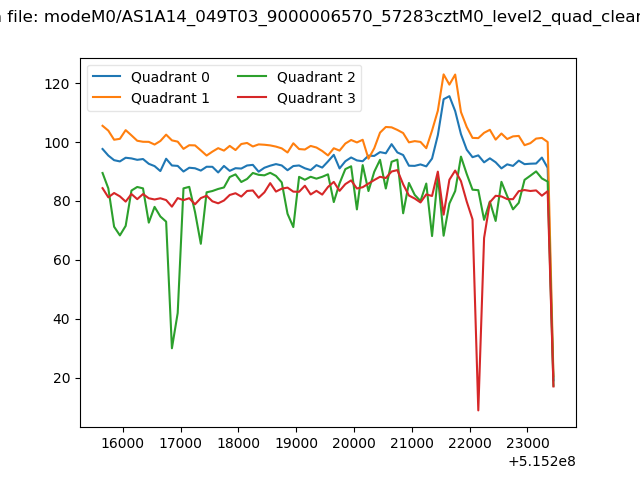 |
|
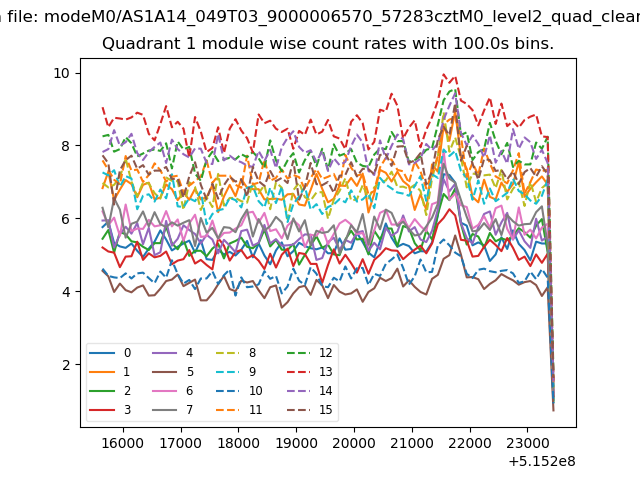
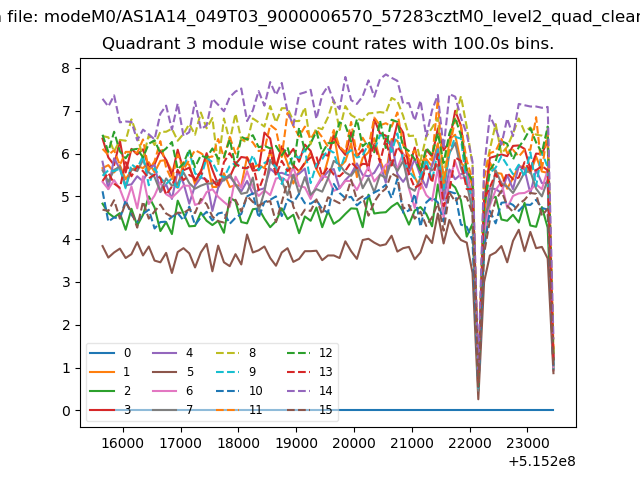
| Module-wise count rates for Quadrant A Data is divided into 100 sec bins |
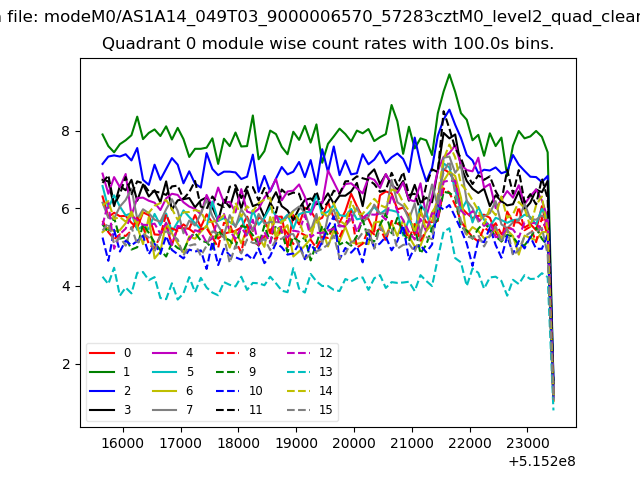 |
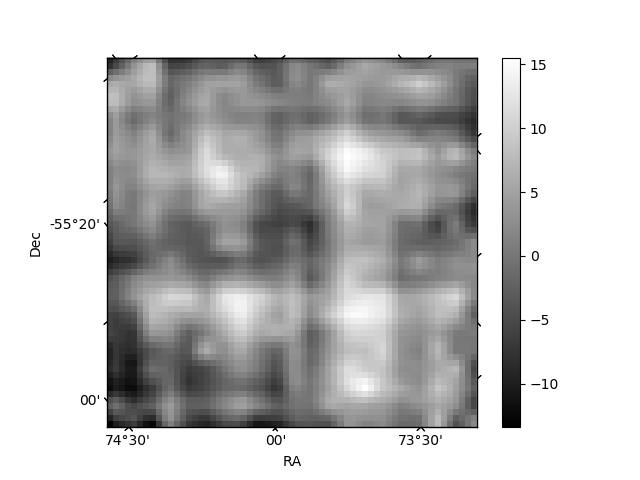 |
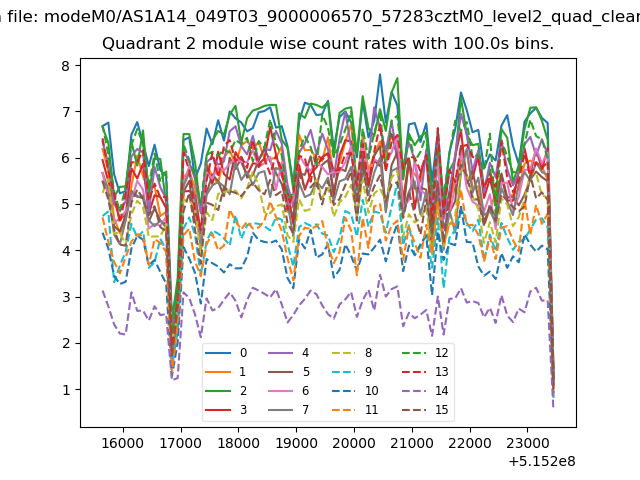
| Module-wise count rates for Quadrant B Data is divided into 100 sec bins |
 |
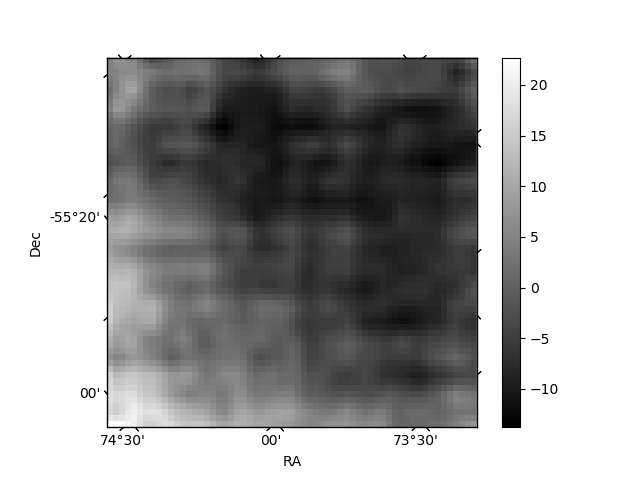 |
| Module-wise count rates for Quadrant C Data is divided into 100 sec bins |
 |
 |
| Module-wise count rates for Quadrant D Data is divided into 100 sec bins |
 |
 |
| Parameter | Plot |
|---|---|
| CZT HV Monitor | 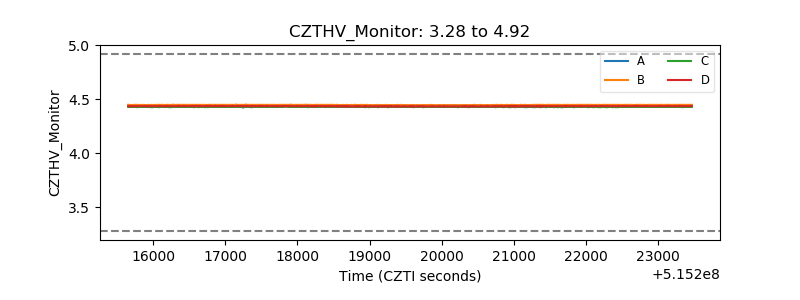 |
| D_VDD | 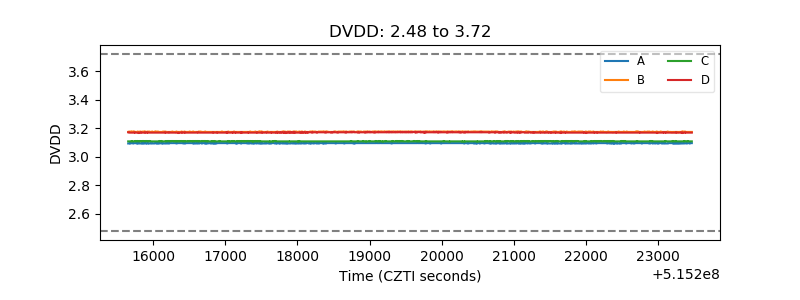 |
| Temperature 1 | 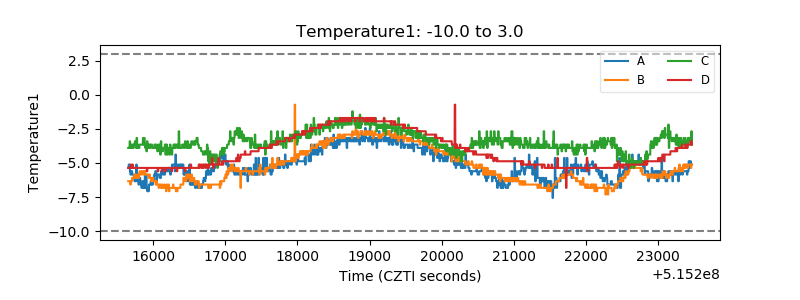 |
| Veto HV Monitor | 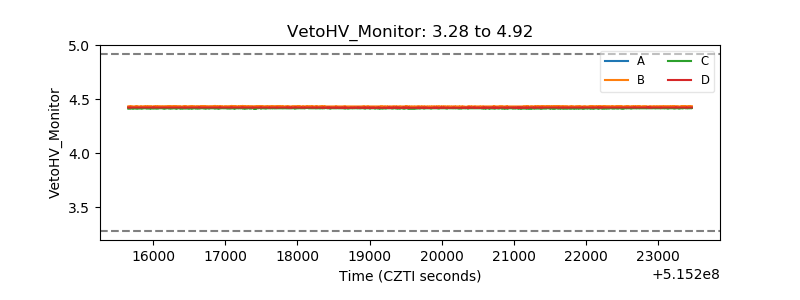 |
| Veto LLD | 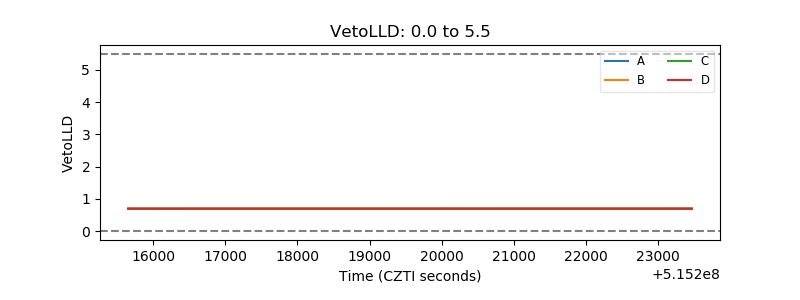 |
| Alpha Counter | 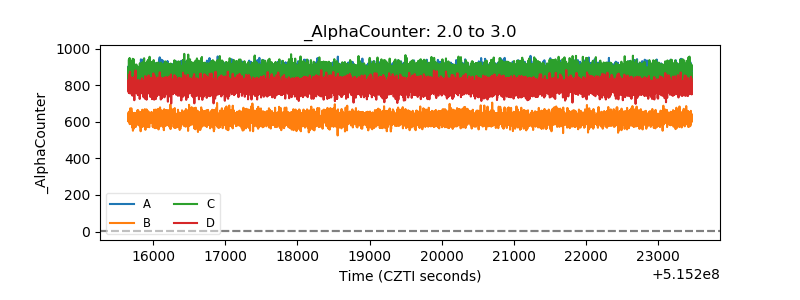 |
| _CPM_Rate | 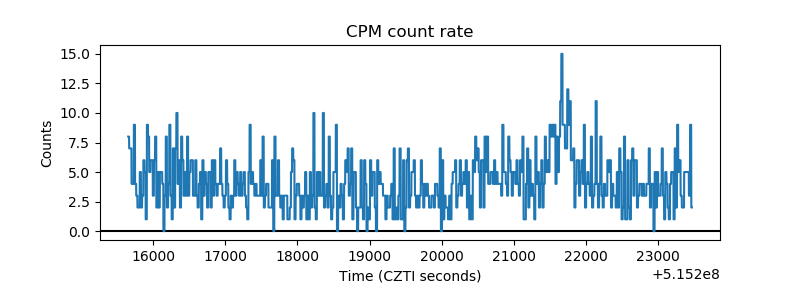 |
| CZT Counter | 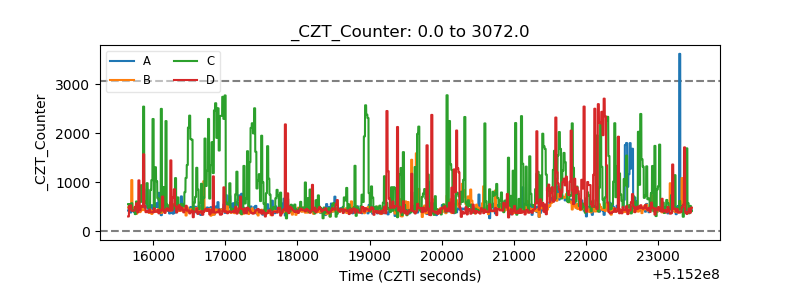 |
| +2.5 Volts monitor |  |
| +5 Volts monitor |  |
| _ROLL_ROT | 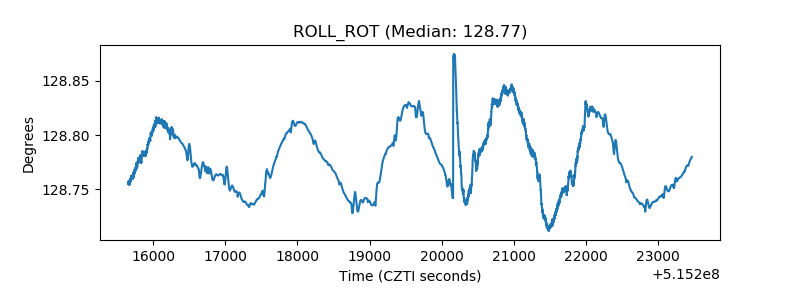 |
| _Roll_DEC | 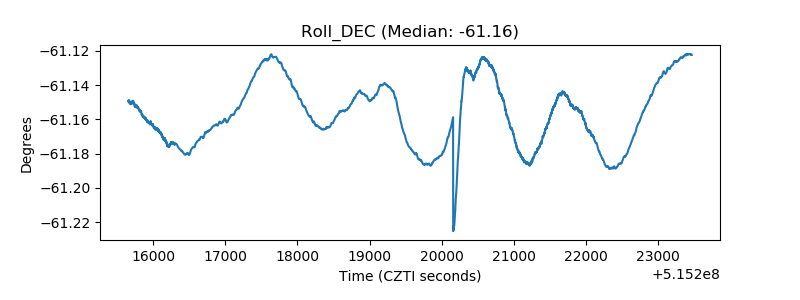 |
| _Roll_RA | 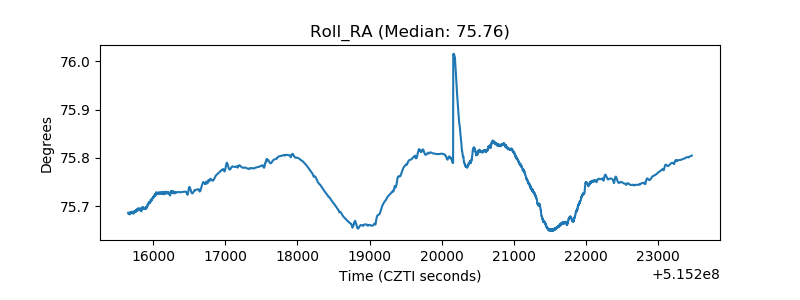 |
| Veto Counter | 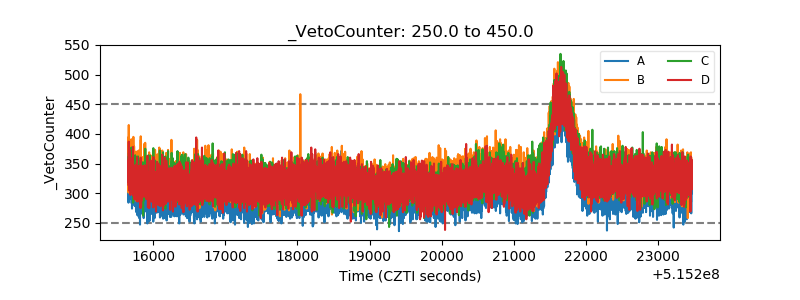 |