| Param | Original file | Final file |
|---|---|---|
| Filename | modeM0/AS1A14_049T03_9000006570_57286cztM0_level2.fits | modeM0/AS1A14_049T03_9000006570_57286cztM0_level2_quad_clean.evt |
| Size (bytes) | 1,270,702,080 | 254,050,560 |
| Size | 1.2 GB | 242.3 MB |
| Events in quadrant A | 8,709,103 | 1,700,054 |
| Events in quadrant B | 9,389,633 | 1,805,673 |
| Events in quadrant C | 14,847,612 | 1,531,165 |
| Events in quadrant D | 12,655,318 | 1,377,638 |
| Mode M0 | |||
|---|---|---|---|
| Quadrant | BADHDUFLAG | Total packets | Discarded packets |
| A | 0 | 38803 | 5 |
| B | 0 | 41131 | 4 |
| C | 0 | 56898 | 4 |
| D | 0 | 50869 | 4 |
| Mode M9 | |||
|---|---|---|---|
| Quadrant | BADHDUFLAG | Total packets | Discarded packets |
| A | 0 | 14 | 0 |
| B | 0 | 14 | 0 |
| C | 0 | 14 | 0 |
| D | 0 | 14 | 0 |
| Mode SS | |||
|---|---|---|---|
| Quadrant | BADHDUFLAG | Total packets | Discarded packets |
| A | 0 | 376 | 0 |
| B | 0 | 376 | 0 |
| C | 0 | 376 | 0 |
| D | 0 | 376 | 0 |
| Quadrant | Total seconds | Saturated seconds | Saturation percentage |
|---|---|---|---|
| A | 18533 | 331 | 1.786003% |
| B | 18534 | 624 | 3.366785% |
| C | 18534 | 1589 | 8.573433% |
| D | 18534 | 1827 | 9.857559% |
Noise dominated data is calculated using 1-second bins in cleaned event files. If a bin has >2000 counts, and if more than 50% of those come from <1% of pixels, then it is considered to be noise-dominated and hence unusable.
| Quadrant | # 1 sec bins | Bins with >0 counts | Bins with >2000 counts | High rate bins dominated by noise | Noise dominated (total time) | Noise dominated (detector-on time) | Marked lightcurve |
|---|---|---|---|---|---|---|---|
| A | 19943 | 18537 | 27 | 27 | 0.14% | 0.15% | 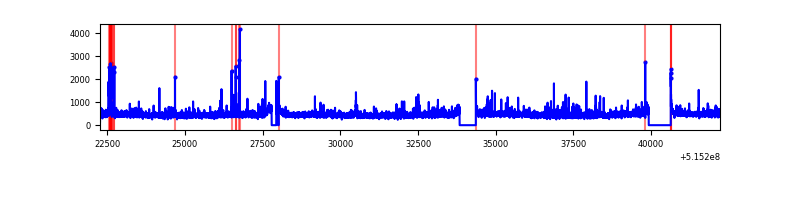 |
| B | 19944 | 18538 | 176 | 176 | 0.88% | 0.95% | 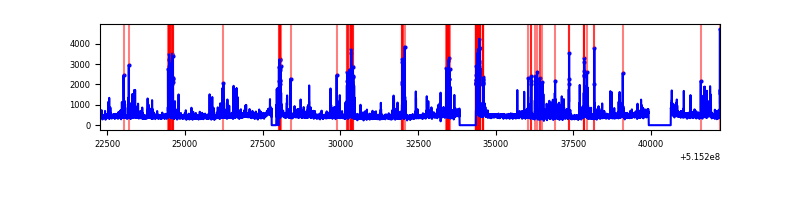 |
| C | 19944 | 18538 | 1082 | 1082 | 5.43% | 5.84% | 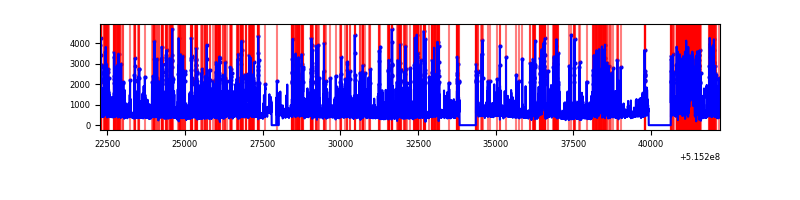 |
| D | 19944 | 18538 | 1214 | 1214 | 6.09% | 6.55% | 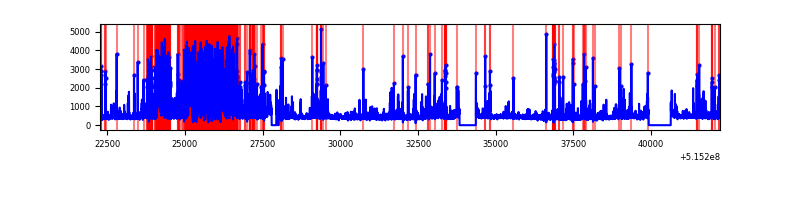 |
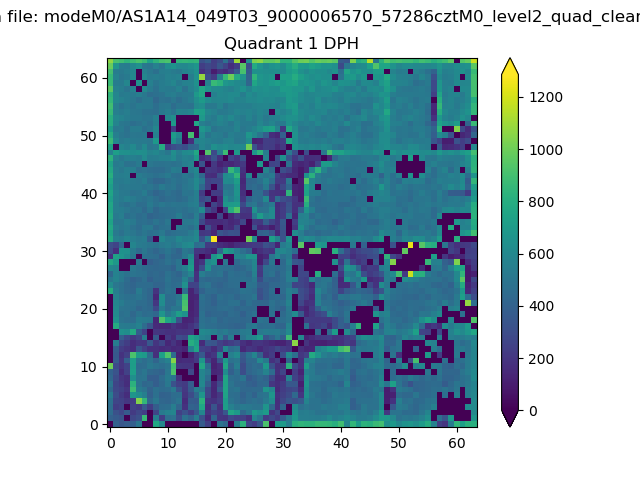
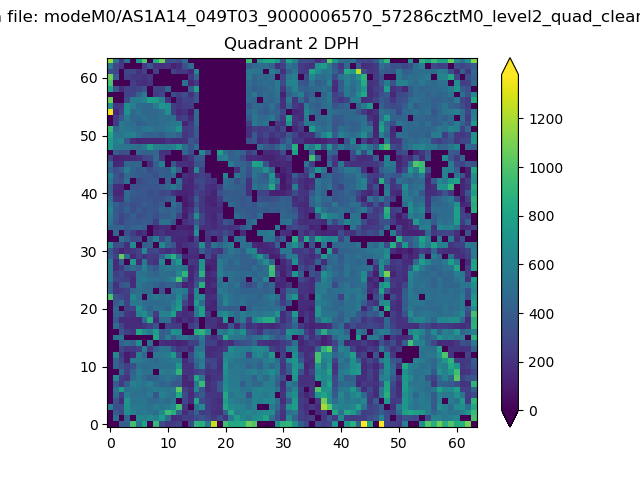
Top three noisy pixels from each quadrant. If the there are fewer than three noisy pixels in the level2.evt file, extra rows are filled as -1
| Pixel properties | Quadrant properties | ||||||
|---|---|---|---|---|---|---|---|
| Quadrant | DetID | PixID | Counts | Sigma | Mean | Median | Sigma |
| A | 8 | 4 | 619452 | 1262.62 | 1991 | 1939 | 489.1 |
| A | 7 | 64 | 180833 | 365.78 | 1991 | 1939 | 489.1 |
| A | 3 | 14 | 72069 | 143.39 | 1991 | 1939 | 489.1 |
| B | 5 | 185 | 637075 | 1536.71 | 1943 | 1868 | 413.4 |
| B | 10 | 16 | 310559 | 746.79 | 1943 | 1868 | 413.4 |
| B | 7 | 252 | 188108 | 450.56 | 1943 | 1868 | 413.4 |
| C | 15 | 224 | 6354149 | 12545.97 | 1872 | 1853 | 506.3 |
| C | 12 | 252 | 361905 | 711.11 | 1872 | 1853 | 506.3 |
| C | 14 | 254 | 257069 | 504.06 | 1872 | 1853 | 506.3 |
| D | 3 | 224 | 3954962 | 7597.35 | 1849 | 1765 | 520.3 |
| D | 8 | 240 | 447725 | 857.06 | 1849 | 1765 | 520.3 |
| D | 7 | 96 | 327515 | 626.03 | 1849 | 1765 | 520.3 |
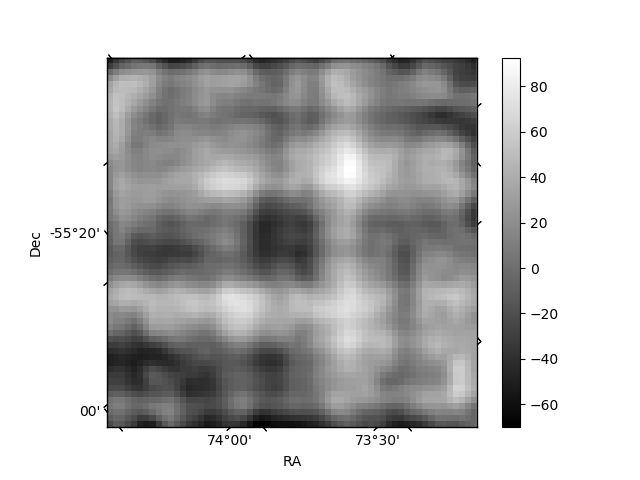
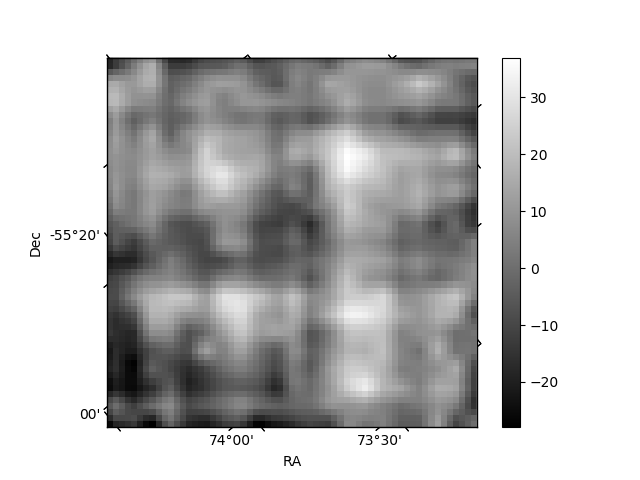
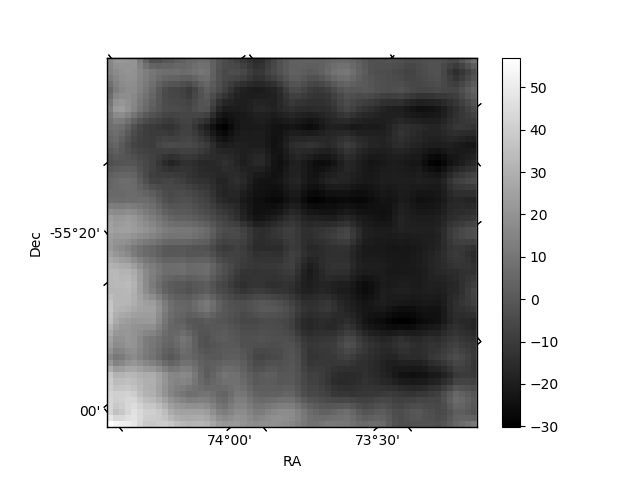
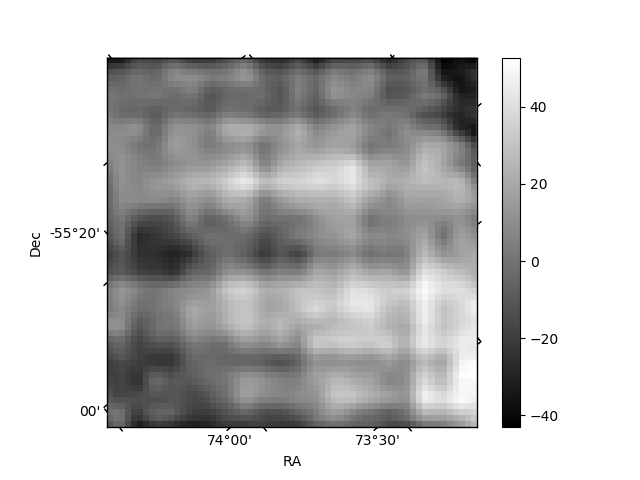
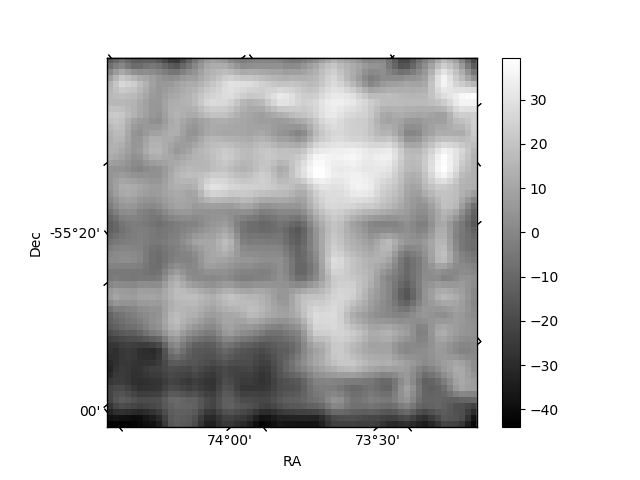
Histogram calculated using DETX and DETY for each event in the final _common_clean file
| Quadrant A | 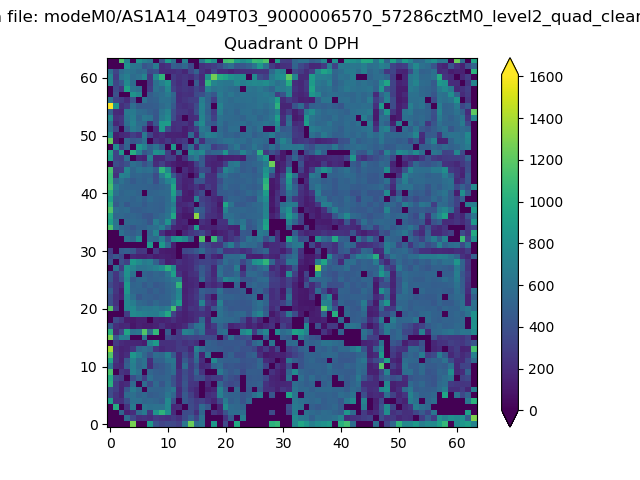 |
 |
Quadrant B |
|---|---|---|---|
| Quadrant D | 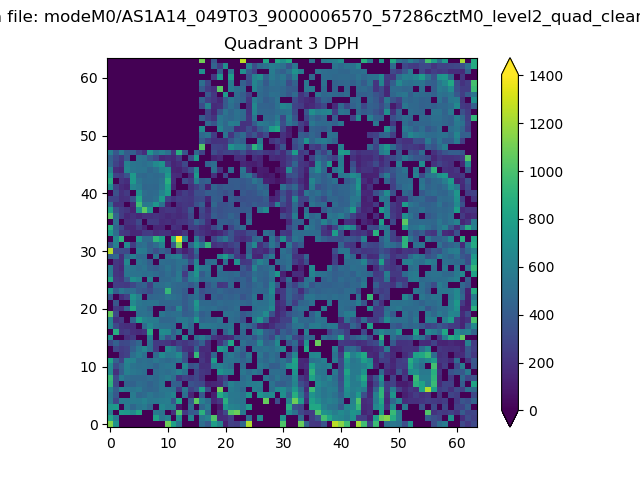 |
 |
Quadrant C |
| Plot type | Count rate plots | Images |
|---|---|---|
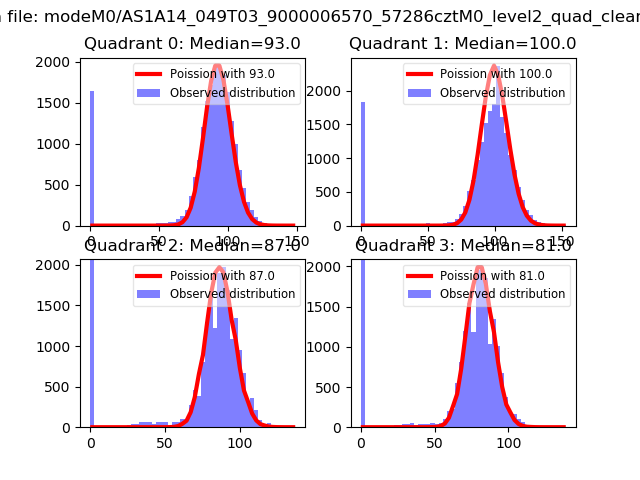
| Comparison with Poisson distribution Blue bars denote a histogram of data divided into 1 sec bins. Red curve is a Poisson curve with rate = median count rate of data. |
 |
 |
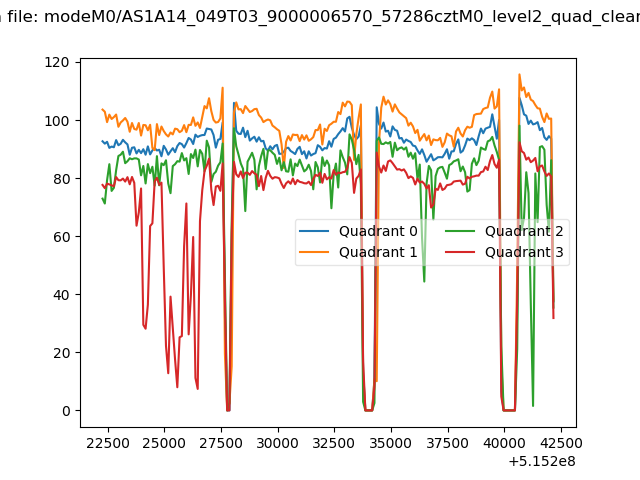
| Quadrant-wise count rates Data is divided into 100 sec bins |
 |
|
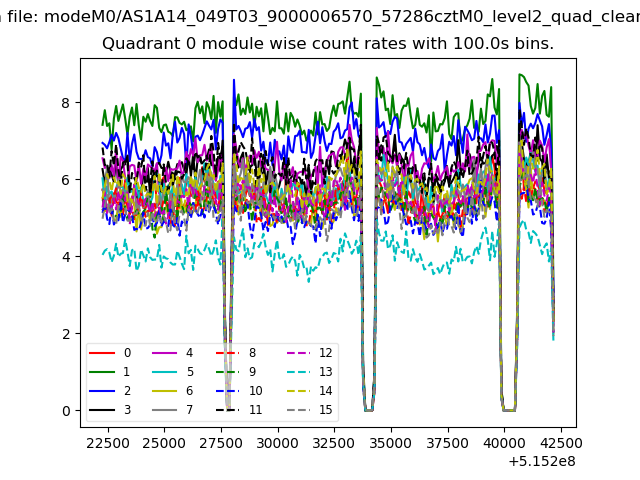
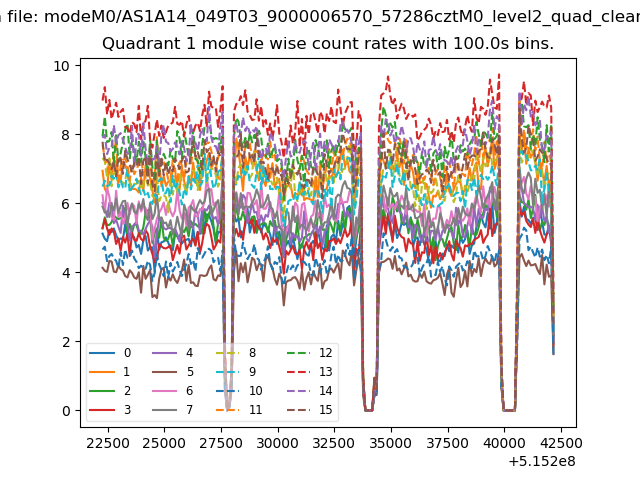
| Module-wise count rates for Quadrant A Data is divided into 100 sec bins |
 |
 |
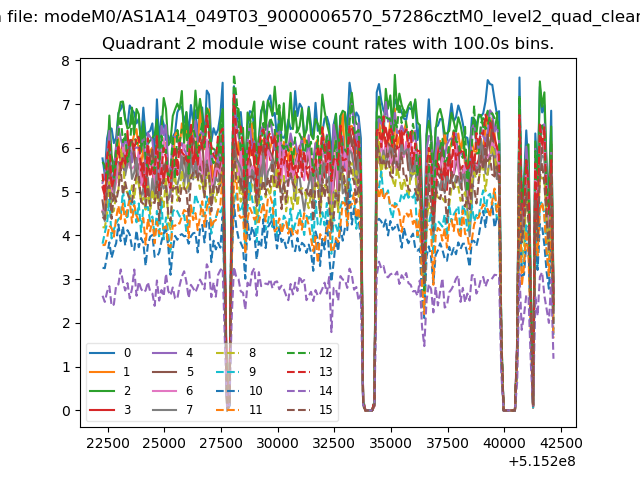
| Module-wise count rates for Quadrant B Data is divided into 100 sec bins |
 |
 |
| Module-wise count rates for Quadrant C Data is divided into 100 sec bins |
 |
 |
| Module-wise count rates for Quadrant D Data is divided into 100 sec bins |
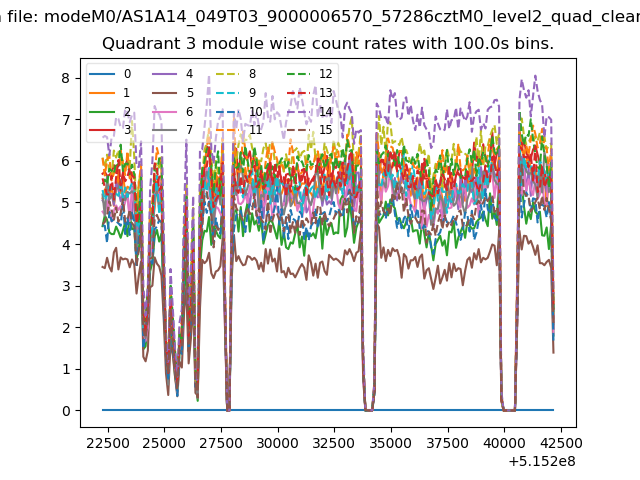 |
 |
| Parameter | Plot |
|---|---|
| CZT HV Monitor | 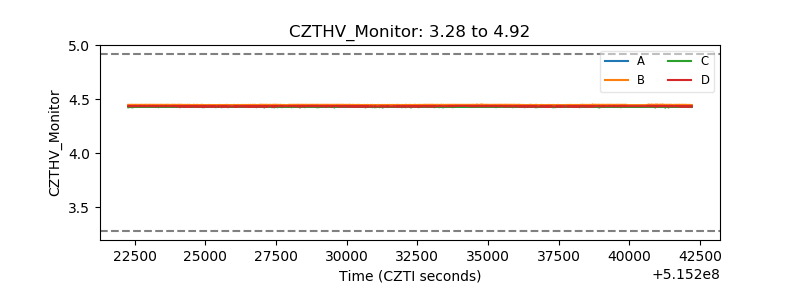 |
| D_VDD | 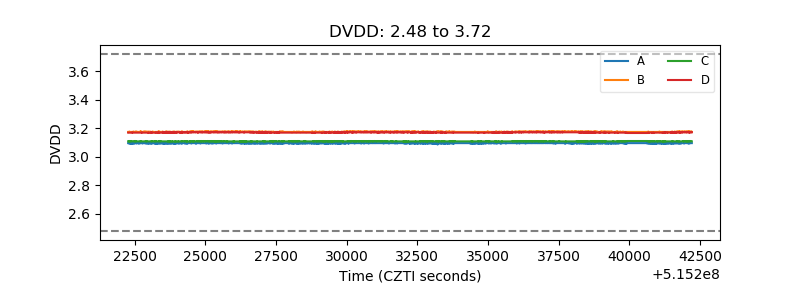 |
| Temperature 1 | 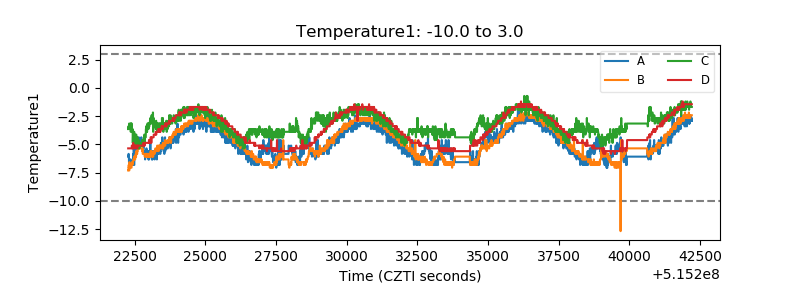 |
| Veto HV Monitor | 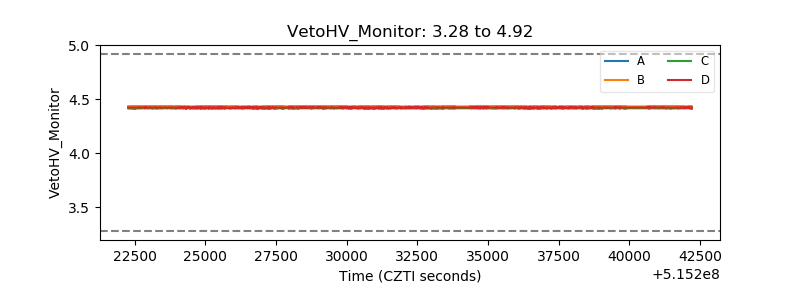 |
| Veto LLD | 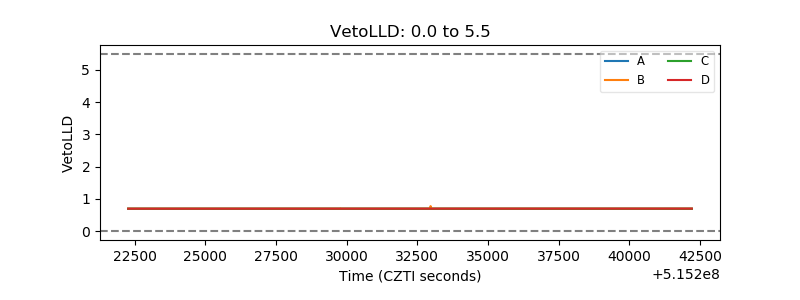 |
| Alpha Counter | 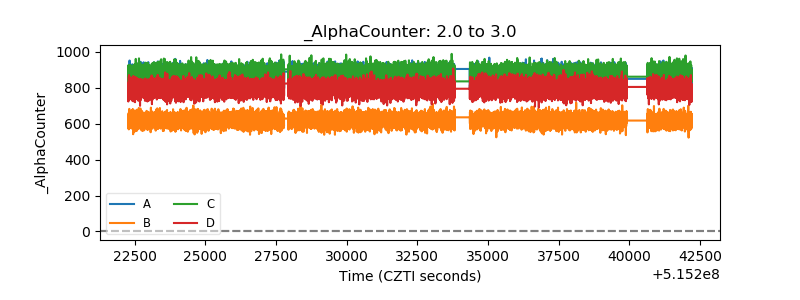 |
| _CPM_Rate | 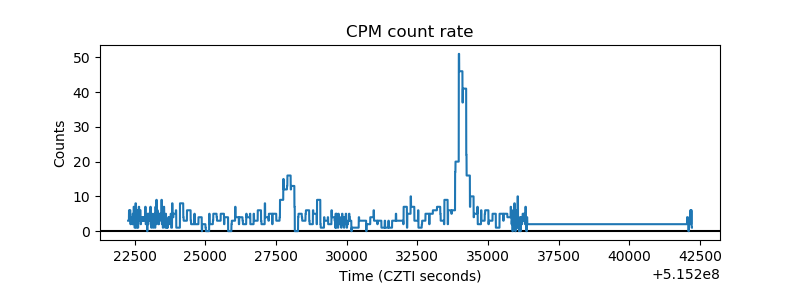 |
| CZT Counter | 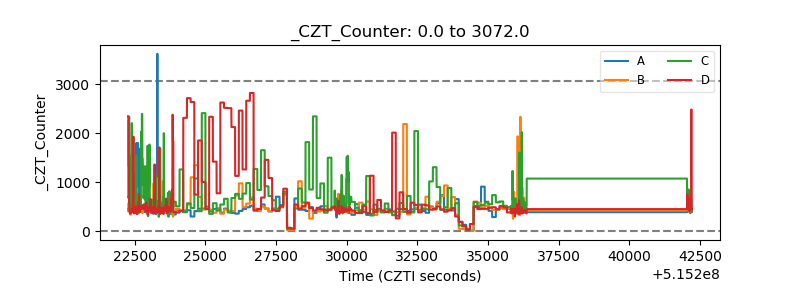 |
| +2.5 Volts monitor |  |
| +5 Volts monitor |  |
| _ROLL_ROT | 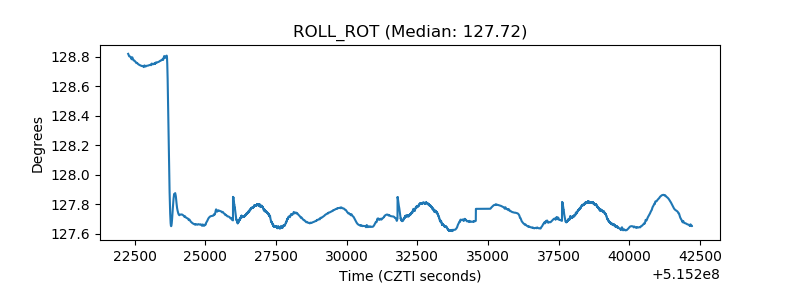 |
| _Roll_DEC | 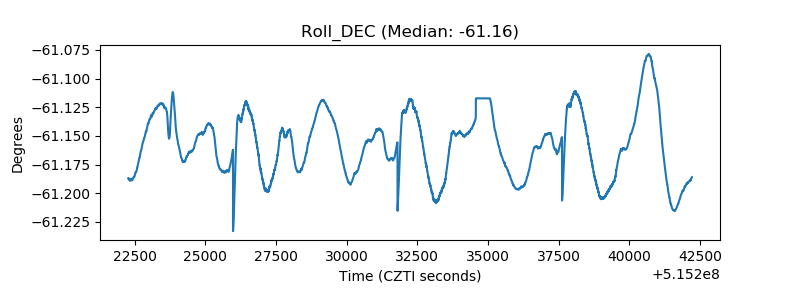 |
| _Roll_RA | 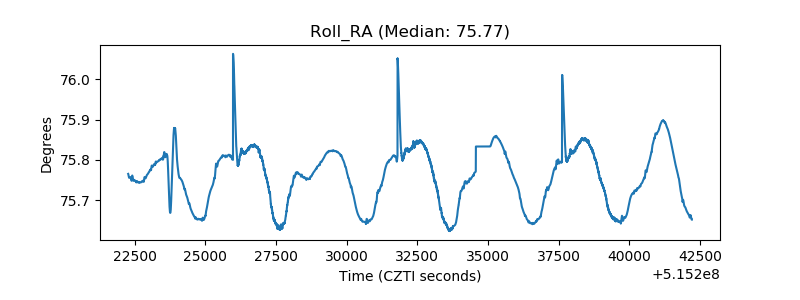 |
| Veto Counter | 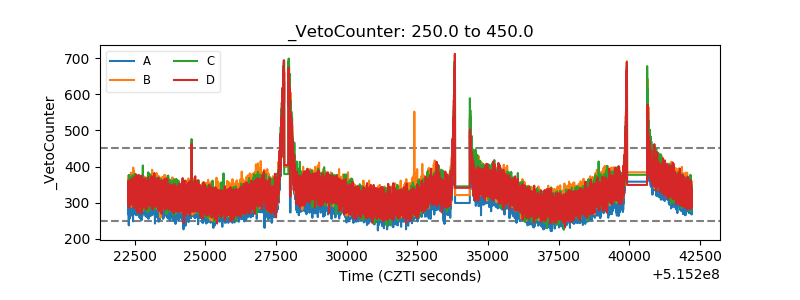 |