| Param | Original file | Final file |
|---|---|---|
| Filename | modeM0/AS1A14_049T03_9000006570_57287cztM0_level2.fits | modeM0/AS1A14_049T03_9000006570_57287cztM0_level2_quad_clean.evt |
| Size (bytes) | 474,514,560 | 96,252,480 |
| Size | 452.5 MB | 91.8 MB |
| Events in quadrant A | 3,333,620 | 642,924 |
| Events in quadrant B | 3,359,259 | 683,156 |
| Events in quadrant C | 6,641,608 | 543,012 |
| Events in quadrant D | 3,705,000 | 574,396 |
| Mode M0 | |||
|---|---|---|---|
| Quadrant | BADHDUFLAG | Total packets | Discarded packets |
| A | 0 | 14342 | 1 |
| B | 0 | 14696 | 1 |
| C | 0 | 24416 | 1 |
| D | 0 | 15682 | 1 |
| Mode M9 | |||
|---|---|---|---|
| Quadrant | BADHDUFLAG | Total packets | Discarded packets |
| A | 0 | 9 | 0 |
| B | 0 | 9 | 0 |
| C | 0 | 9 | 0 |
| D | 0 | 9 | 0 |
| Mode SS | |||
|---|---|---|---|
| Quadrant | BADHDUFLAG | Total packets | Discarded packets |
| A | 0 | 136 | 0 |
| B | 0 | 136 | 0 |
| C | 0 | 136 | 0 |
| D | 0 | 136 | 0 |
| Quadrant | Total seconds | Saturated seconds | Saturation percentage |
|---|---|---|---|
| A | 6759 | 55 | 0.813730% |
| B | 6760 | 99 | 1.464497% |
| C | 6760 | 985 | 14.571006% |
| D | 6760 | 151 | 2.233728% |
Noise dominated data is calculated using 1-second bins in cleaned event files. If a bin has >2000 counts, and if more than 50% of those come from <1% of pixels, then it is considered to be noise-dominated and hence unusable.
| Quadrant | # 1 sec bins | Bins with >0 counts | Bins with >2000 counts | High rate bins dominated by noise | Noise dominated (total time) | Noise dominated (detector-on time) | Marked lightcurve |
|---|---|---|---|---|---|---|---|
| A | 7644 | 6760 | 1 | 1 | 0.01% | 0.01% | 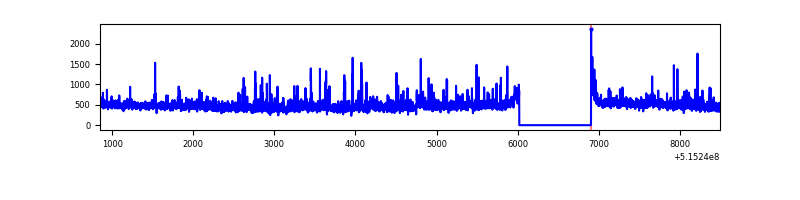 |
| B | 7645 | 6761 | 28 | 28 | 0.37% | 0.41% | 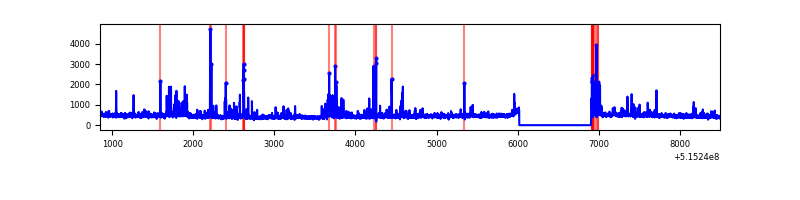 |
| C | 7645 | 6761 | 778 | 778 | 10.18% | 11.51% | 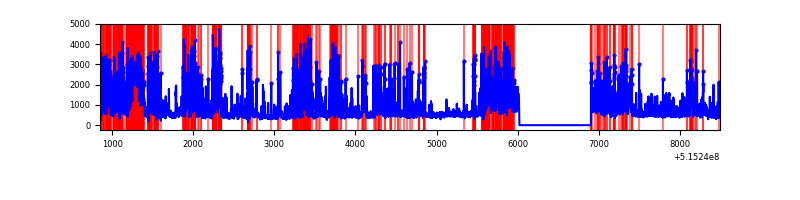 |
| D | 7645 | 6761 | 109 | 109 | 1.43% | 1.61% | 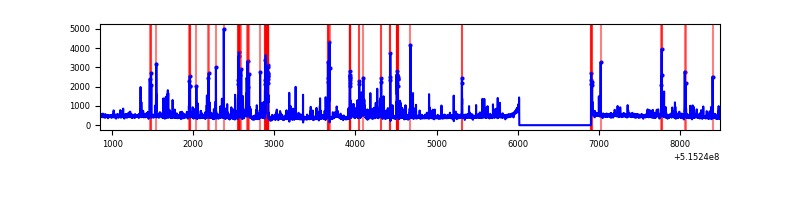 |
Top three noisy pixels from each quadrant. If the there are fewer than three noisy pixels in the level2.evt file, extra rows are filled as -1
| Pixel properties | Quadrant properties | ||||||
|---|---|---|---|---|---|---|---|
| Quadrant | DetID | PixID | Counts | Sigma | Mean | Median | Sigma |
| A | 8 | 4 | 300795 | 1667.11 | 732 | 713 | 180.0 |
| A | 7 | 64 | 79223 | 436.16 | 732 | 713 | 180.0 |
| A | 3 | 14 | 75706 | 416.63 | 732 | 713 | 180.0 |
| B | 5 | 185 | 164619 | 1058.37 | 716 | 689 | 154.9 |
| B | 7 | 252 | 83776 | 536.43 | 716 | 689 | 154.9 |
| B | 10 | 247 | 80479 | 515.14 | 716 | 689 | 154.9 |
| C | 15 | 224 | 3278362 | 18138.15 | 661 | 656 | 180.7 |
| C | 14 | 254 | 243218 | 1342.29 | 661 | 656 | 180.7 |
| C | 2 | 12 | 139026 | 765.71 | 661 | 656 | 180.7 |
| D | 8 | 240 | 341116 | 1705.06 | 706 | 676 | 199.7 |
| D | 3 | 12 | 183965 | 917.98 | 706 | 676 | 199.7 |
| D | 7 | 96 | 124580 | 620.56 | 706 | 676 | 199.7 |
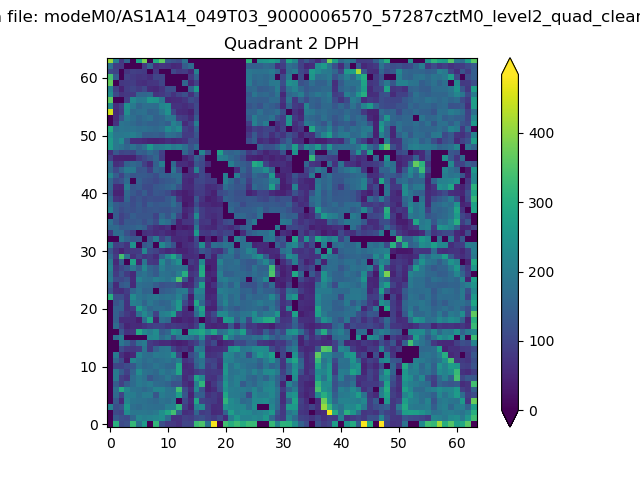
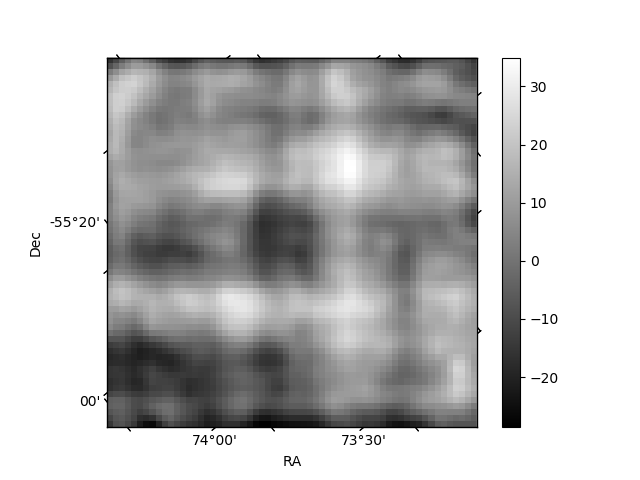
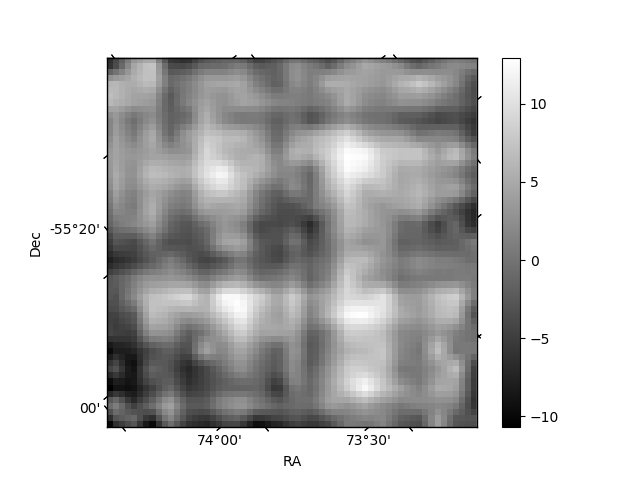
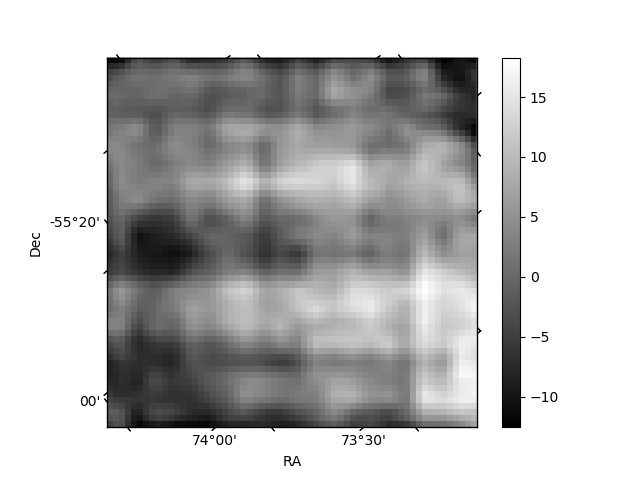
Histogram calculated using DETX and DETY for each event in the final _common_clean file
| Quadrant A | 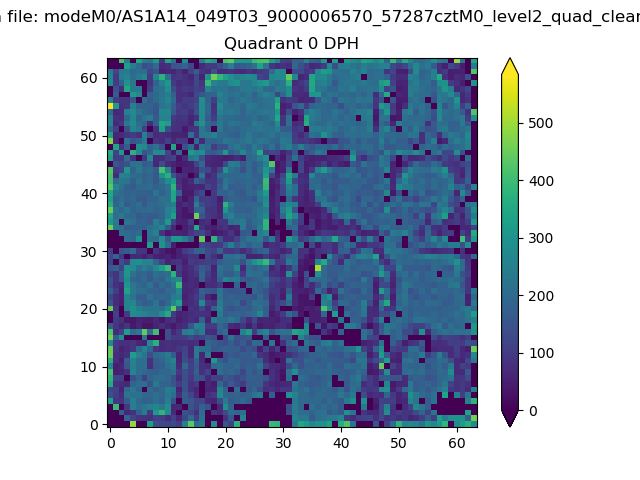 |
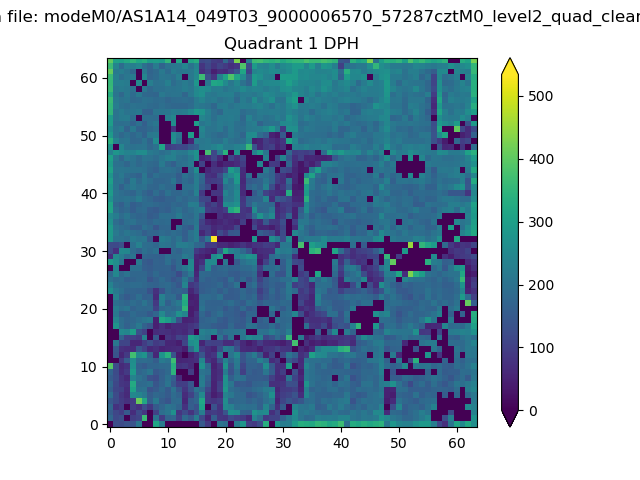 |
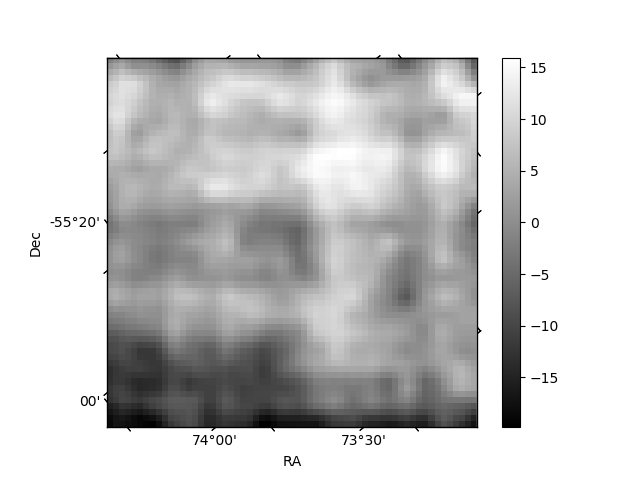
Quadrant B |
|---|---|---|---|
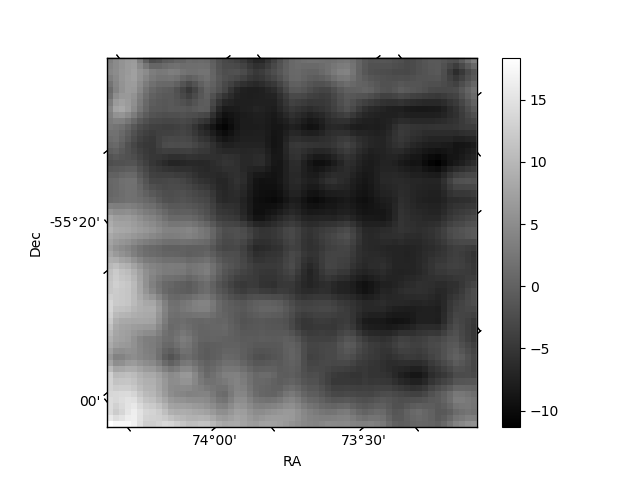
| Quadrant D | 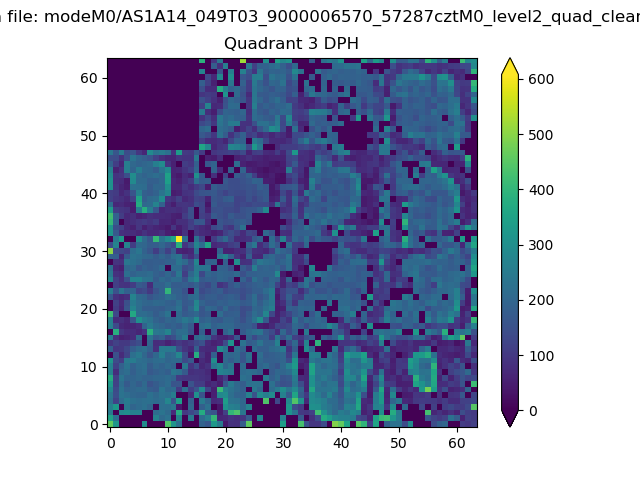 |
 |
Quadrant C |
| Plot type | Count rate plots | Images |
|---|---|---|
| Comparison with Poisson distribution Blue bars denote a histogram of data divided into 1 sec bins. Red curve is a Poisson curve with rate = median count rate of data. |
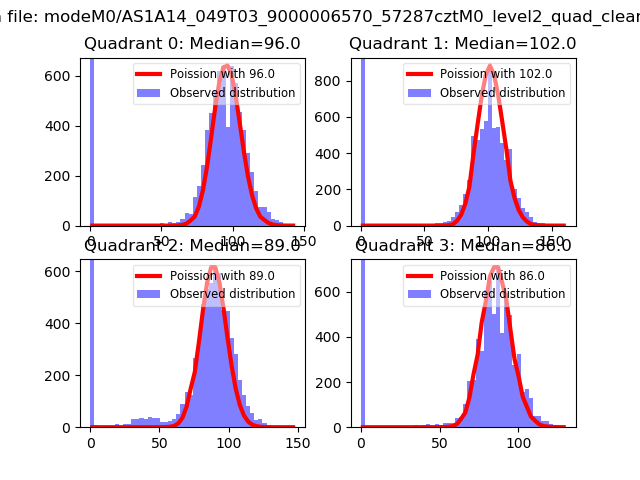 |
 |
| Quadrant-wise count rates Data is divided into 100 sec bins |
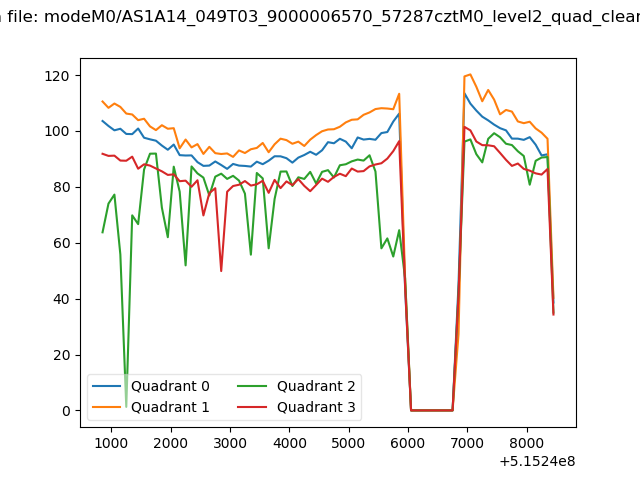 |
|
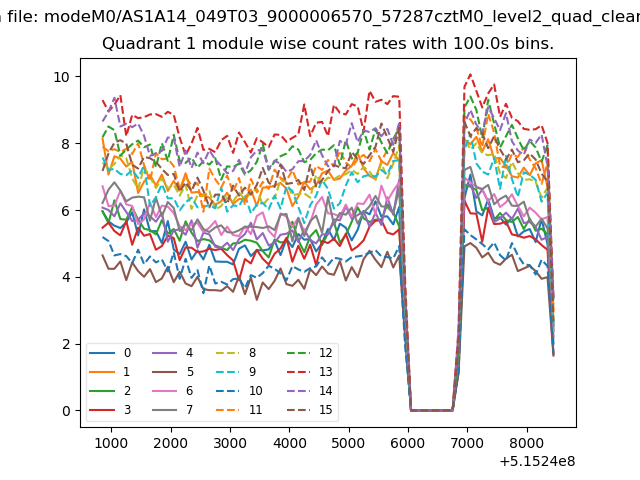
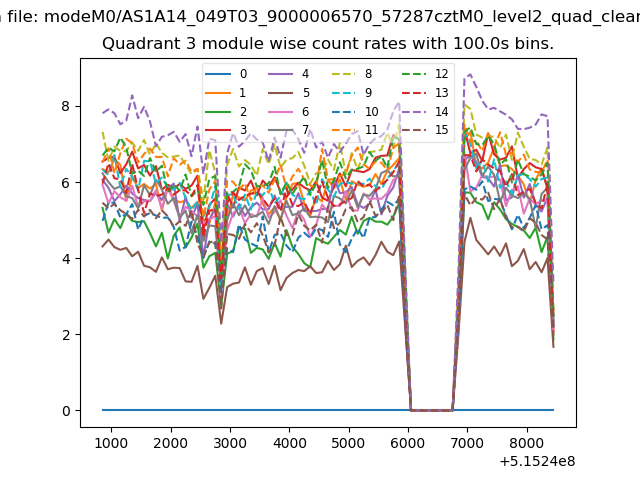
| Module-wise count rates for Quadrant A Data is divided into 100 sec bins |
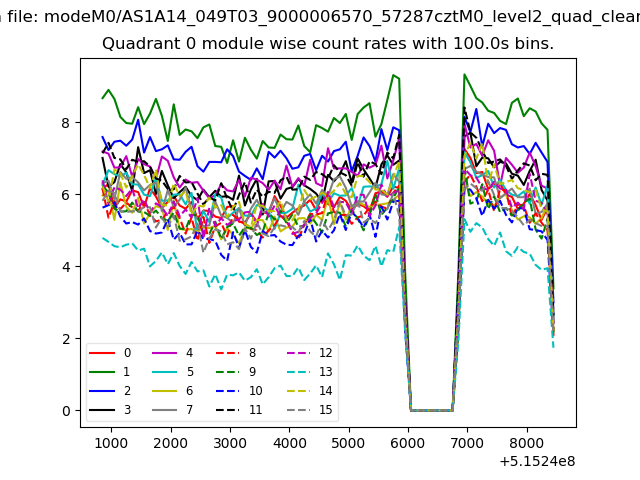 |
 |
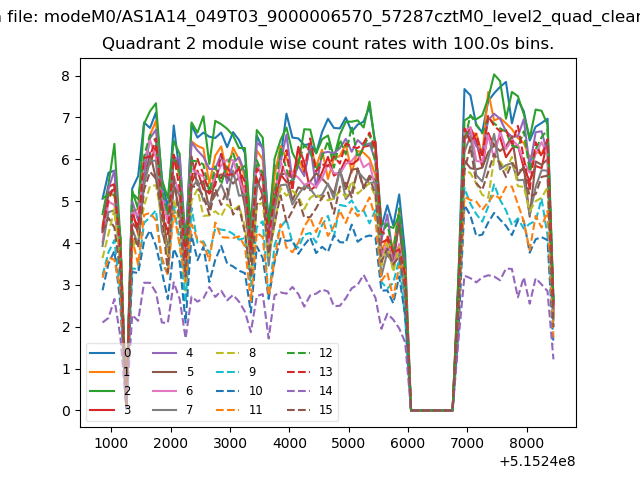
| Module-wise count rates for Quadrant B Data is divided into 100 sec bins |
 |
 |
| Module-wise count rates for Quadrant C Data is divided into 100 sec bins |
 |
 |
| Module-wise count rates for Quadrant D Data is divided into 100 sec bins |
 |
 |
| Parameter | Plot |
|---|---|
| CZT HV Monitor | 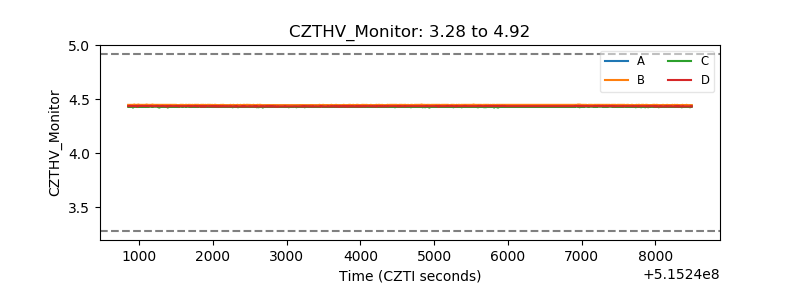 |
| D_VDD | 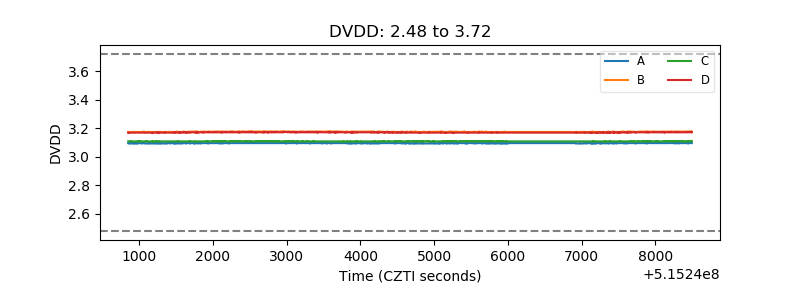 |
| Temperature 1 | 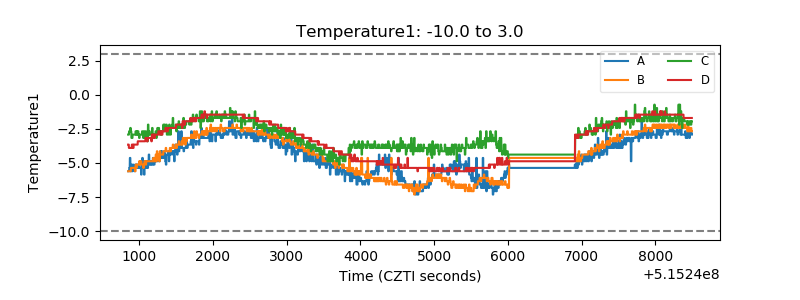 |
| Veto HV Monitor |  |
| Veto LLD | 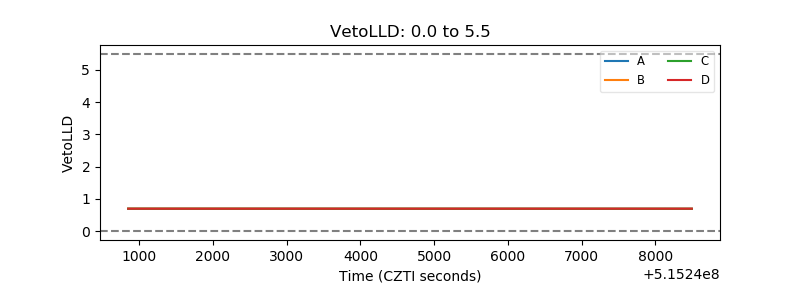 |
| Alpha Counter | 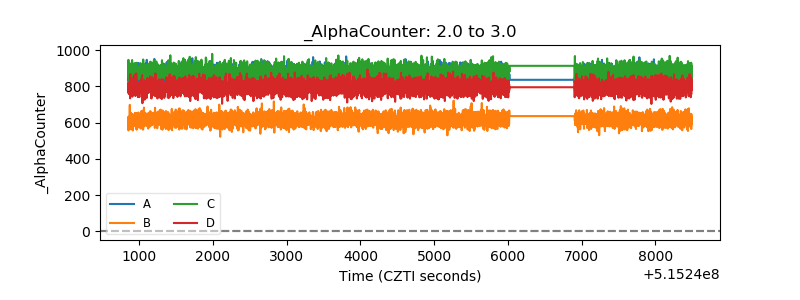 |
| _CPM_Rate | 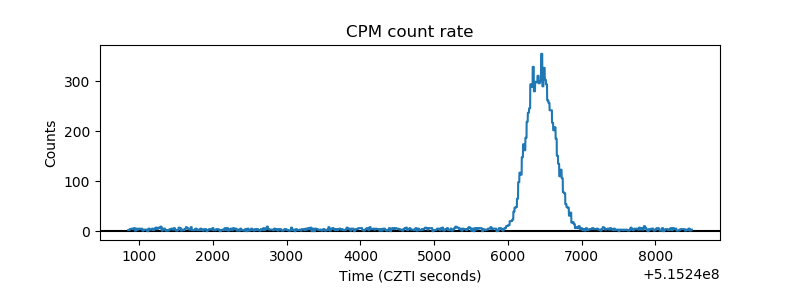 |
| CZT Counter | 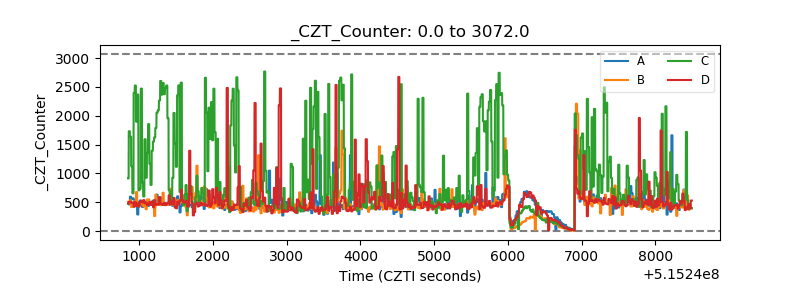 |
| +2.5 Volts monitor |  |
| +5 Volts monitor |  |
| _ROLL_ROT | 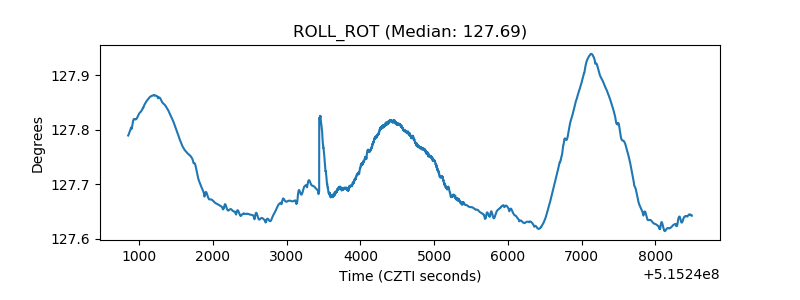 |
| _Roll_DEC | 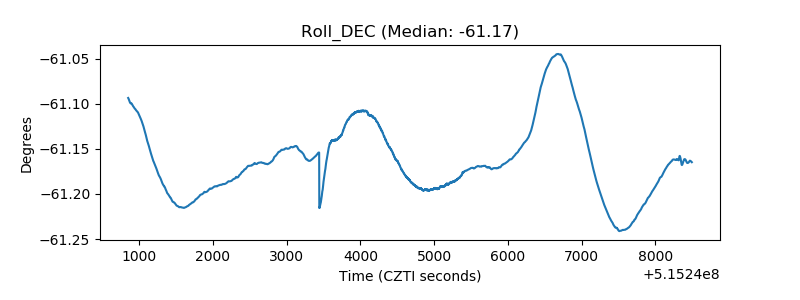 |
| _Roll_RA | 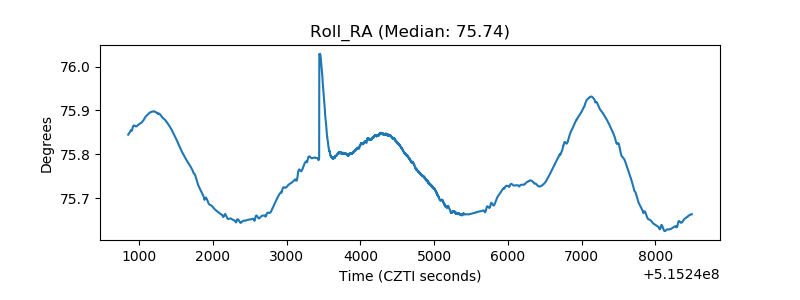 |
| Veto Counter | 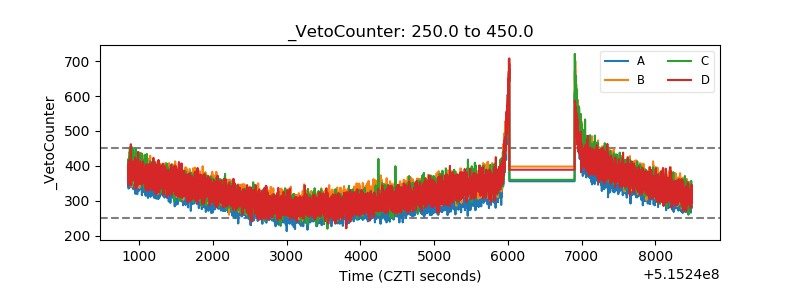 |