| Param | Original file | Final file |
|---|---|---|
| Filename | modeM0/AS1A14_049T03_9000006570_57289cztM0_level2.fits | modeM0/AS1A14_049T03_9000006570_57289cztM0_level2_quad_clean.evt |
| Size (bytes) | 371,128,320 | 87,572,160 |
| Size | 353.9 MB | 83.5 MB |
| Events in quadrant A | 2,901,022 | 574,071 |
| Events in quadrant B | 3,133,132 | 612,713 |
| Events in quadrant C | 4,368,049 | 530,453 |
| Events in quadrant D | 2,870,659 | 517,311 |
| Mode M0 | |||
|---|---|---|---|
| Quadrant | BADHDUFLAG | Total packets | Discarded packets |
| A | 0 | 12622 | 1 |
| B | 0 | 13571 | 1 |
| C | 0 | 17161 | 1 |
| D | 0 | 12936 | 1 |
| Mode M9 | |||
|---|---|---|---|
| Quadrant | BADHDUFLAG | Total packets | Discarded packets |
| A | 0 | 11 | 0 |
| B | 0 | 11 | 0 |
| C | 0 | 11 | 0 |
| D | 0 | 11 | 0 |
| Mode SS | |||
|---|---|---|---|
| Quadrant | BADHDUFLAG | Total packets | Discarded packets |
| A | 0 | 120 | 0 |
| B | 0 | 120 | 0 |
| C | 0 | 120 | 0 |
| D | 0 | 120 | 0 |
| Quadrant | Total seconds | Saturated seconds | Saturation percentage |
|---|---|---|---|
| A | 5973 | 49 | 0.820358% |
| B | 5974 | 92 | 1.540007% |
| C | 5974 | 285 | 4.770673% |
| D | 5974 | 53 | 0.887178% |
Noise dominated data is calculated using 1-second bins in cleaned event files. If a bin has >2000 counts, and if more than 50% of those come from <1% of pixels, then it is considered to be noise-dominated and hence unusable.
| Quadrant | # 1 sec bins | Bins with >0 counts | Bins with >2000 counts | High rate bins dominated by noise | Noise dominated (total time) | Noise dominated (detector-on time) | Marked lightcurve |
|---|---|---|---|---|---|---|---|
| A | 7008 | 5974 | 3 | 3 | 0.04% | 0.05% | 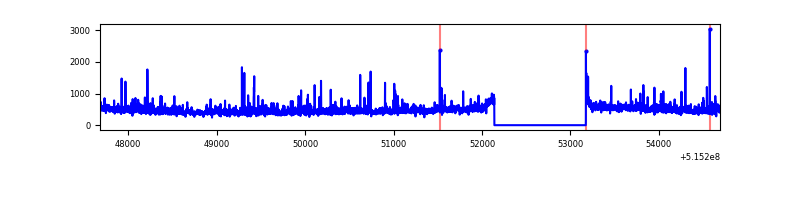 |
| B | 7009 | 5975 | 25 | 25 | 0.36% | 0.42% | 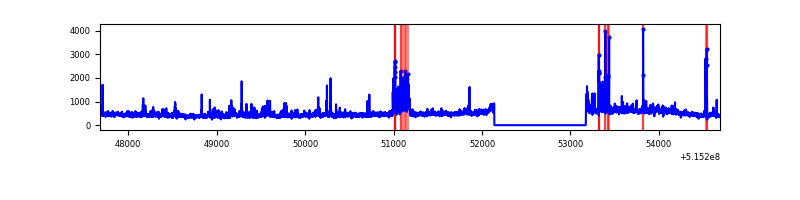 |
| C | 7009 | 5975 | 244 | 244 | 3.48% | 4.08% | 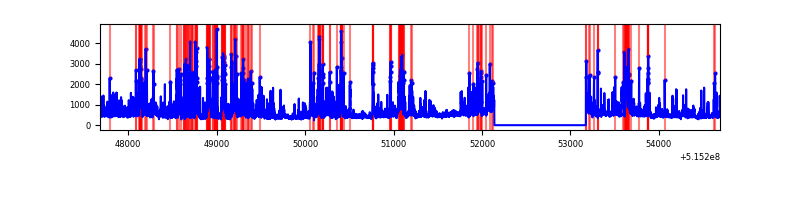 |
| D | 7009 | 5975 | 31 | 31 | 0.44% | 0.52% | 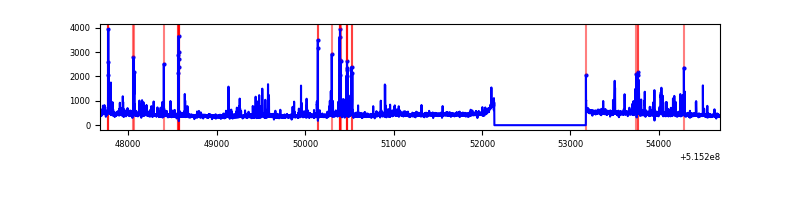 |
Top three noisy pixels from each quadrant. If the there are fewer than three noisy pixels in the level2.evt file, extra rows are filled as -1
| Pixel properties | Quadrant properties | ||||||
|---|---|---|---|---|---|---|---|
| Quadrant | DetID | PixID | Counts | Sigma | Mean | Median | Sigma |
| A | 8 | 4 | 333972 | 2105.17 | 642 | 625 | 158.3 |
| A | 3 | 14 | 26015 | 160.34 | 642 | 625 | 158.3 |
| A | 7 | 64 | 17312 | 105.38 | 642 | 625 | 158.3 |
| B | 5 | 185 | 261930 | 1929.73 | 630 | 606 | 135.4 |
| B | 7 | 0 | 144920 | 1065.68 | 630 | 606 | 135.4 |
| B | 10 | 16 | 64467 | 471.58 | 630 | 606 | 135.4 |
| C | 15 | 224 | 1334621 | 8073.36 | 603 | 596 | 165.2 |
| C | 14 | 254 | 155264 | 936.03 | 603 | 596 | 165.2 |
| C | 6 | 223 | 118983 | 716.46 | 603 | 596 | 165.2 |
| D | 3 | 12 | 136584 | 775.96 | 617 | 589 | 175.3 |
| D | 2 | 249 | 47793 | 269.34 | 617 | 589 | 175.3 |
| D | 5 | 173 | 44597 | 251.1 | 617 | 589 | 175.3 |
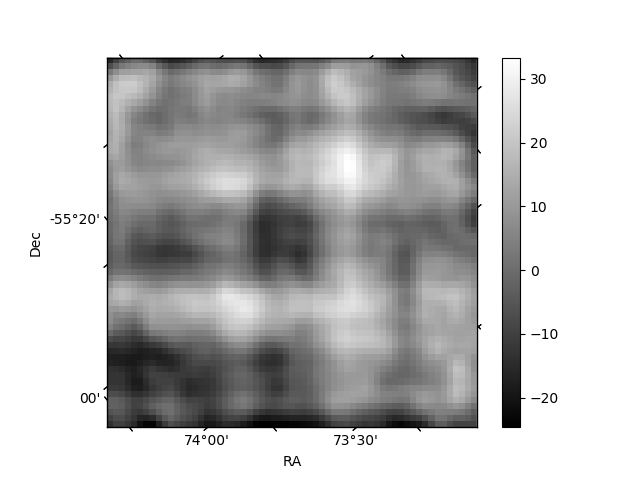
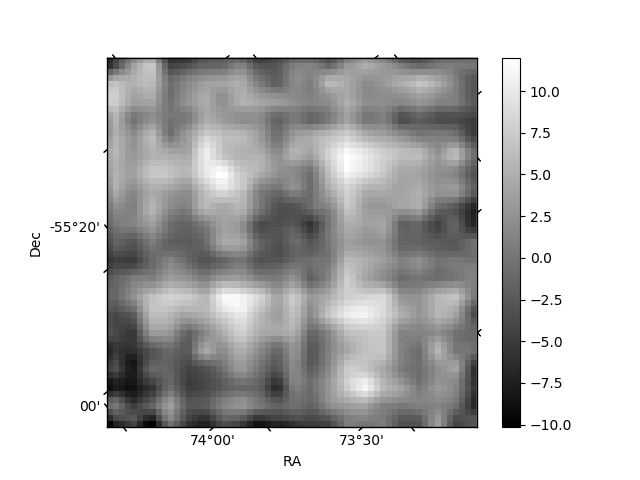
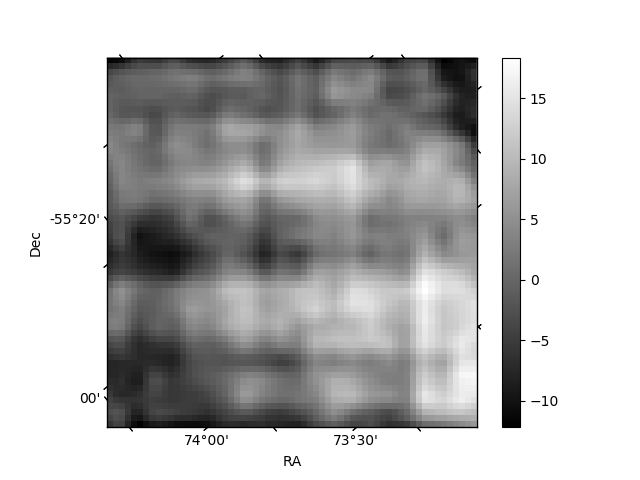
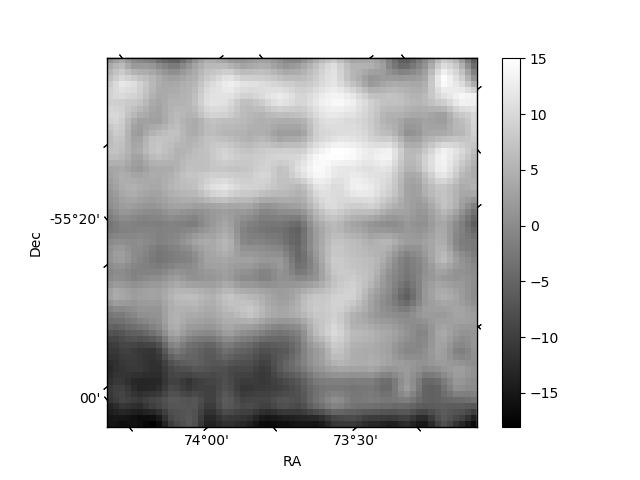
Histogram calculated using DETX and DETY for each event in the final _common_clean file
| Quadrant A | 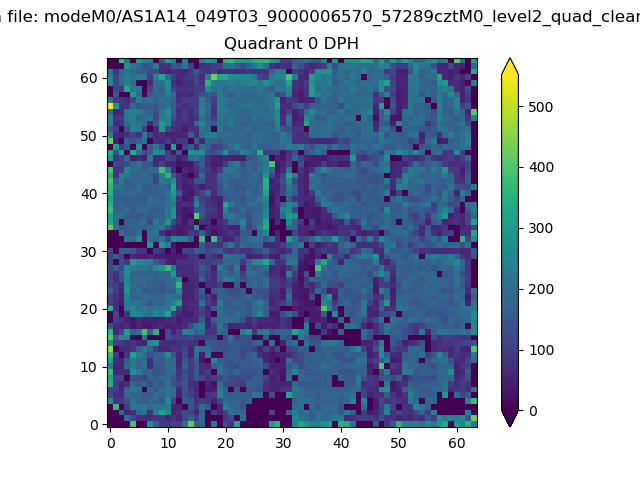 |
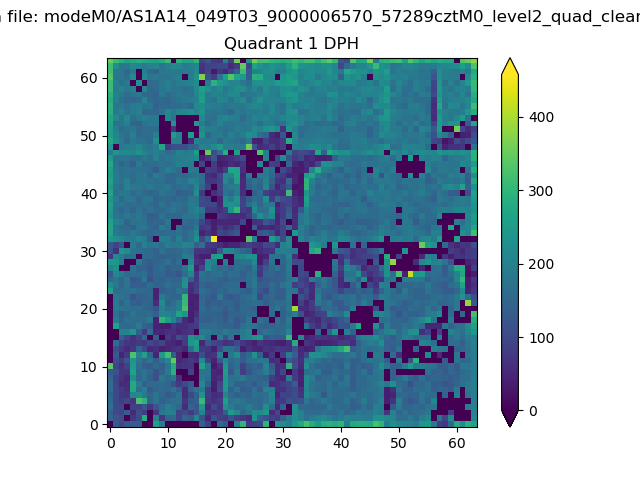 |
Quadrant B |
|---|---|---|---|
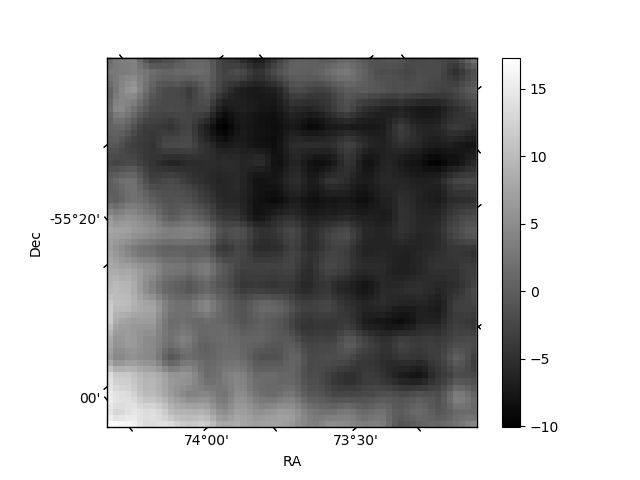
| Quadrant D | 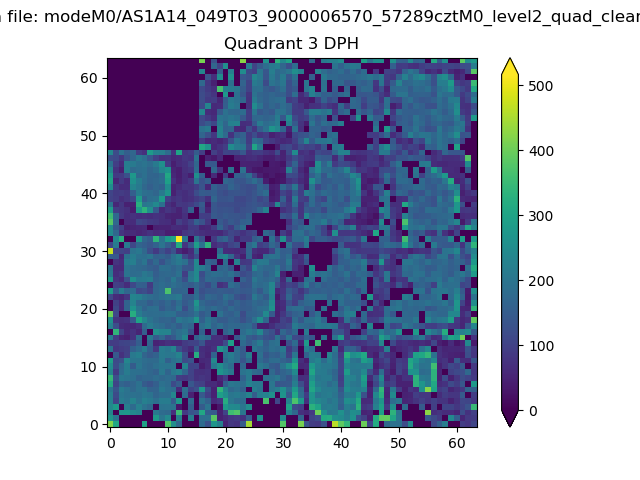 |
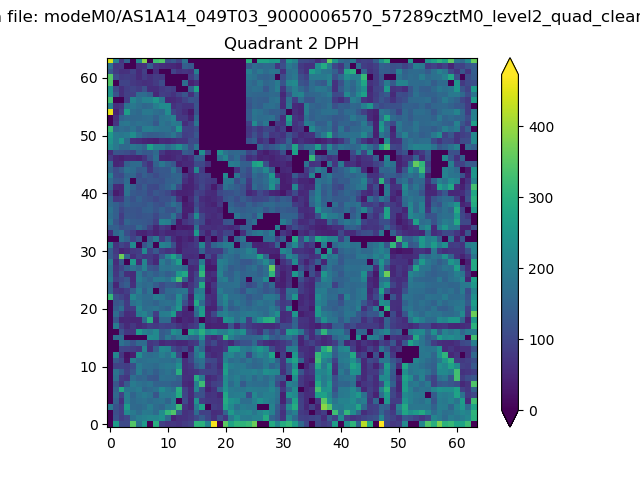 |
Quadrant C |
| Plot type | Count rate plots | Images |
|---|---|---|
| Comparison with Poisson distribution Blue bars denote a histogram of data divided into 1 sec bins. Red curve is a Poisson curve with rate = median count rate of data. |
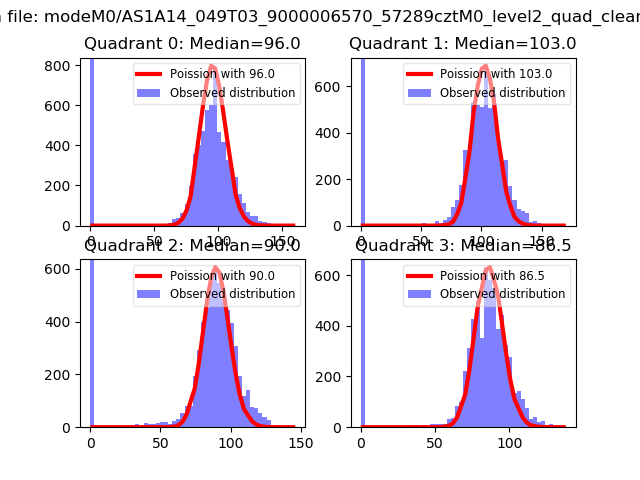 |
 |
| Quadrant-wise count rates Data is divided into 100 sec bins |
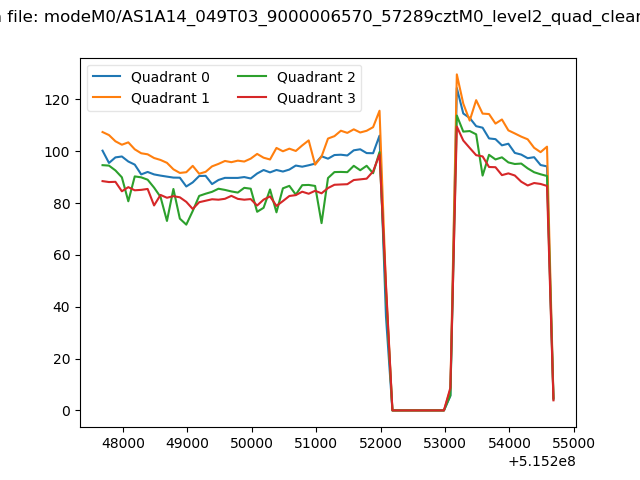 |
|
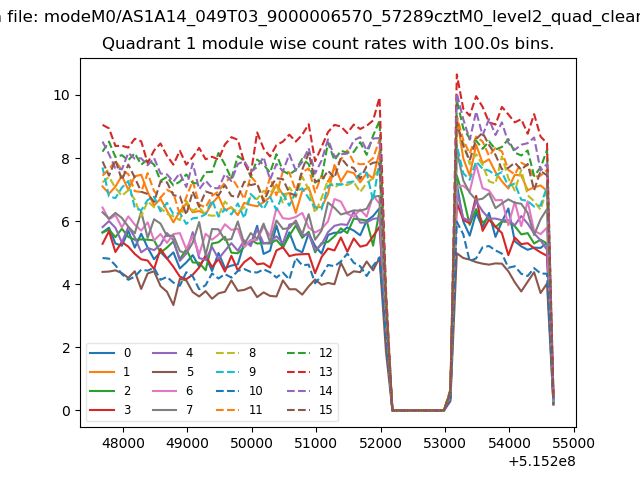
| Module-wise count rates for Quadrant A Data is divided into 100 sec bins |
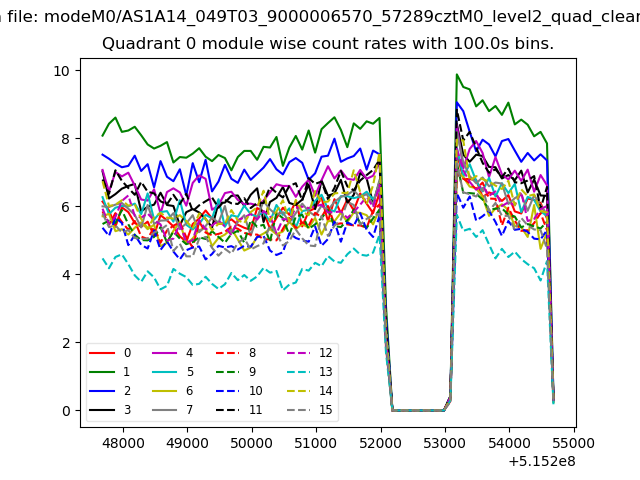 |
 |
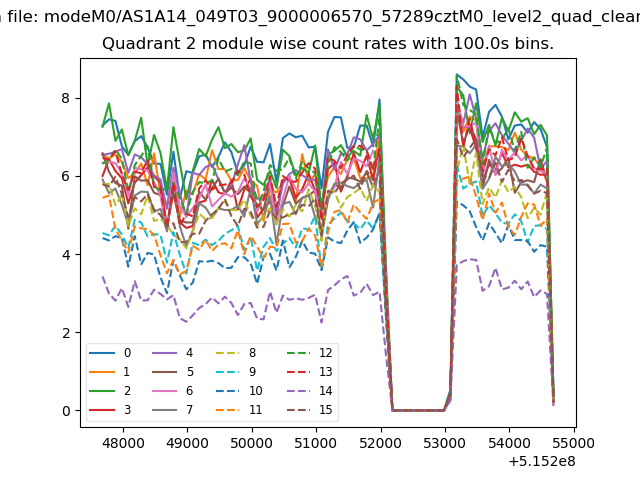
| Module-wise count rates for Quadrant B Data is divided into 100 sec bins |
 |
 |
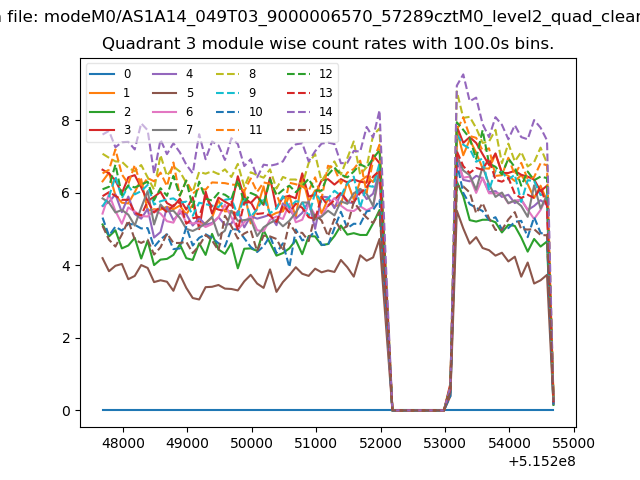
| Module-wise count rates for Quadrant C Data is divided into 100 sec bins |
 |
 |
| Module-wise count rates for Quadrant D Data is divided into 100 sec bins |
 |
 |
| Parameter | Plot |
|---|---|
| CZT HV Monitor |  |
| D_VDD | 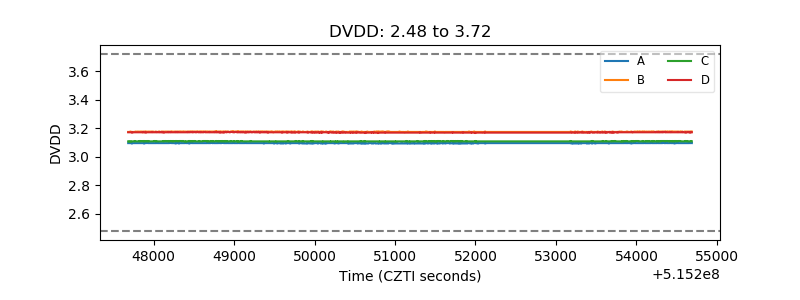 |
| Temperature 1 | 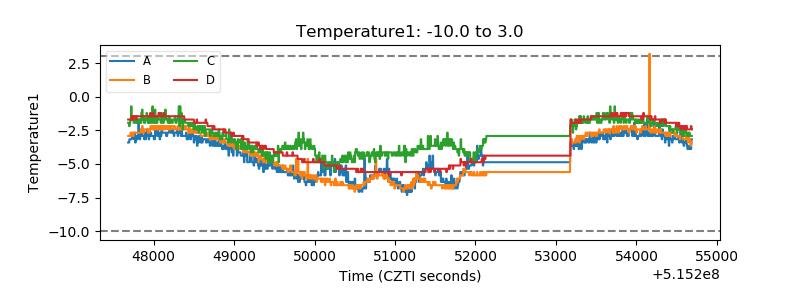 |
| Veto HV Monitor | 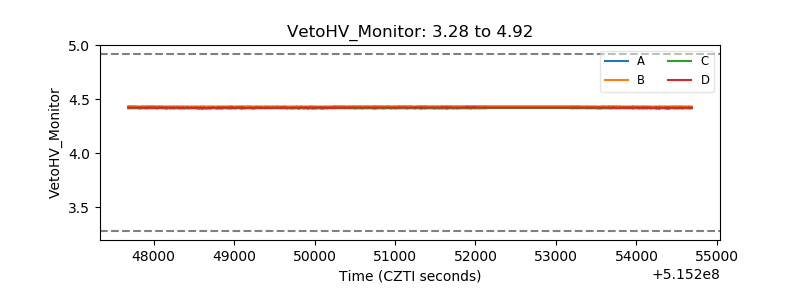 |
| Veto LLD | 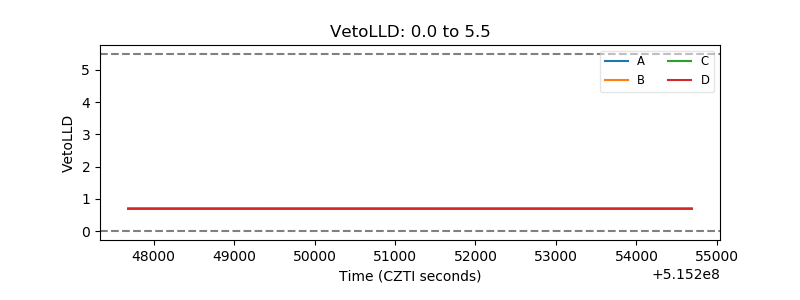 |
| Alpha Counter | 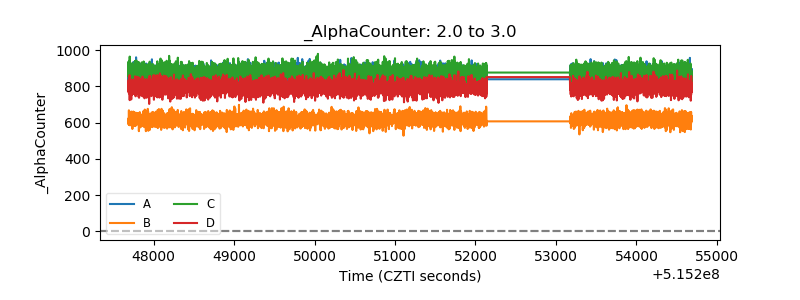 |
| _CPM_Rate | 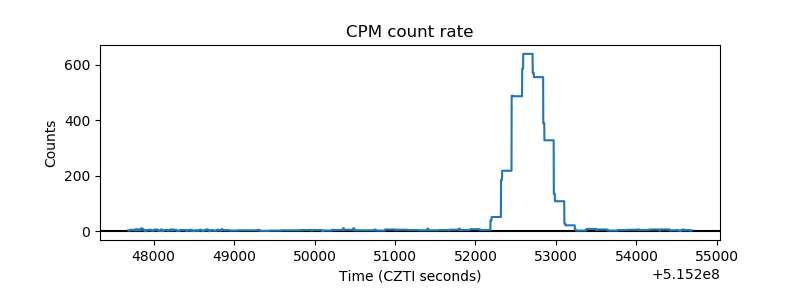 |
| CZT Counter | 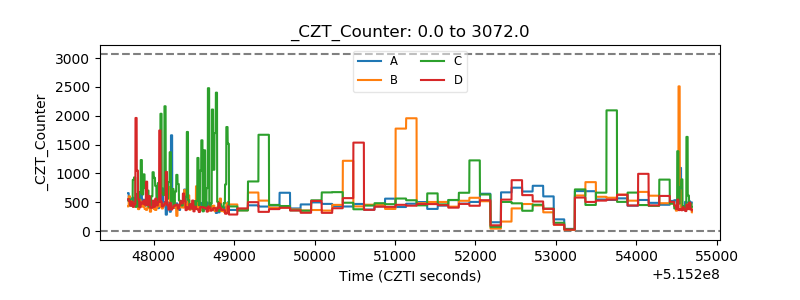 |
| +2.5 Volts monitor | 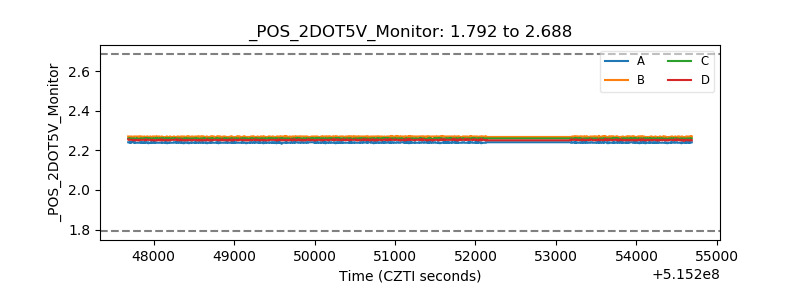 |
| +5 Volts monitor |  |
| _ROLL_ROT | 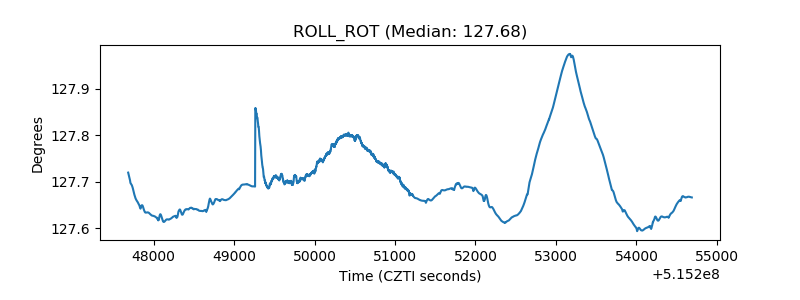 |
| _Roll_DEC | 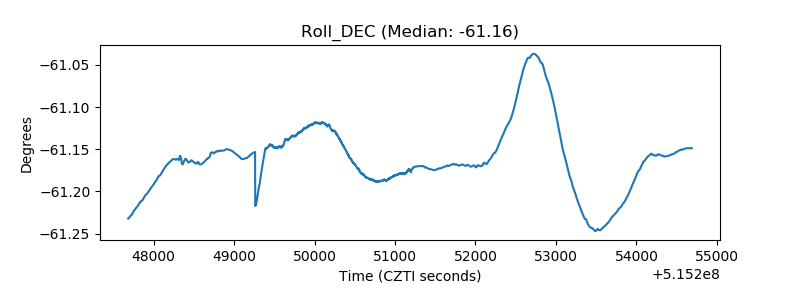 |
| _Roll_RA | 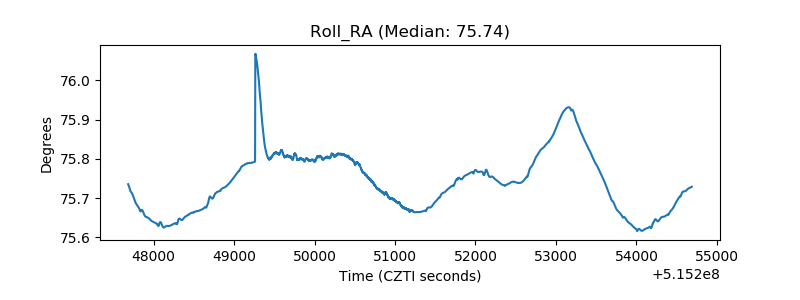 |
| Veto Counter | 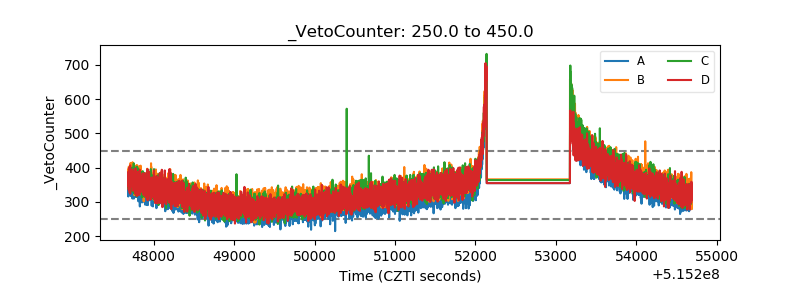 |