| Param | Original file | Final file |
|---|---|---|
| Filename | modeM0/AS1A14_049T03_9000006570_57290cztM0_level2.fits | modeM0/AS1A14_049T03_9000006570_57290cztM0_level2_quad_clean.evt |
| Size (bytes) | 362,197,440 | 87,039,360 |
| Size | 345.4 MB | 83.0 MB |
| Events in quadrant A | 2,892,523 | 575,764 |
| Events in quadrant B | 3,116,707 | 612,818 |
| Events in quadrant C | 3,774,972 | 534,179 |
| Events in quadrant D | 3,170,031 | 506,111 |
| Mode M0 | |||
|---|---|---|---|
| Quadrant | BADHDUFLAG | Total packets | Discarded packets |
| A | 0 | 12430 | 1 |
| B | 0 | 13154 | 2 |
| C | 0 | 15258 | 1 |
| D | 0 | 13666 | 1 |
| Mode M9 | |||
|---|---|---|---|
| Quadrant | BADHDUFLAG | Total packets | Discarded packets |
| A | 0 | 11 | 0 |
| B | 0 | 11 | 0 |
| C | 0 | 11 | 0 |
| D | 0 | 11 | 0 |
| Mode SS | |||
|---|---|---|---|
| Quadrant | BADHDUFLAG | Total packets | Discarded packets |
| A | 0 | 118 | 0 |
| B | 0 | 118 | 0 |
| C | 0 | 118 | 0 |
| D | 0 | 118 | 0 |
| Quadrant | Total seconds | Saturated seconds | Saturation percentage |
|---|---|---|---|
| A | 5819 | 33 | 0.567108% |
| B | 5819 | 77 | 1.323251% |
| C | 5819 | 150 | 2.577763% |
| D | 5819 | 120 | 2.062210% |
Noise dominated data is calculated using 1-second bins in cleaned event files. If a bin has >2000 counts, and if more than 50% of those come from <1% of pixels, then it is considered to be noise-dominated and hence unusable.
| Quadrant | # 1 sec bins | Bins with >0 counts | Bins with >2000 counts | High rate bins dominated by noise | Noise dominated (total time) | Noise dominated (detector-on time) | Marked lightcurve |
|---|---|---|---|---|---|---|---|
| A | 6969 | 5820 | 7 | 7 | 0.10% | 0.12% | 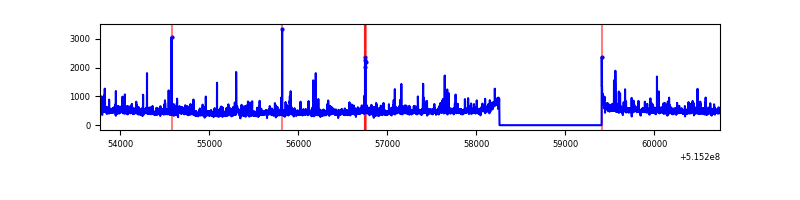 |
| B | 6969 | 5820 | 30 | 30 | 0.43% | 0.52% | 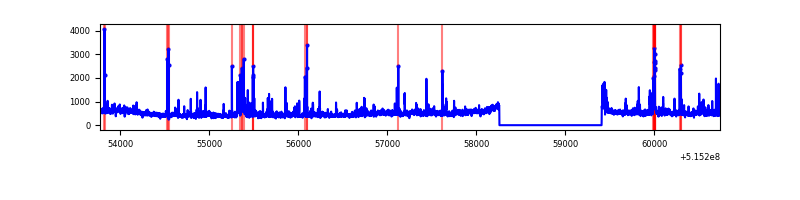 |
| C | 6969 | 5820 | 146 | 146 | 2.09% | 2.51% | 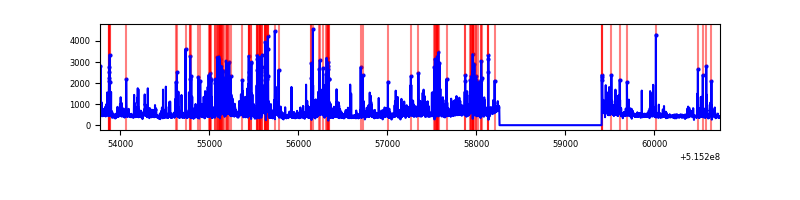 |
| D | 6969 | 5820 | 97 | 97 | 1.39% | 1.67% | 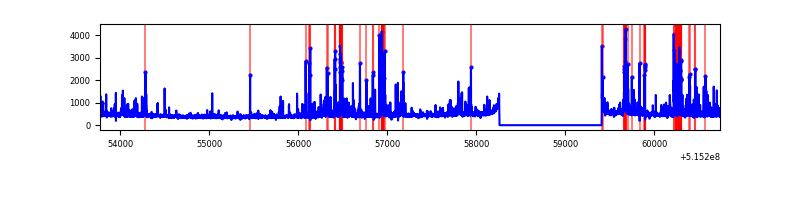 |
Top three noisy pixels from each quadrant. If the there are fewer than three noisy pixels in the level2.evt file, extra rows are filled as -1
| Pixel properties | Quadrant properties | ||||||
|---|---|---|---|---|---|---|---|
| Quadrant | DetID | PixID | Counts | Sigma | Mean | Median | Sigma |
| A | 8 | 4 | 348007 | 2246.94 | 631 | 615 | 154.6 |
| A | 13 | 248 | 16547 | 103.05 | 631 | 615 | 154.6 |
| A | 5 | 241 | 14362 | 88.92 | 631 | 615 | 154.6 |
| B | 5 | 185 | 217505 | 1638.54 | 620 | 598 | 132.4 |
| B | 7 | 0 | 198940 | 1498.3 | 620 | 598 | 132.4 |
| B | 7 | 252 | 47778 | 356.4 | 620 | 598 | 132.4 |
| C | 15 | 224 | 1079438 | 6597.47 | 597 | 591 | 163.5 |
| C | 6 | 223 | 100328 | 609.92 | 597 | 591 | 163.5 |
| C | 14 | 254 | 75711 | 459.38 | 597 | 591 | 163.5 |
| D | 3 | 224 | 249401 | 1472.89 | 598 | 571 | 168.9 |
| D | 3 | 12 | 193775 | 1143.63 | 598 | 571 | 168.9 |
| D | 8 | 240 | 94750 | 557.47 | 598 | 571 | 168.9 |
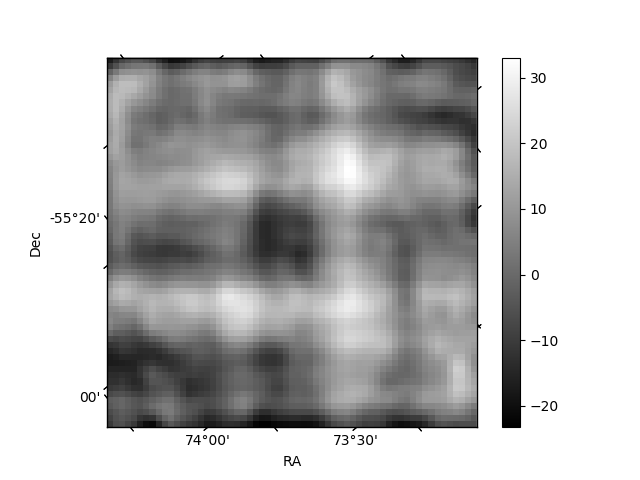
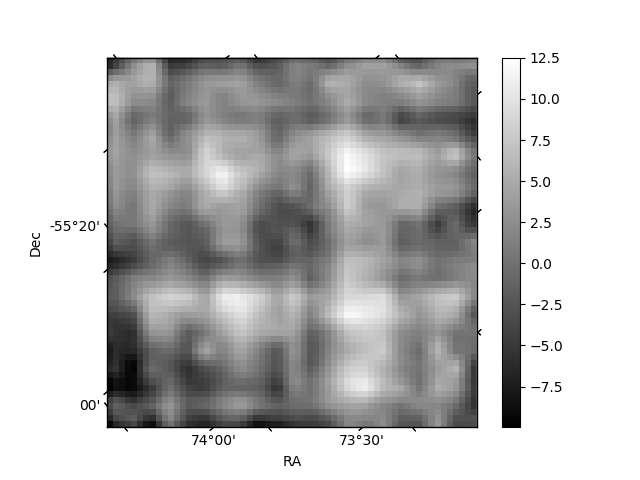
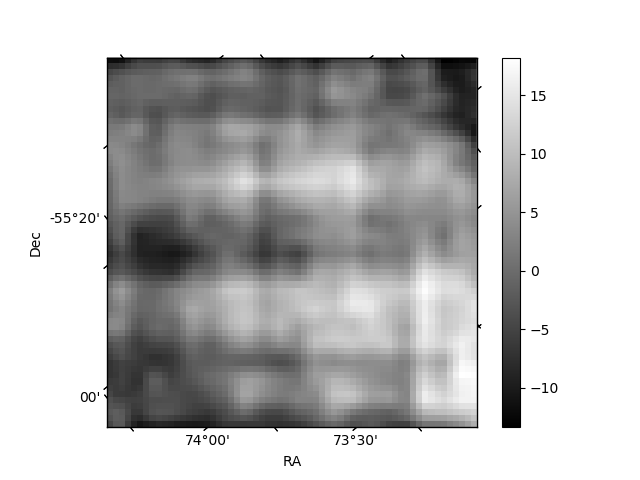
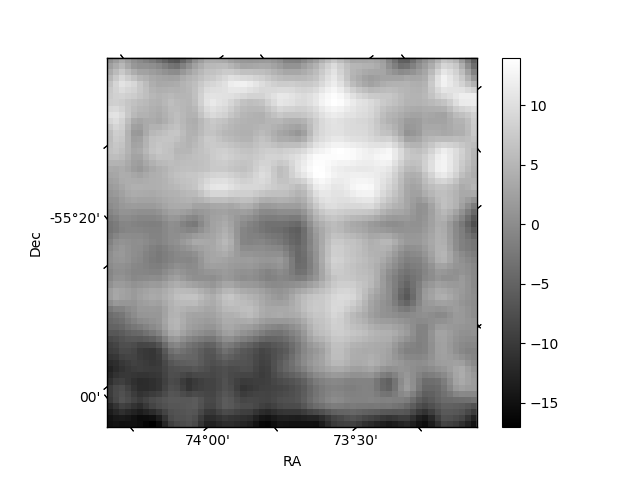
Histogram calculated using DETX and DETY for each event in the final _common_clean file
| Quadrant A | 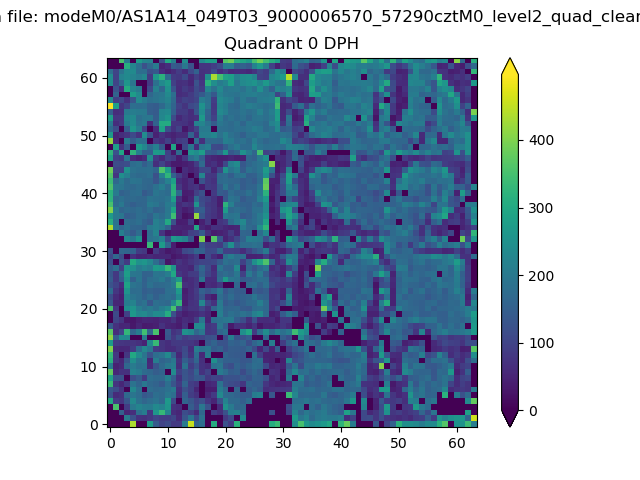 |
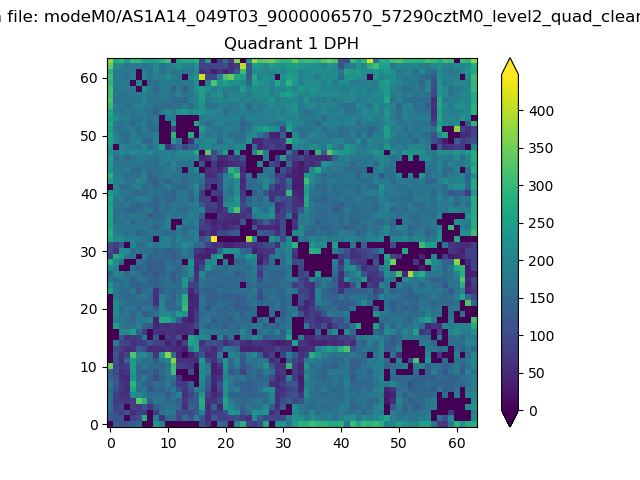 |
Quadrant B |
|---|---|---|---|
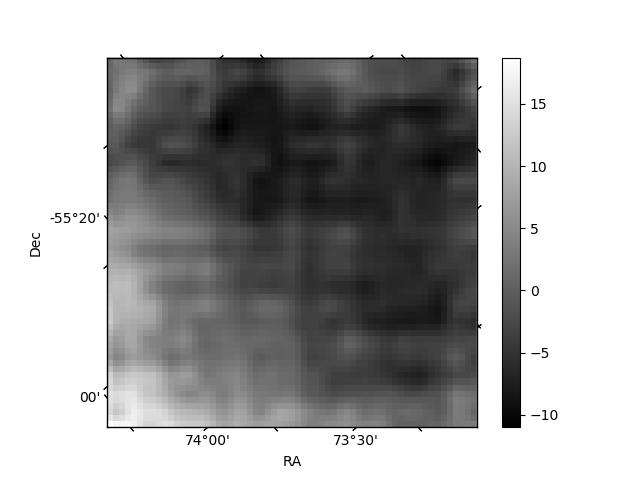
| Quadrant D | 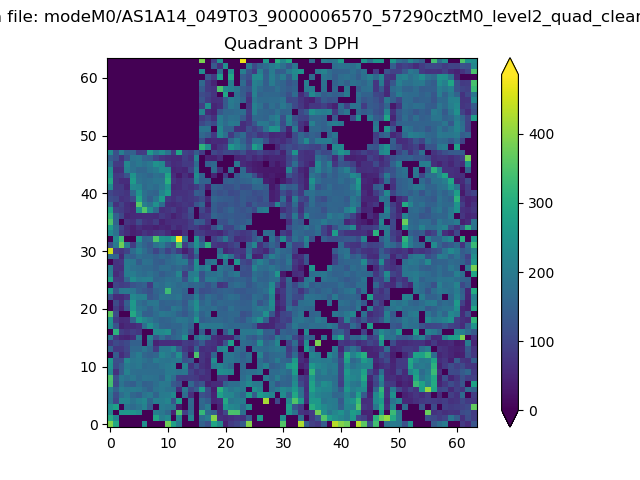 |
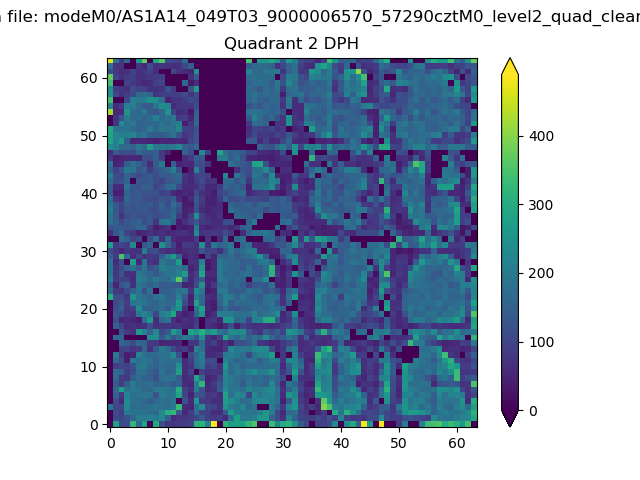 |
Quadrant C |
| Plot type | Count rate plots | Images |
|---|---|---|
| Comparison with Poisson distribution Blue bars denote a histogram of data divided into 1 sec bins. Red curve is a Poisson curve with rate = median count rate of data. |
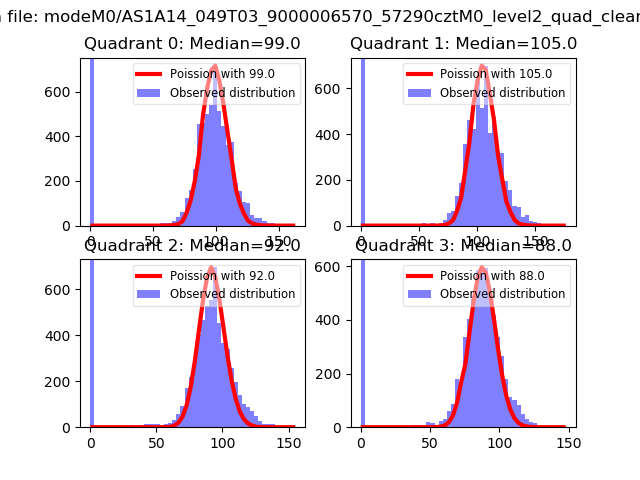 |
 |
| Quadrant-wise count rates Data is divided into 100 sec bins |
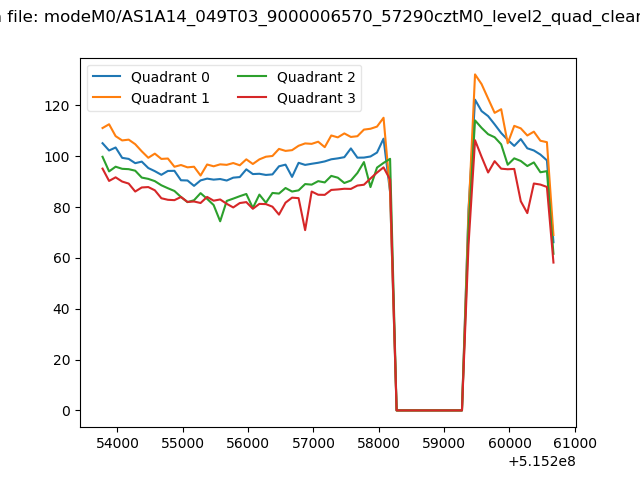 |
|
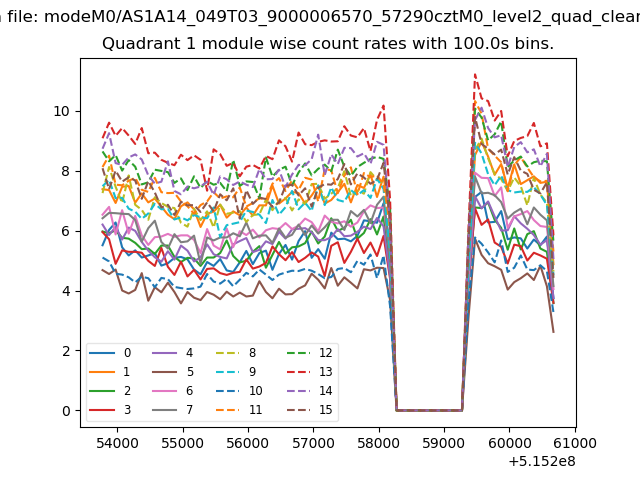
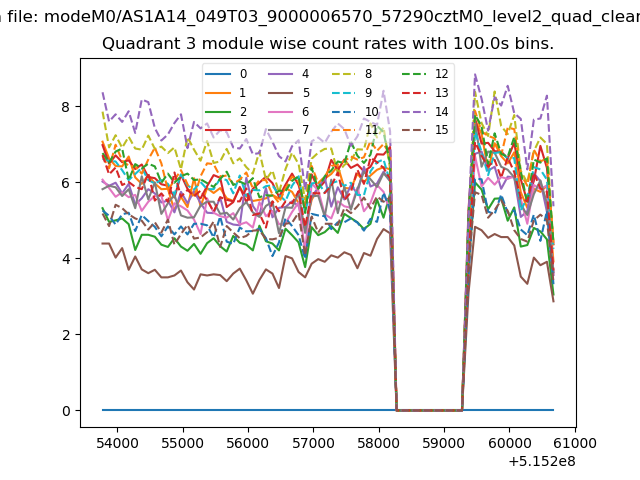
| Module-wise count rates for Quadrant A Data is divided into 100 sec bins |
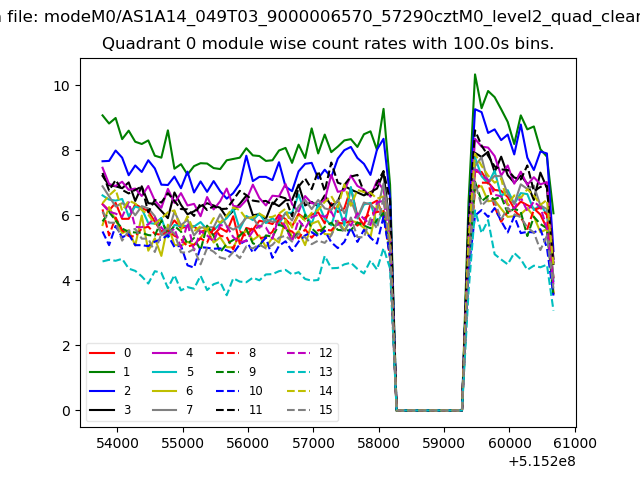 |
 |
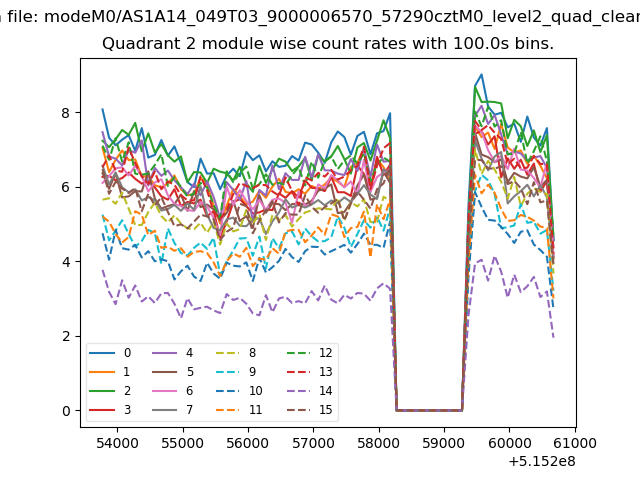
| Module-wise count rates for Quadrant B Data is divided into 100 sec bins |
 |
 |
| Module-wise count rates for Quadrant C Data is divided into 100 sec bins |
 |
 |
| Module-wise count rates for Quadrant D Data is divided into 100 sec bins |
 |
 |
| Parameter | Plot |
|---|---|
| CZT HV Monitor | 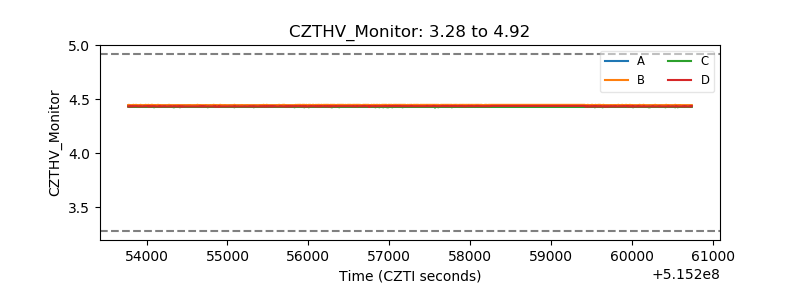 |
| D_VDD | 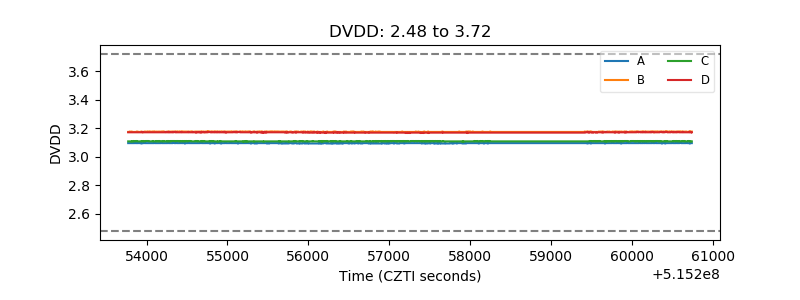 |
| Temperature 1 | 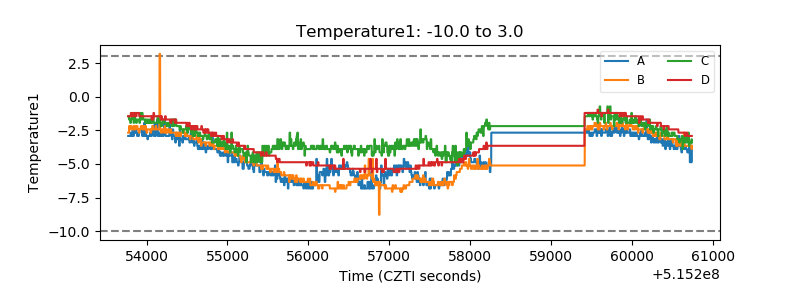 |
| Veto HV Monitor | 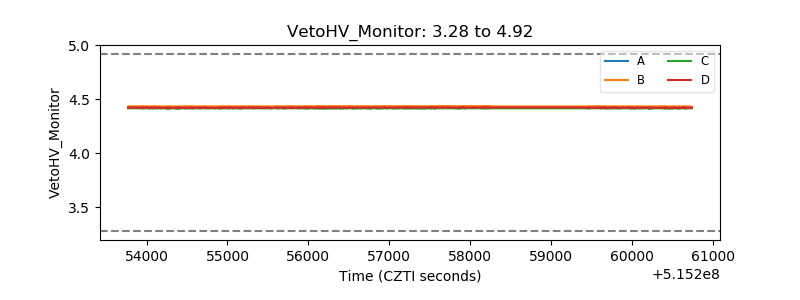 |
| Veto LLD | 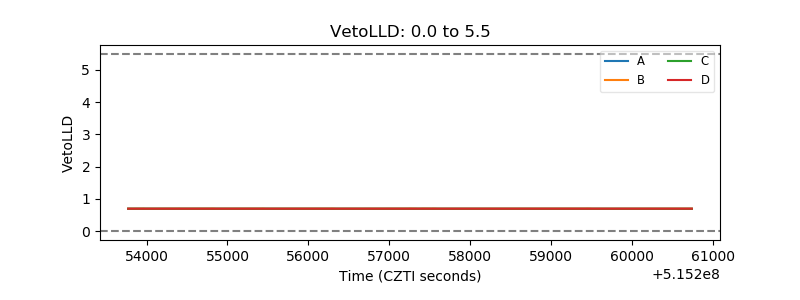 |
| Alpha Counter | 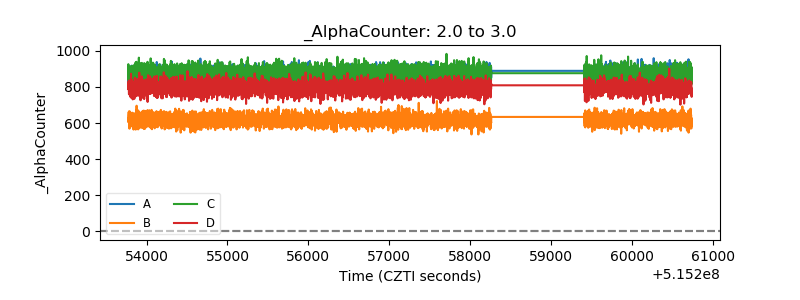 |
| _CPM_Rate | 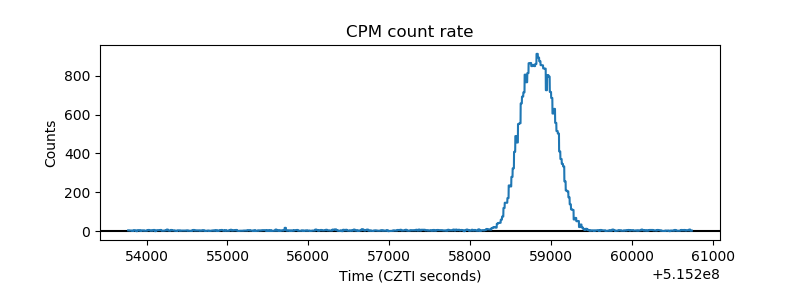 |
| CZT Counter | 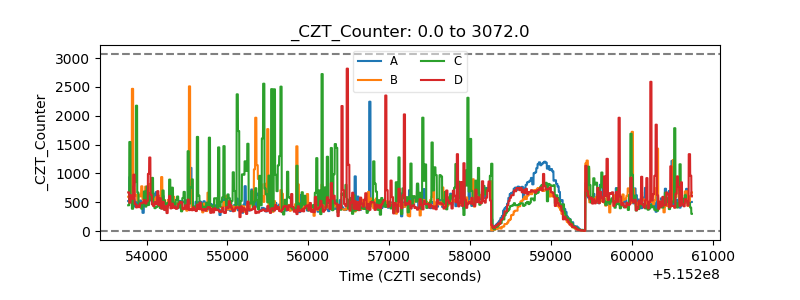 |
| +2.5 Volts monitor |  |
| +5 Volts monitor |  |
| _ROLL_ROT | 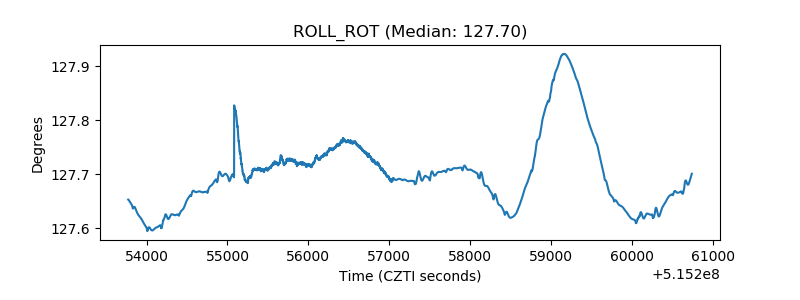 |
| _Roll_DEC | 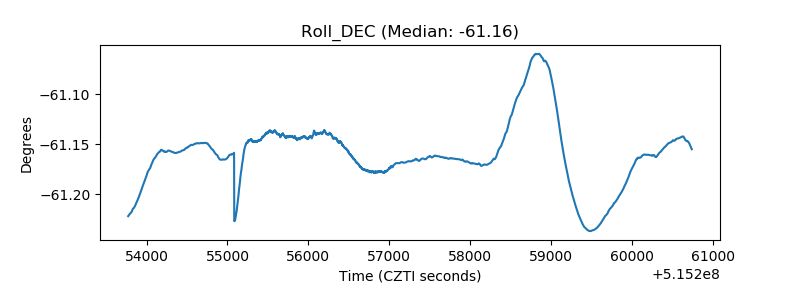 |
| _Roll_RA | 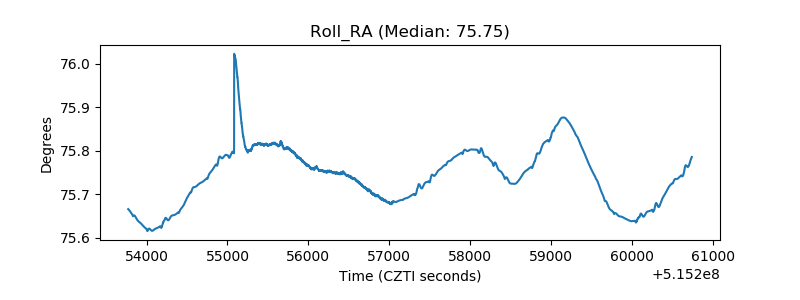 |
| Veto Counter | 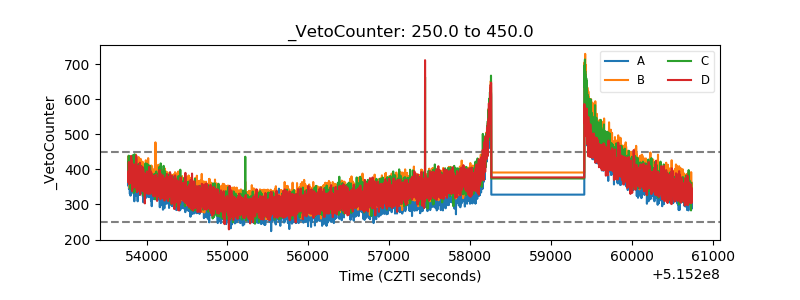 |