| Param | Original file | Final file |
|---|---|---|
| Filename | modeM0/AS1A14_049T03_9000006570_57291cztM0_level2.fits | modeM0/AS1A14_049T03_9000006570_57291cztM0_level2_quad_clean.evt |
| Size (bytes) | 426,798,720 | 96,091,200 |
| Size | 407.0 MB | 91.6 MB |
| Events in quadrant A | 3,403,728 | 641,830 |
| Events in quadrant B | 3,223,639 | 689,015 |
| Events in quadrant C | 4,050,410 | 594,983 |
| Events in quadrant D | 4,631,218 | 544,221 |
| Mode M0 | |||
|---|---|---|---|
| Quadrant | BADHDUFLAG | Total packets | Discarded packets |
| A | 0 | 14241 | 2 |
| B | 0 | 13825 | 3 |
| C | 0 | 16461 | 2 |
| D | 0 | 18138 | 2 |
| Mode M9 | |||
|---|---|---|---|
| Quadrant | BADHDUFLAG | Total packets | Discarded packets |
| A | 0 | 15 | 0 |
| B | 0 | 16 | 0 |
| C | 0 | 16 | 0 |
| D | 0 | 16 | 0 |
| Mode SS | |||
|---|---|---|---|
| Quadrant | BADHDUFLAG | Total packets | Discarded packets |
| A | 0 | 128 | 0 |
| B | 0 | 128 | 0 |
| C | 0 | 128 | 0 |
| D | 0 | 128 | 0 |
| Quadrant | Total seconds | Saturated seconds | Saturation percentage |
|---|---|---|---|
| A | 6302 | 63 | 0.999683% |
| B | 6301 | 74 | 1.174417% |
| C | 6301 | 171 | 2.713855% |
| D | 6301 | 372 | 5.903825% |
Noise dominated data is calculated using 1-second bins in cleaned event files. If a bin has >2000 counts, and if more than 50% of those come from <1% of pixels, then it is considered to be noise-dominated and hence unusable.
| Quadrant | # 1 sec bins | Bins with >0 counts | Bins with >2000 counts | High rate bins dominated by noise | Noise dominated (total time) | Noise dominated (detector-on time) | Marked lightcurve |
|---|---|---|---|---|---|---|---|
| A | 7507 | 6303 | 24 | 24 | 0.32% | 0.38% | 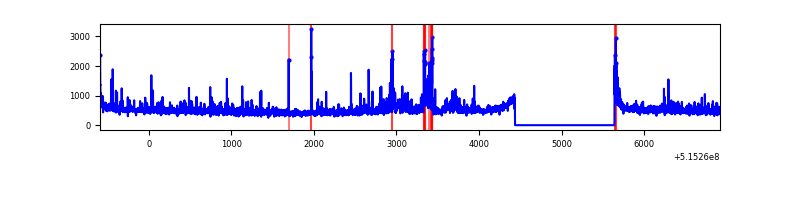 |
| B | 7506 | 6302 | 21 | 21 | 0.28% | 0.33% | 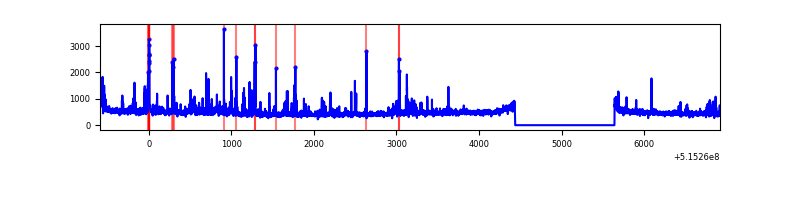 |
| C | 7506 | 6302 | 138 | 138 | 1.84% | 2.19% | 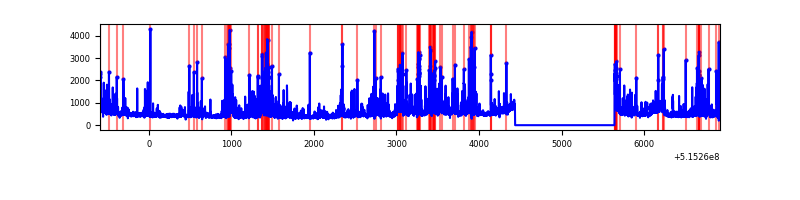 |
| D | 7506 | 6302 | 343 | 343 | 4.57% | 5.44% | 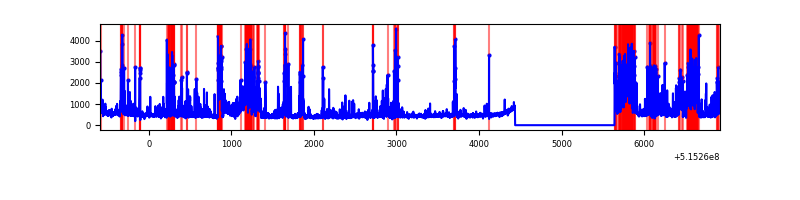 |
Top three noisy pixels from each quadrant. If the there are fewer than three noisy pixels in the level2.evt file, extra rows are filled as -1
| Pixel properties | Quadrant properties | ||||||
|---|---|---|---|---|---|---|---|
| Quadrant | DetID | PixID | Counts | Sigma | Mean | Median | Sigma |
| A | 8 | 4 | 375227 | 2161.07 | 701 | 684 | 173.3 |
| A | 3 | 14 | 242462 | 1395.03 | 701 | 684 | 173.3 |
| A | 4 | 3 | 14935 | 82.23 | 701 | 684 | 173.3 |
| B | 5 | 185 | 256304 | 1721.88 | 692 | 664 | 148.5 |
| B | 10 | 247 | 53004 | 352.54 | 692 | 664 | 148.5 |
| B | 7 | 252 | 35831 | 236.87 | 692 | 664 | 148.5 |
| C | 15 | 224 | 1018225 | 5664.61 | 661 | 656 | 179.6 |
| C | 6 | 223 | 117801 | 652.12 | 661 | 656 | 179.6 |
| C | 14 | 254 | 114173 | 631.93 | 661 | 656 | 179.6 |
| D | 3 | 12 | 837101 | 4481.65 | 653 | 622 | 186.6 |
| D | 3 | 224 | 791341 | 4236.47 | 653 | 622 | 186.6 |
| D | 8 | 240 | 209509 | 1119.16 | 653 | 622 | 186.6 |
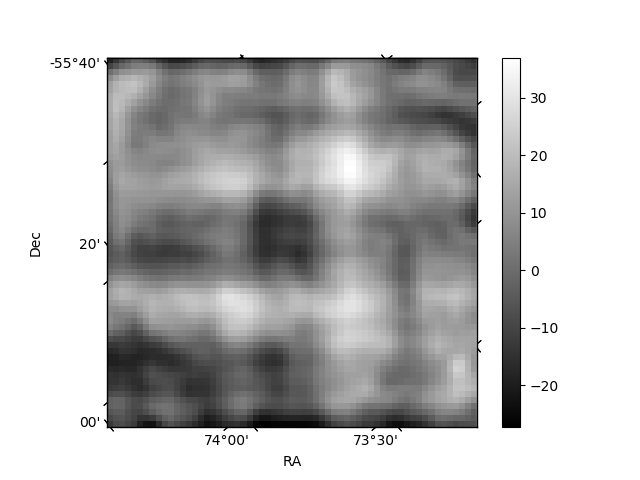
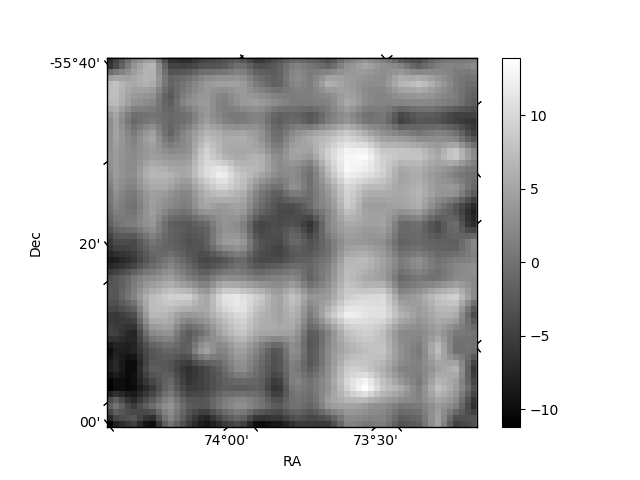
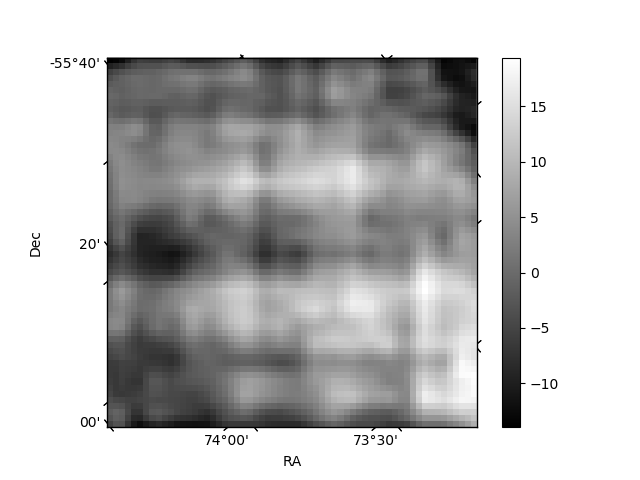
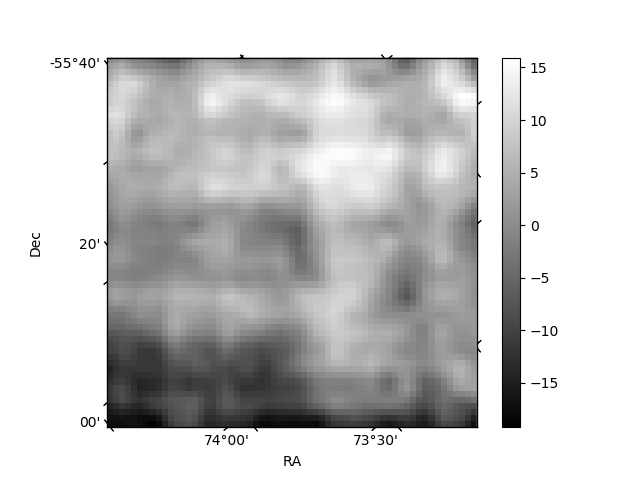
Histogram calculated using DETX and DETY for each event in the final _common_clean file
| Quadrant A | 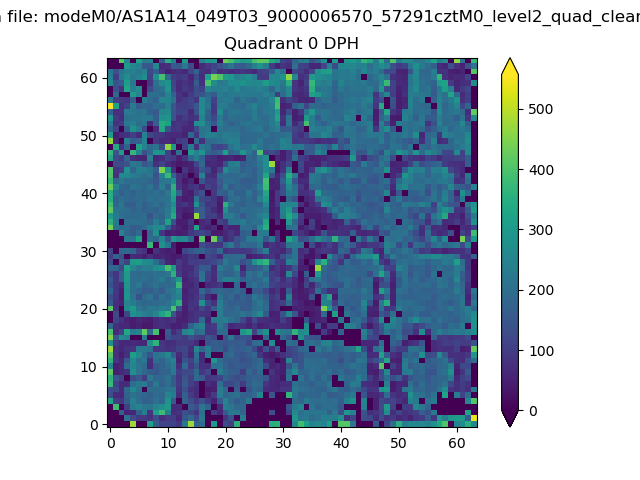 |
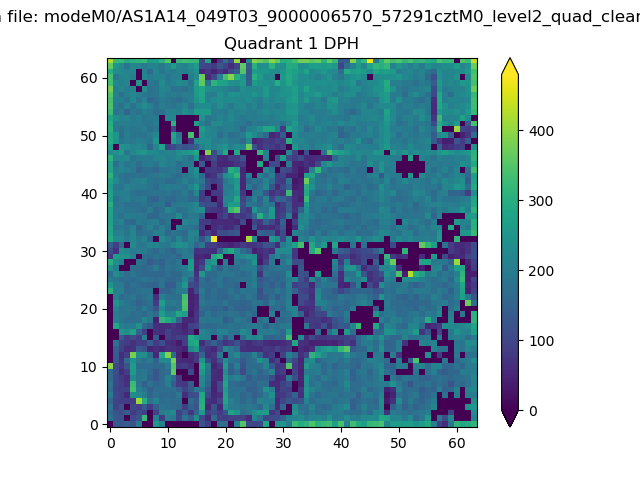 |
Quadrant B |
|---|---|---|---|
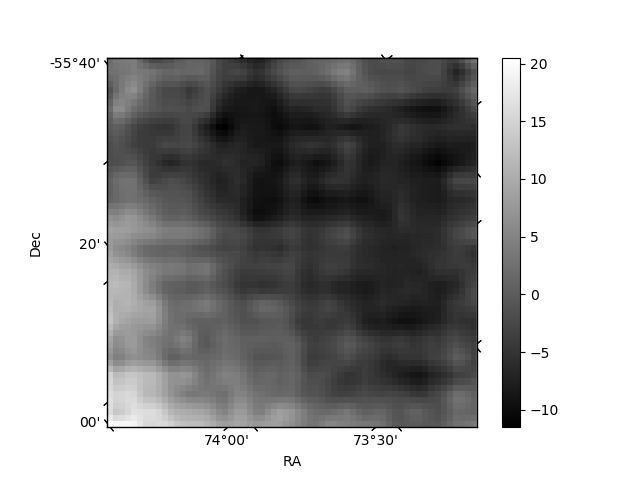
| Quadrant D | 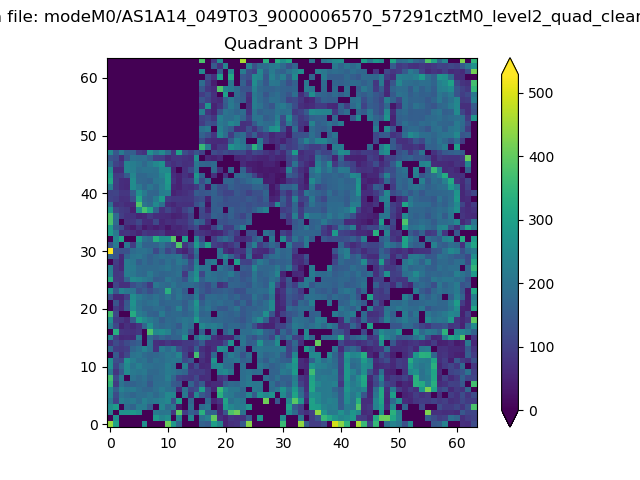 |
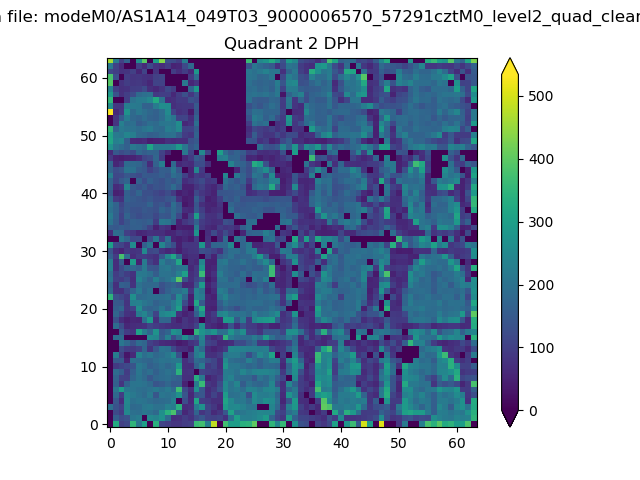 |
Quadrant C |
| Plot type | Count rate plots | Images |
|---|---|---|
| Comparison with Poisson distribution Blue bars denote a histogram of data divided into 1 sec bins. Red curve is a Poisson curve with rate = median count rate of data. |
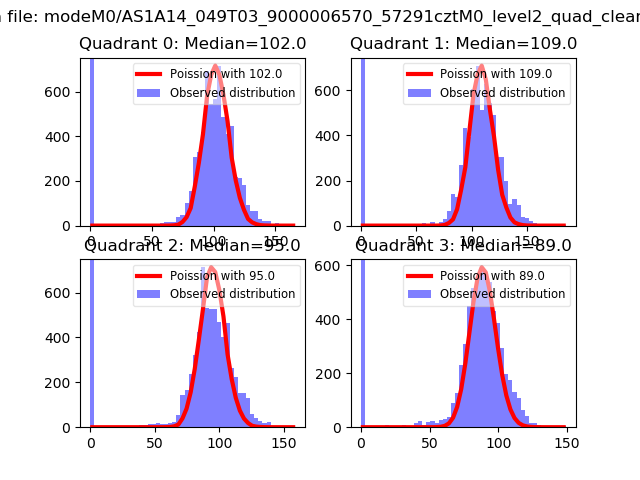 |
 |
| Quadrant-wise count rates Data is divided into 100 sec bins |
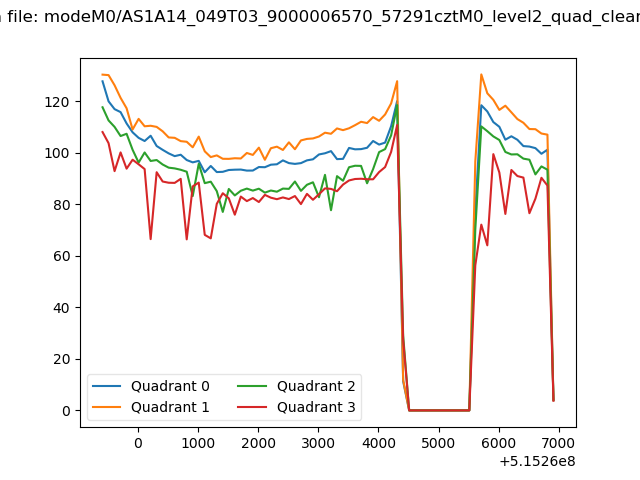 |
|
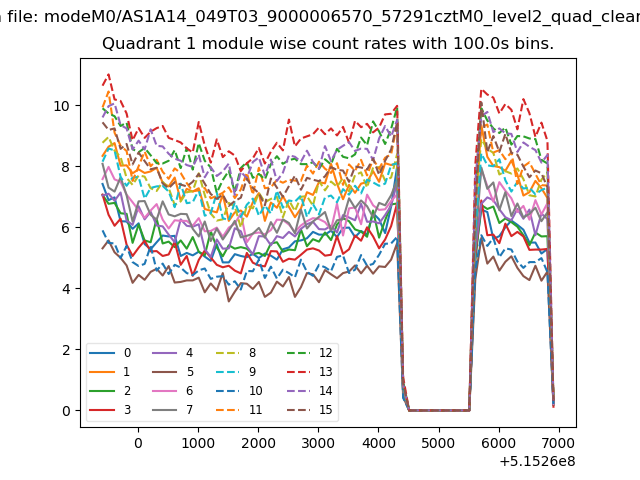
| Module-wise count rates for Quadrant A Data is divided into 100 sec bins |
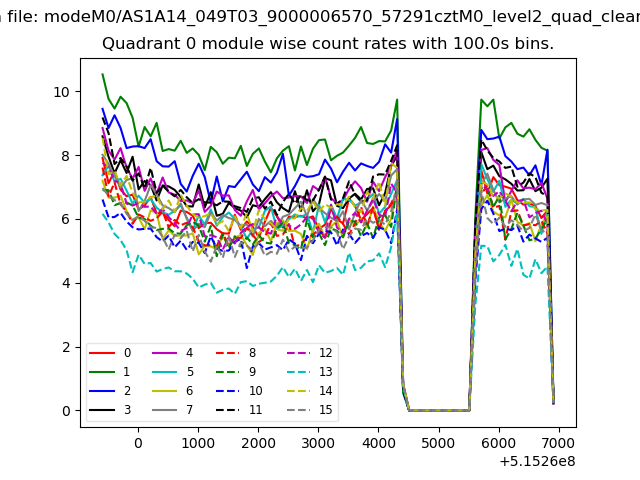 |
 |
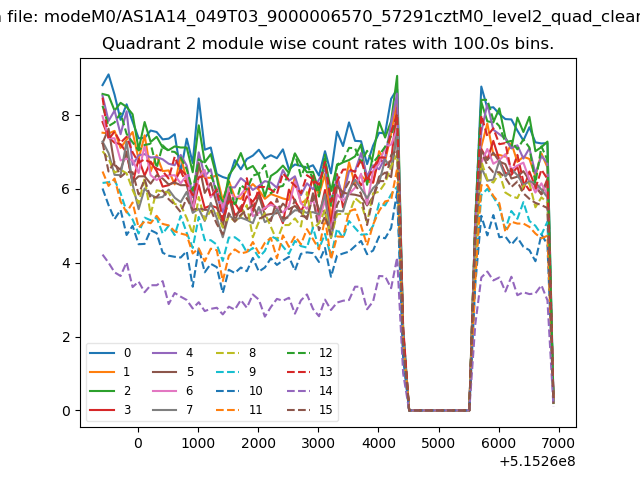
| Module-wise count rates for Quadrant B Data is divided into 100 sec bins |
 |
 |
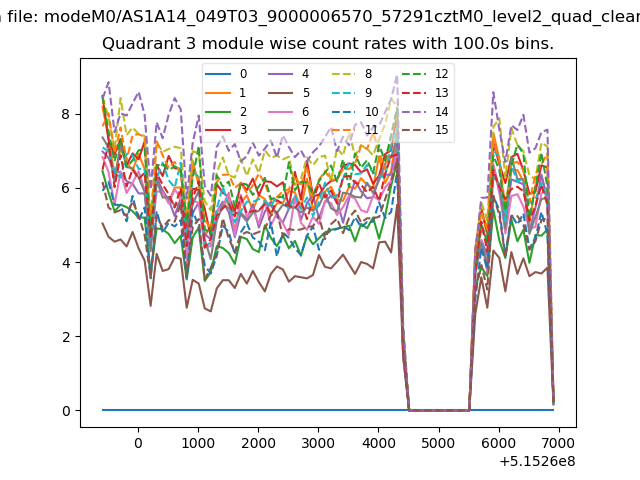
| Module-wise count rates for Quadrant C Data is divided into 100 sec bins |
 |
 |
| Module-wise count rates for Quadrant D Data is divided into 100 sec bins |
 |
 |
| Parameter | Plot |
|---|---|
| CZT HV Monitor | 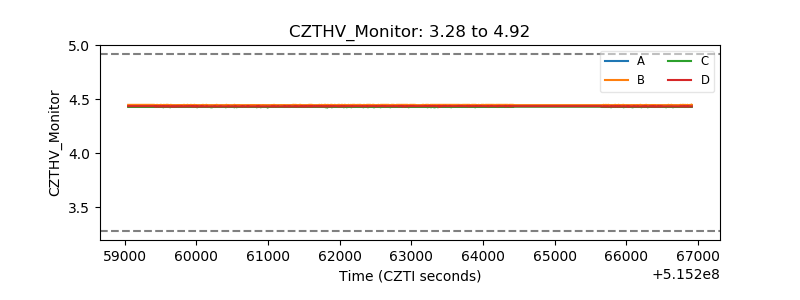 |
| D_VDD | 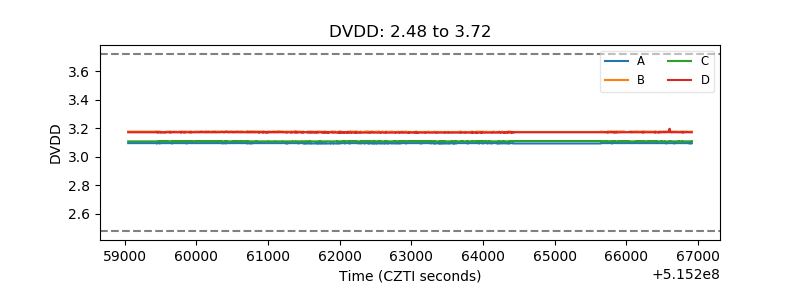 |
| Temperature 1 | 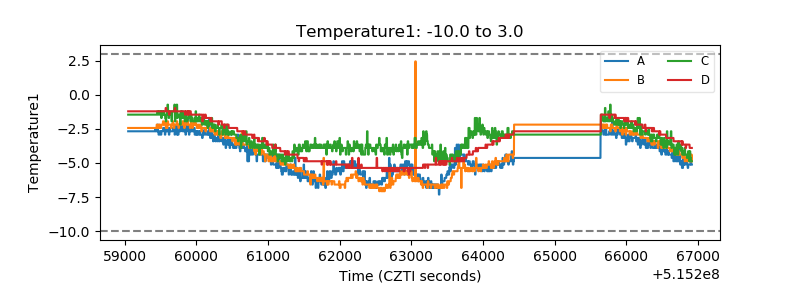 |
| Veto HV Monitor | 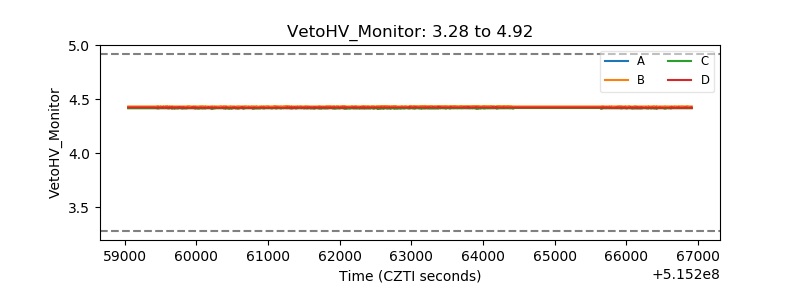 |
| Veto LLD | 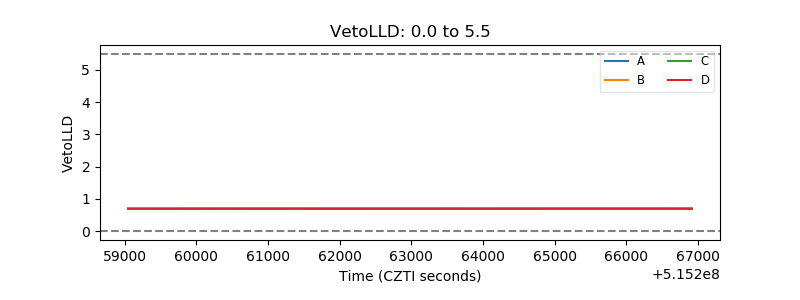 |
| Alpha Counter | 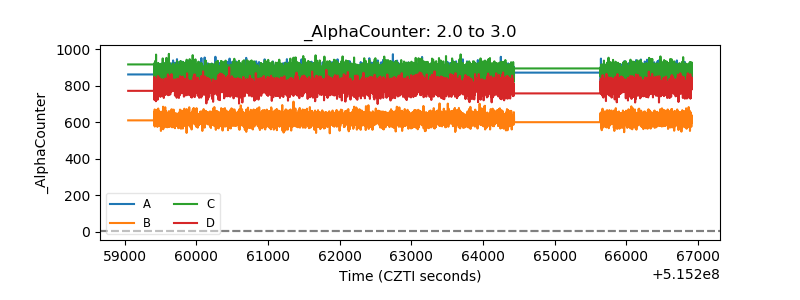 |
| _CPM_Rate | 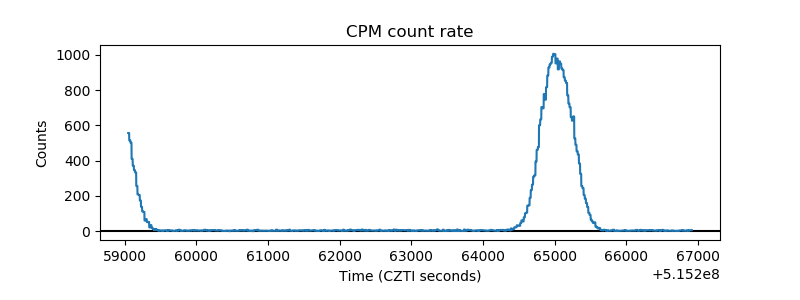 |
| CZT Counter | 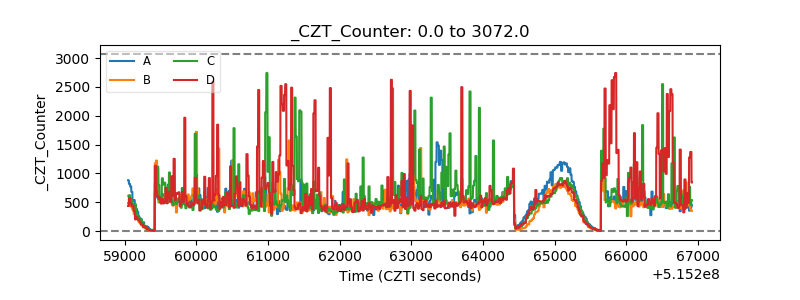 |
| +2.5 Volts monitor |  |
| +5 Volts monitor |  |
| _ROLL_ROT | 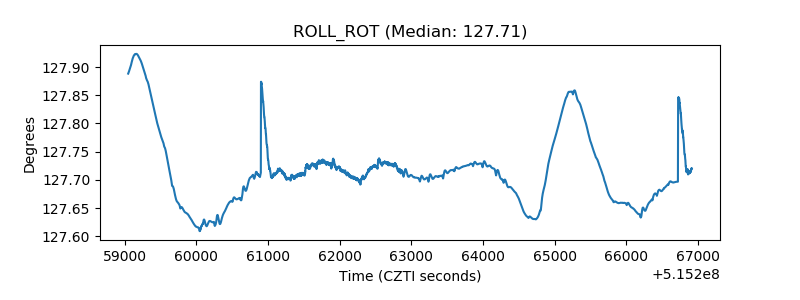 |
| _Roll_DEC | 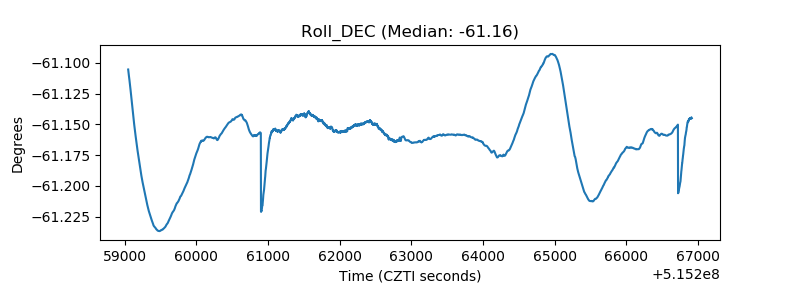 |
| _Roll_RA | 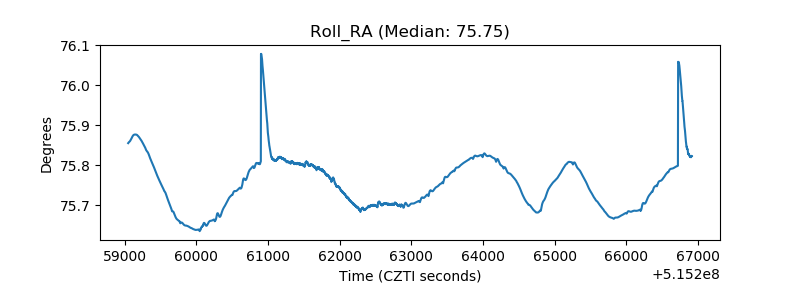 |
| Veto Counter | 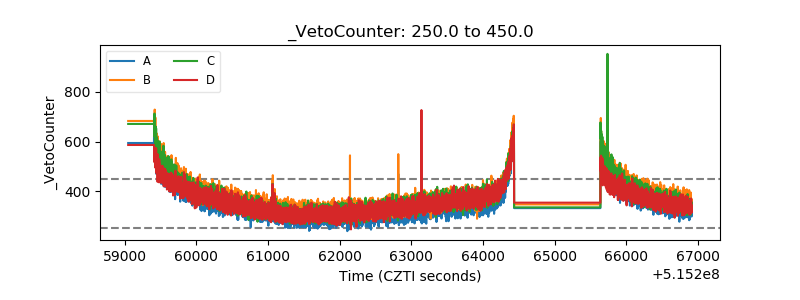 |