| Param | Original file | Final file |
|---|---|---|
| Filename | modeM0/AS1A14_049T03_9000006570_57293cztM0_level2.fits | modeM0/AS1A14_049T03_9000006570_57293cztM0_level2_quad_clean.evt |
| Size (bytes) | 316,745,280 | 61,315,200 |
| Size | 302.1 MB | 58.5 MB |
| Events in quadrant A | 2,360,045 | 420,500 |
| Events in quadrant B | 2,560,687 | 430,068 |
| Events in quadrant C | 2,727,921 | 369,665 |
| Events in quadrant D | 3,722,223 | 315,741 |
| Mode M0 | |||
|---|---|---|---|
| Quadrant | BADHDUFLAG | Total packets | Discarded packets |
| A | 0 | 13919 | 3716 |
| B | 0 | 15122 | 4291 |
| C | 0 | 16672 | 5460 |
| D | 0 | 25844 | 11882 |
| Mode M9 | |||
|---|---|---|---|
| Quadrant | BADHDUFLAG | Total packets | Discarded packets |
| A | 0 | 12 | 1 |
| B | 0 | 13 | 2 |
| C | 0 | 12 | 1 |
| D | 0 | 13 | 1 |
| Mode SS | |||
|---|---|---|---|
| Quadrant | BADHDUFLAG | Total packets | Discarded packets |
| A | 0 | 131 | 26 |
| B | 0 | 131 | 27 |
| C | 0 | 132 | 36 |
| D | 0 | 131 | 29 |
| Quadrant | Total seconds | Saturated seconds | Saturation percentage |
|---|---|---|---|
| A | 4723 | 11 | 0.232903% |
| B | 4645 | 129 | 2.777180% |
| C | 4533 | 96 | 2.117803% |
| D | 4199 | 186 | 4.429626% |
Noise dominated data is calculated using 1-second bins in cleaned event files. If a bin has >2000 counts, and if more than 50% of those come from <1% of pixels, then it is considered to be noise-dominated and hence unusable.
| Quadrant | # 1 sec bins | Bins with >0 counts | Bins with >2000 counts | High rate bins dominated by noise | Noise dominated (total time) | Noise dominated (detector-on time) | Marked lightcurve |
|---|---|---|---|---|---|---|---|
| A | 7709 | 5576 | 4 | 4 | 0.05% | 0.07% | 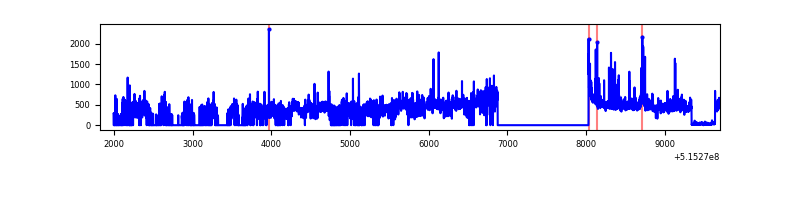 |
| B | 7881 | 5535 | 61 | 61 | 0.77% | 1.10% | 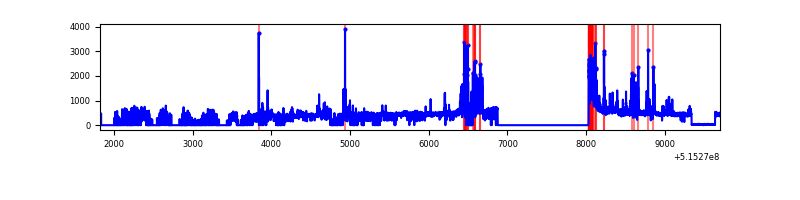 |
| C | 7881 | 5407 | 72 | 72 | 0.91% | 1.33% | 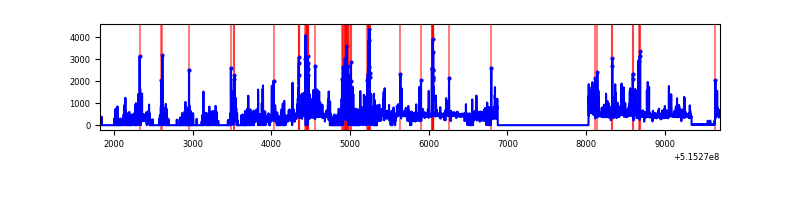 |
| D | 7692 | 4999 | 134 | 134 | 1.74% | 2.68% | 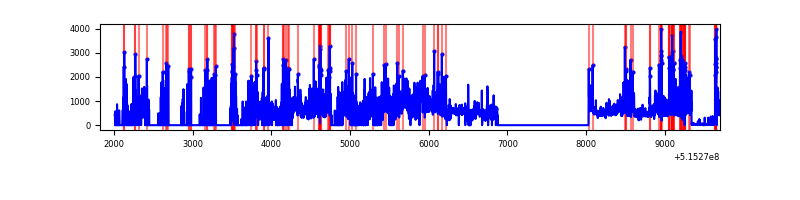 |
Top three noisy pixels from each quadrant. If the there are fewer than three noisy pixels in the level2.evt file, extra rows are filled as -1
| Pixel properties | Quadrant properties | ||||||
|---|---|---|---|---|---|---|---|
| Quadrant | DetID | PixID | Counts | Sigma | Mean | Median | Sigma |
| A | 8 | 4 | 296435 | 2314.35 | 512 | 500 | 127.9 |
| A | 3 | 14 | 67355 | 522.84 | 512 | 500 | 127.9 |
| A | 4 | 3 | 7996 | 58.62 | 512 | 500 | 127.9 |
| B | 5 | 185 | 257881 | 2429.45 | 491 | 473 | 106.0 |
| B | 10 | 16 | 128959 | 1212.67 | 491 | 473 | 106.0 |
| B | 0 | 63 | 84483 | 792.9 | 491 | 473 | 106.0 |
| C | 15 | 224 | 614711 | 4779.23 | 469 | 466 | 128.5 |
| C | 14 | 254 | 83768 | 648.14 | 469 | 466 | 128.5 |
| C | 6 | 223 | 68816 | 531.81 | 469 | 466 | 128.5 |
| D | 3 | 224 | 1704760 | 13986.59 | 430 | 410 | 121.9 |
| D | 8 | 240 | 134493 | 1100.34 | 430 | 410 | 121.9 |
| D | 3 | 12 | 89242 | 728.99 | 430 | 410 | 121.9 |
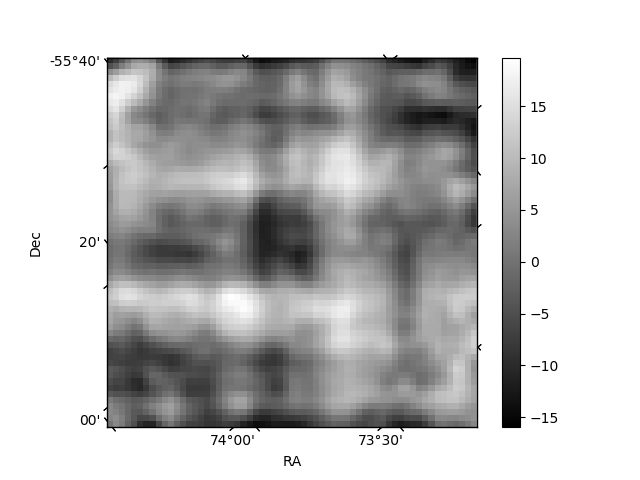
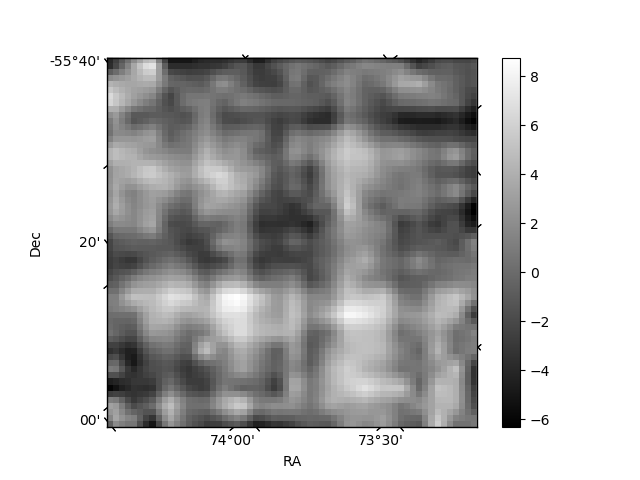
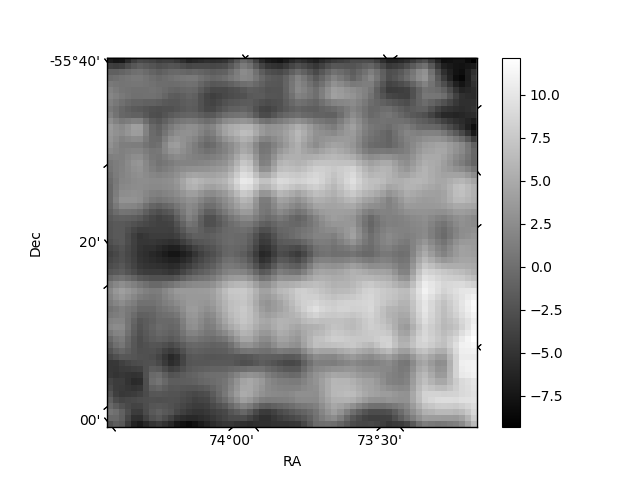
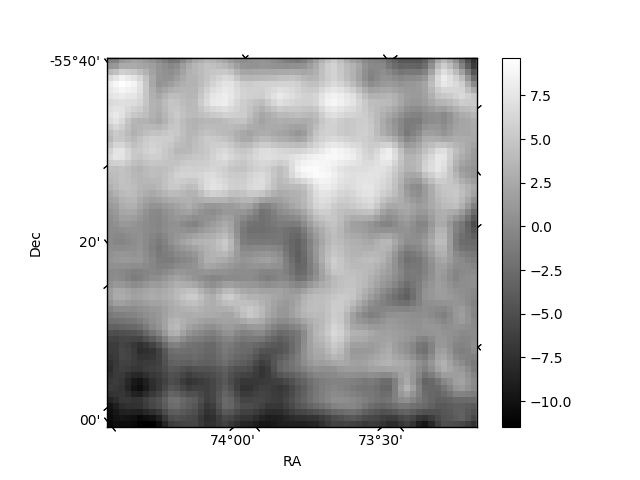
Histogram calculated using DETX and DETY for each event in the final _common_clean file
| Quadrant A | 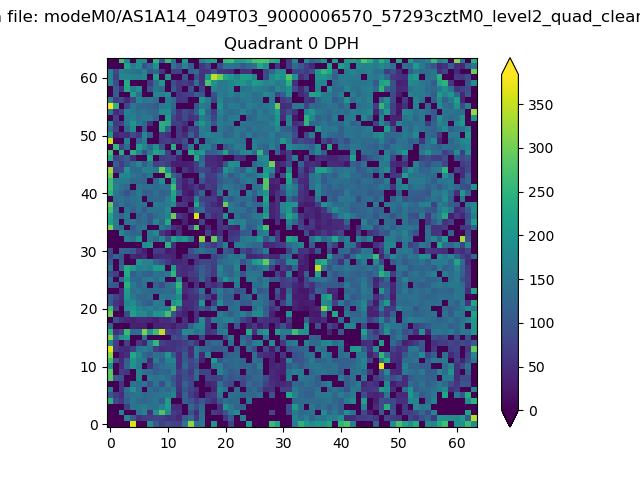 |
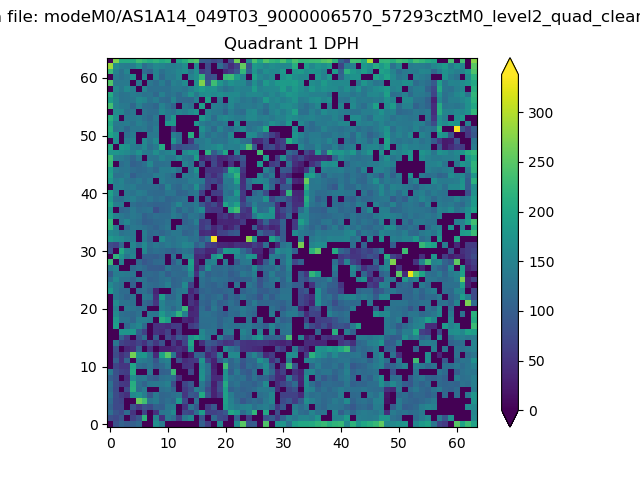 |
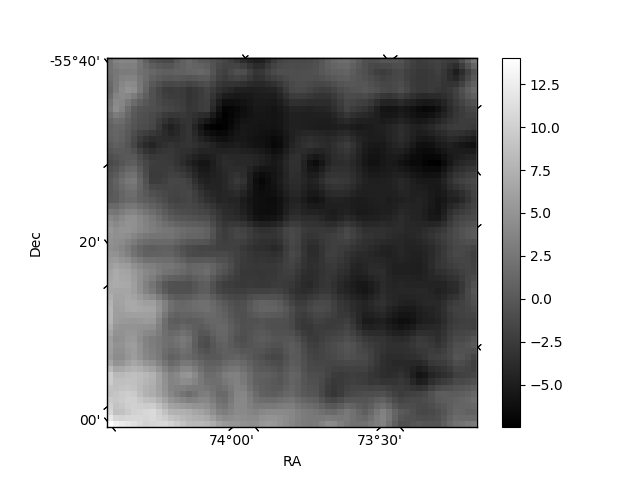
Quadrant B |
|---|---|---|---|
| Quadrant D | 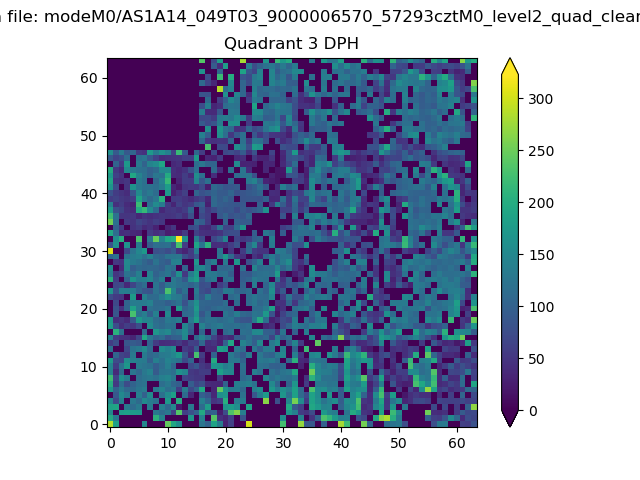 |
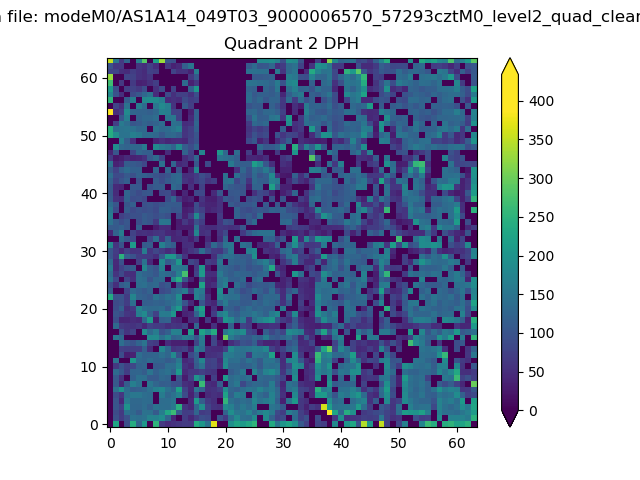 |
Quadrant C |
| Plot type | Count rate plots | Images |
|---|---|---|
| Comparison with Poisson distribution Blue bars denote a histogram of data divided into 1 sec bins. Red curve is a Poisson curve with rate = median count rate of data. |
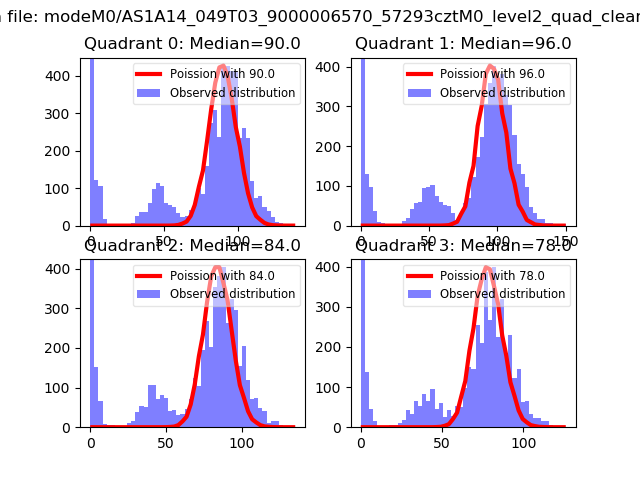 |
 |
| Quadrant-wise count rates Data is divided into 100 sec bins |
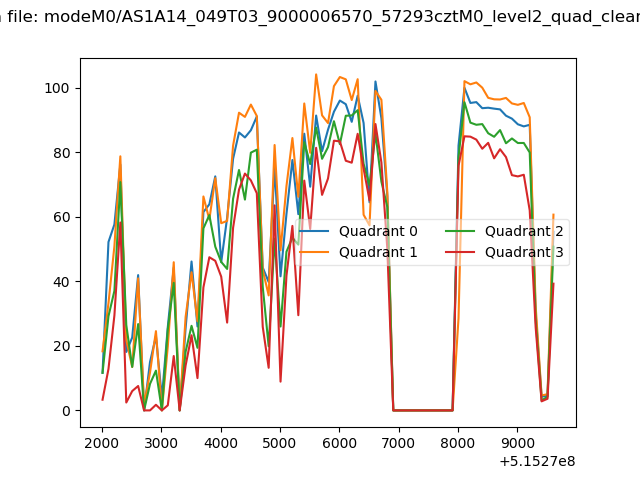 |
|
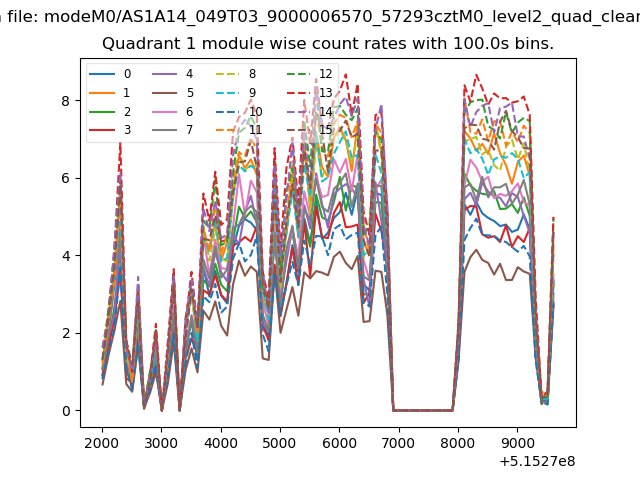
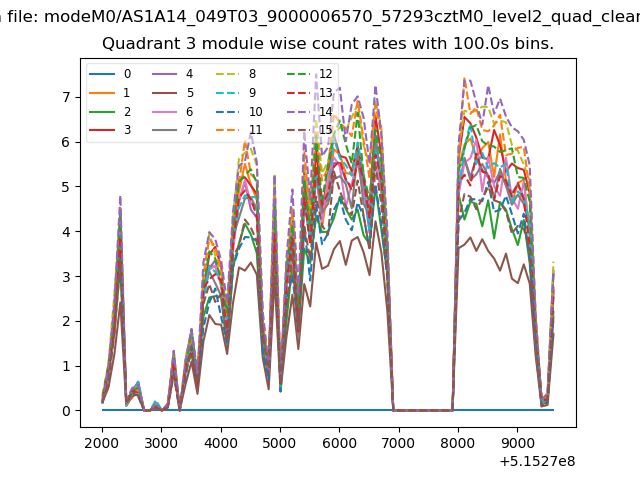
| Module-wise count rates for Quadrant A Data is divided into 100 sec bins |
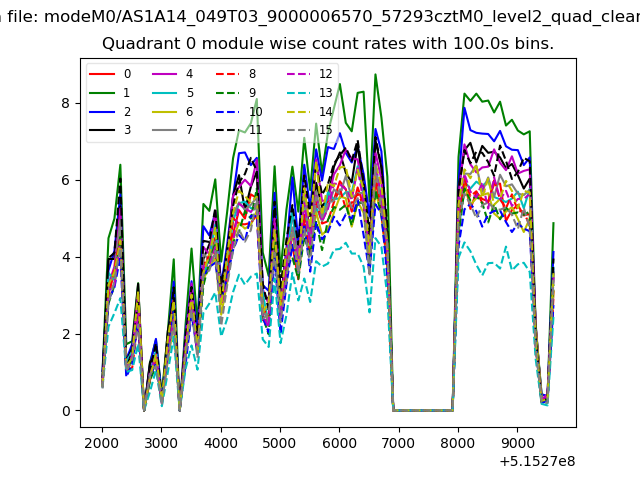 |
 |
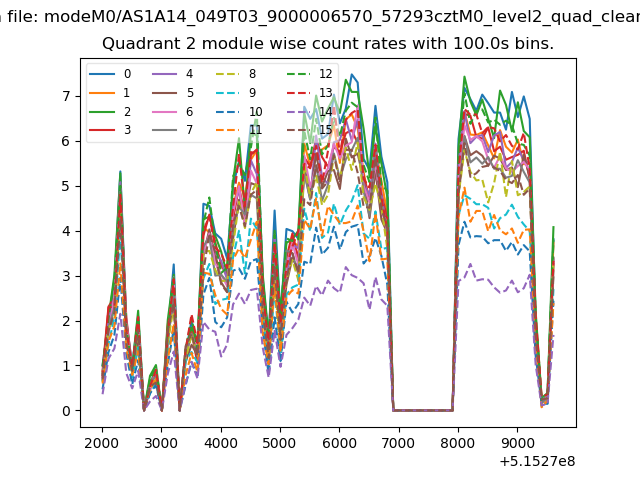
| Module-wise count rates for Quadrant B Data is divided into 100 sec bins |
 |
 |
| Module-wise count rates for Quadrant C Data is divided into 100 sec bins |
 |
 |
| Module-wise count rates for Quadrant D Data is divided into 100 sec bins |
 |
 |
| Parameter | Plot |
|---|---|
| CZT HV Monitor | 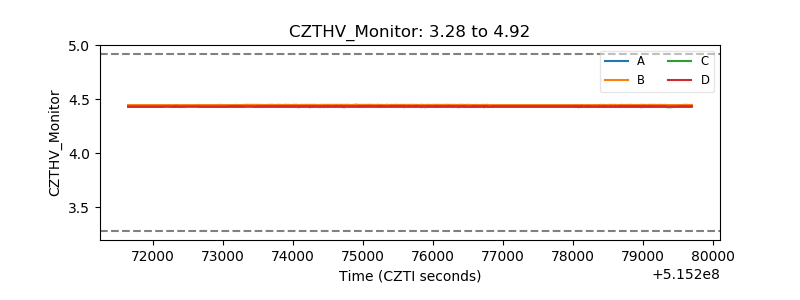 |
| D_VDD | 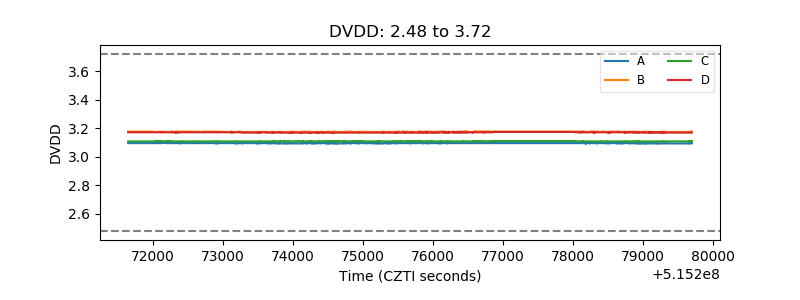 |
| Temperature 1 | 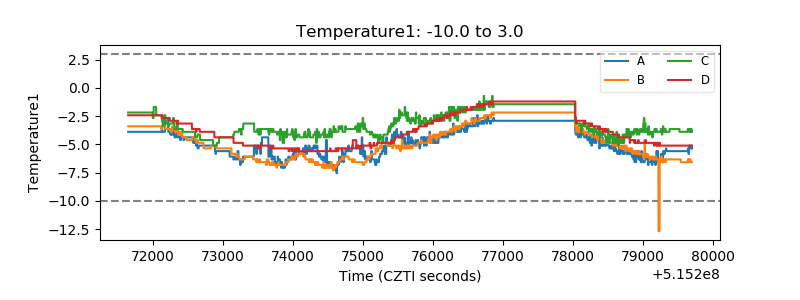 |
| Veto HV Monitor | 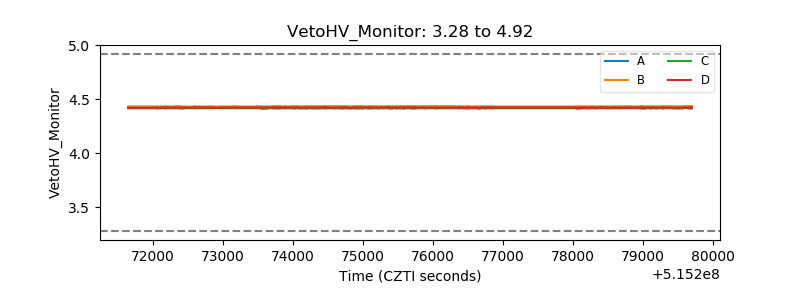 |
| Veto LLD | 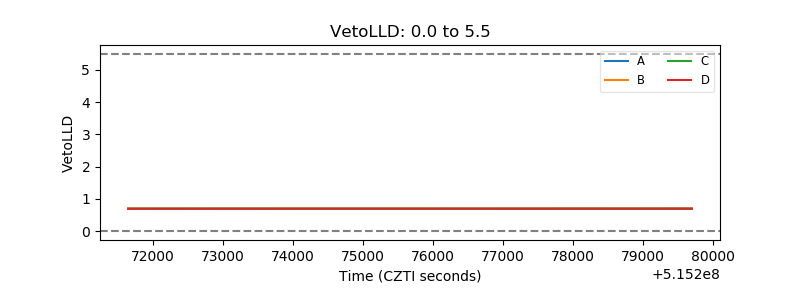 |
| Alpha Counter | 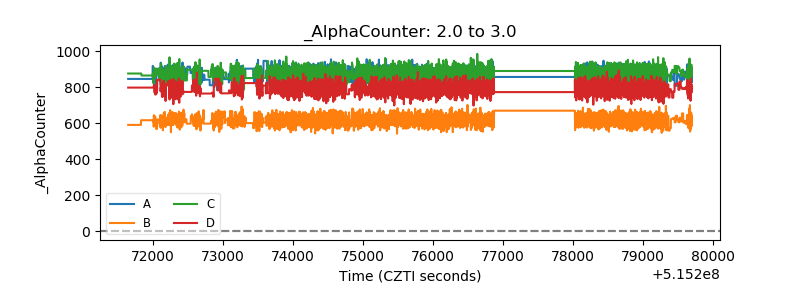 |
| _CPM_Rate | 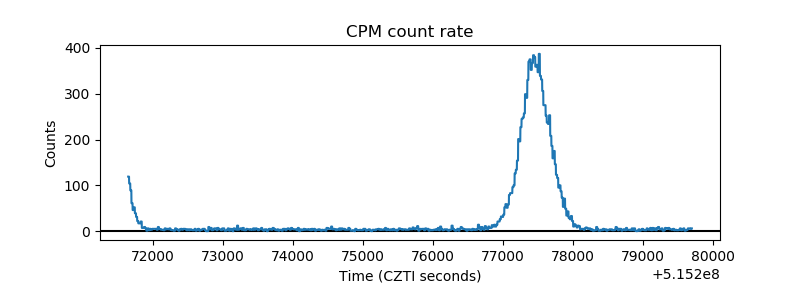 |
| CZT Counter | 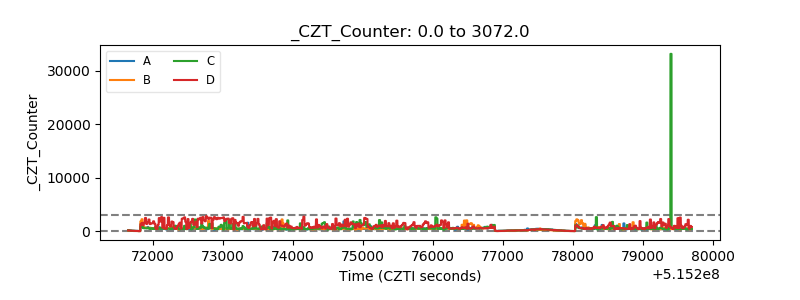 |
| +2.5 Volts monitor |  |
| +5 Volts monitor |  |
| _ROLL_ROT | 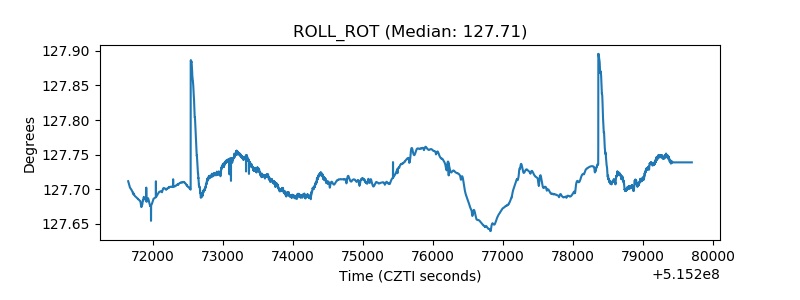 |
| _Roll_DEC | 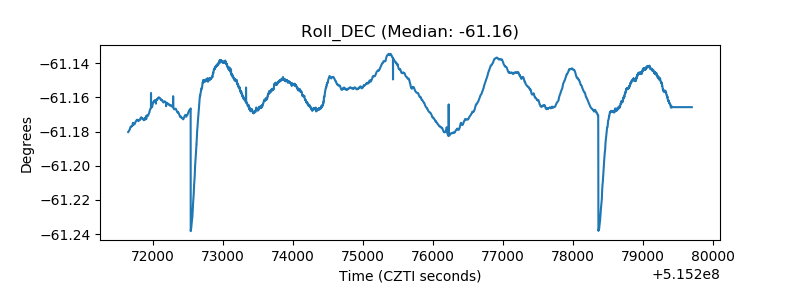 |
| _Roll_RA | 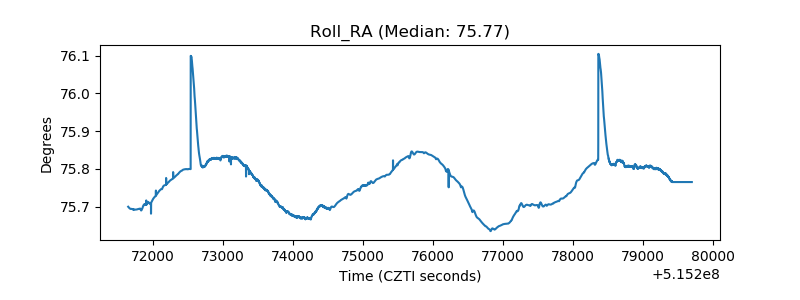 |
| Veto Counter | 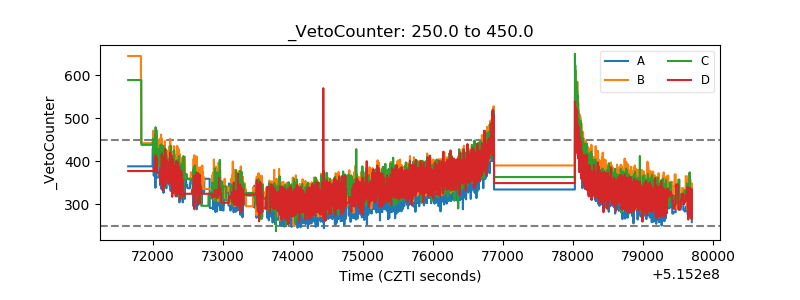 |