| Param | Original file | Final file |
|---|---|---|
| Filename | modeM0/AS1A14_049T03_9000006570_57294cztM0_level2.fits | modeM0/AS1A14_049T03_9000006570_57294cztM0_level2_quad_clean.evt |
| Size (bytes) | 445,705,920 | 87,301,440 |
| Size | 425.1 MB | 83.3 MB |
| Events in quadrant A | 3,395,198 | 564,987 |
| Events in quadrant B | 3,423,566 | 618,184 |
| Events in quadrant C | 4,211,528 | 517,582 |
| Events in quadrant D | 4,940,282 | 468,956 |
| Mode M0 | |||
|---|---|---|---|
| Quadrant | BADHDUFLAG | Total packets | Discarded packets |
| A | 0 | 14709 | 2 |
| B | 0 | 15007 | 2 |
| C | 0 | 17253 | 2 |
| D | 0 | 19426 | 2 |
| Mode M9 | |||
|---|---|---|---|
| Quadrant | BADHDUFLAG | Total packets | Discarded packets |
| A | 0 | 17 | 0 |
| B | 0 | 18 | 0 |
| C | 0 | 18 | 0 |
| D | 0 | 18 | 0 |
| Mode SS | |||
|---|---|---|---|
| Quadrant | BADHDUFLAG | Total packets | Discarded packets |
| A | 0 | 138 | 0 |
| B | 0 | 138 | 0 |
| C | 0 | 138 | 0 |
| D | 0 | 138 | 0 |
| Quadrant | Total seconds | Saturated seconds | Saturation percentage |
|---|---|---|---|
| A | 6792 | 29 | 0.426973% |
| B | 6792 | 130 | 1.914016% |
| C | 6792 | 200 | 2.944641% |
| D | 6792 | 343 | 5.050059% |
Noise dominated data is calculated using 1-second bins in cleaned event files. If a bin has >2000 counts, and if more than 50% of those come from <1% of pixels, then it is considered to be noise-dominated and hence unusable.
| Quadrant | # 1 sec bins | Bins with >0 counts | Bins with >2000 counts | High rate bins dominated by noise | Noise dominated (total time) | Noise dominated (detector-on time) | Marked lightcurve |
|---|---|---|---|---|---|---|---|
| A | 7969 | 7071 | 12 | 12 | 0.15% | 0.17% | 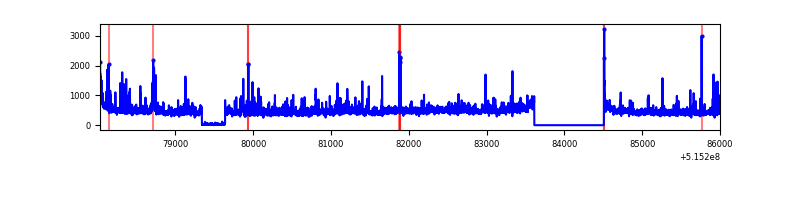 |
| B | 7969 | 7071 | 61 | 61 | 0.77% | 0.86% | 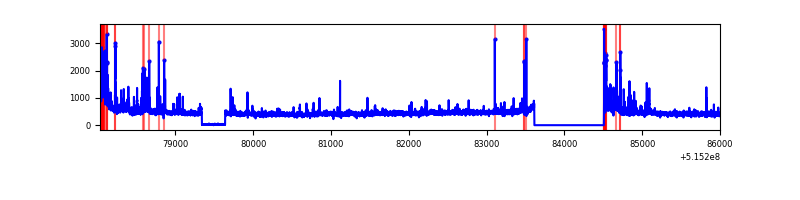 |
| C | 7969 | 7071 | 162 | 162 | 2.03% | 2.29% | 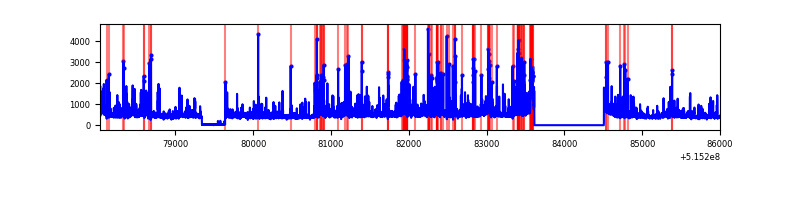 |
| D | 7969 | 7071 | 277 | 277 | 3.48% | 3.92% | 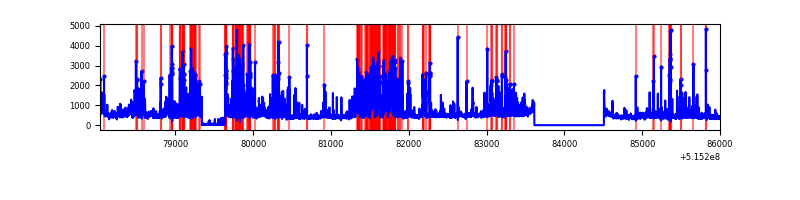 |
Top three noisy pixels from each quadrant. If the there are fewer than three noisy pixels in the level2.evt file, extra rows are filled as -1
| Pixel properties | Quadrant properties | ||||||
|---|---|---|---|---|---|---|---|
| Quadrant | DetID | PixID | Counts | Sigma | Mean | Median | Sigma |
| A | 8 | 4 | 415699 | 2328.35 | 726 | 707 | 178.2 |
| A | 3 | 14 | 122688 | 684.38 | 726 | 707 | 178.2 |
| A | 15 | 16 | 20839 | 112.95 | 726 | 707 | 178.2 |
| B | 10 | 16 | 156184 | 1004.44 | 714 | 688 | 154.8 |
| B | 7 | 252 | 141542 | 909.86 | 714 | 688 | 154.8 |
| B | 5 | 185 | 122171 | 784.73 | 714 | 688 | 154.8 |
| C | 15 | 224 | 1102167 | 5872.51 | 689 | 684 | 187.6 |
| C | 14 | 254 | 156687 | 831.72 | 689 | 684 | 187.6 |
| C | 6 | 223 | 62309 | 328.55 | 689 | 684 | 187.6 |
| D | 3 | 224 | 1588587 | 8168.97 | 683 | 650 | 194.4 |
| D | 8 | 240 | 282589 | 1450.41 | 683 | 650 | 194.4 |
| D | 3 | 12 | 106359 | 543.81 | 683 | 650 | 194.4 |
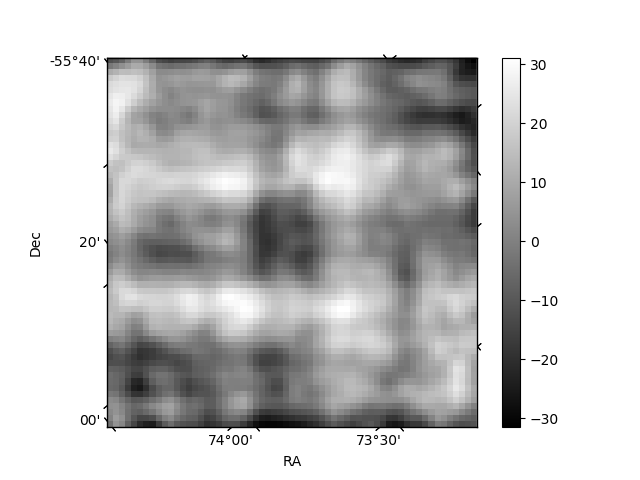
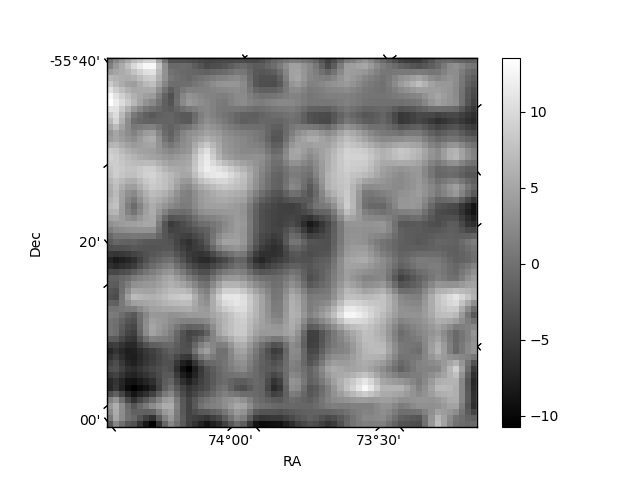
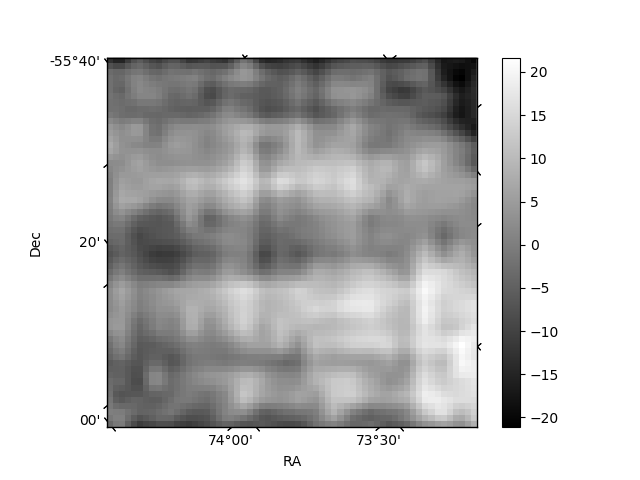
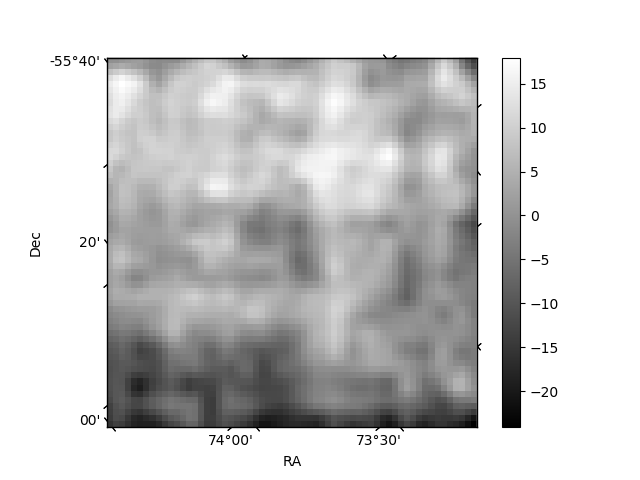
Histogram calculated using DETX and DETY for each event in the final _common_clean file
| Quadrant A | 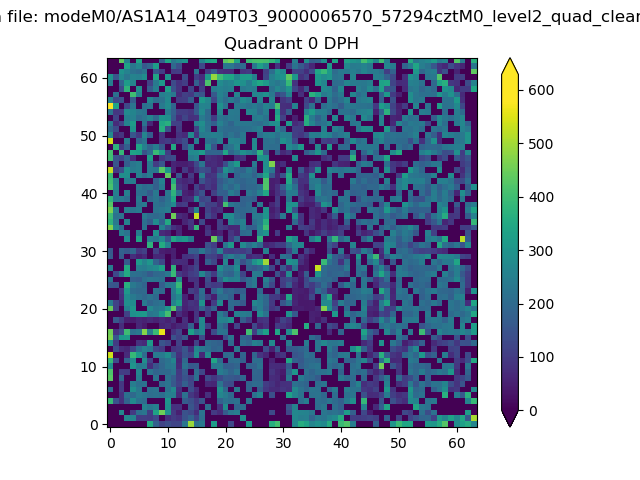 |
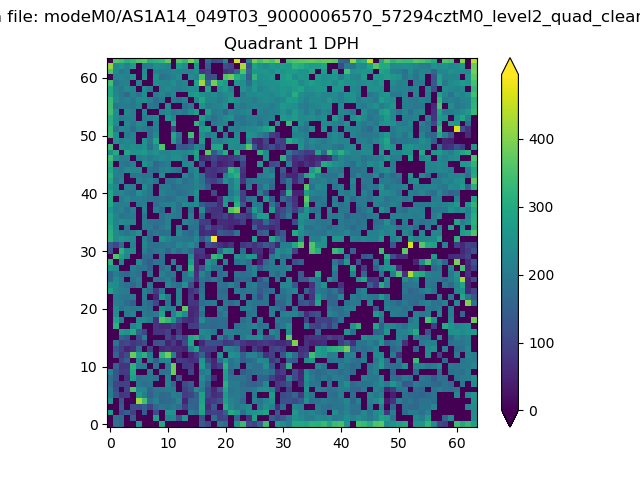 |
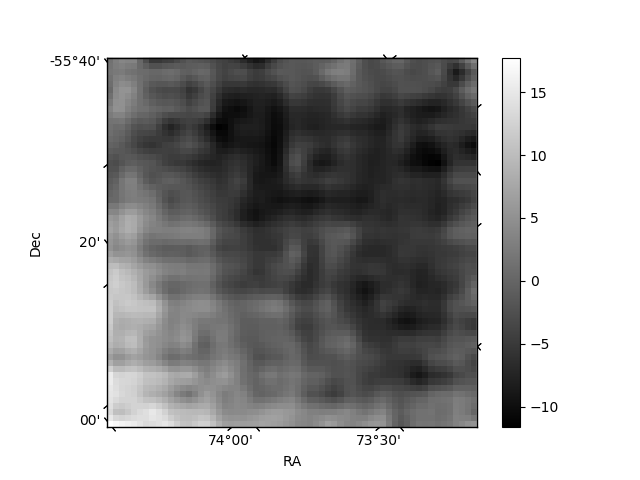
Quadrant B |
|---|---|---|---|
| Quadrant D | 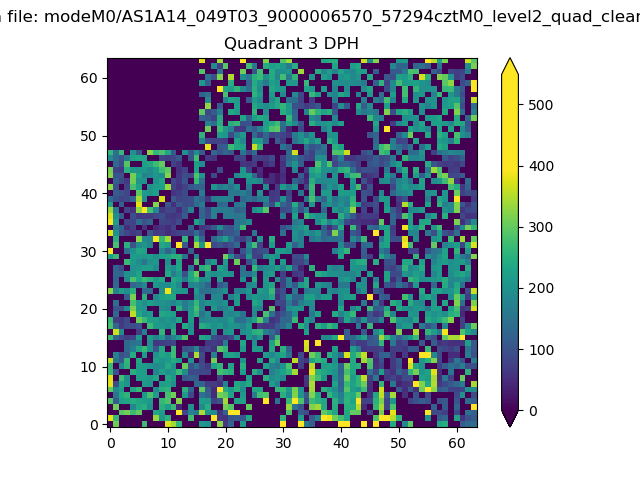 |
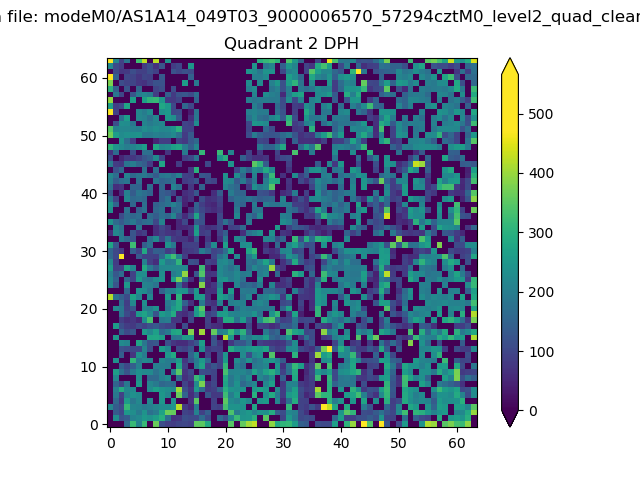 |
Quadrant C |
| Plot type | Count rate plots | Images |
|---|---|---|
| Comparison with Poisson distribution Blue bars denote a histogram of data divided into 1 sec bins. Red curve is a Poisson curve with rate = median count rate of data. |
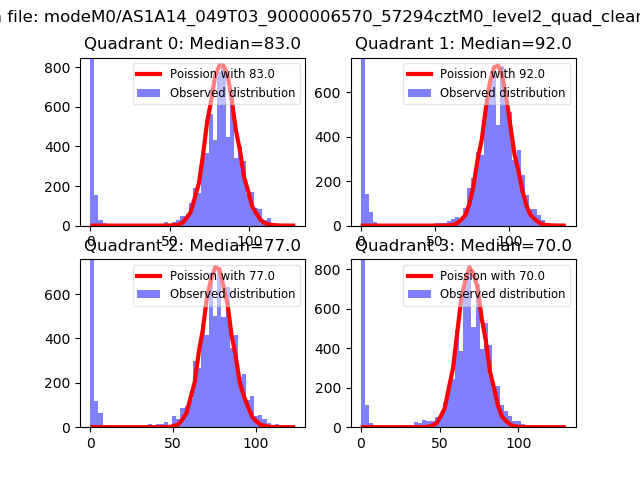 |
 |
| Quadrant-wise count rates Data is divided into 100 sec bins |
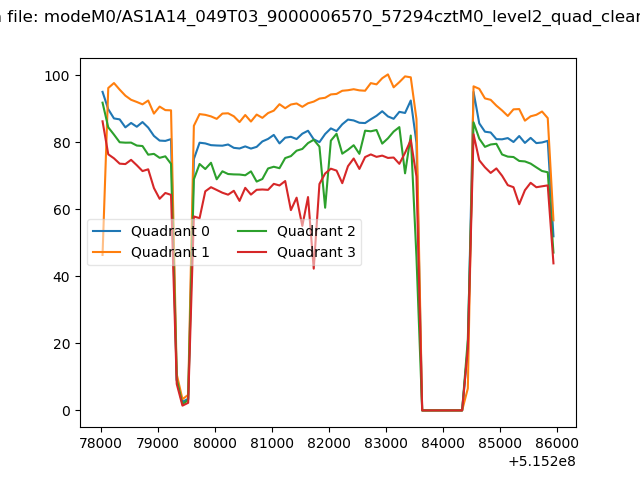 |
|
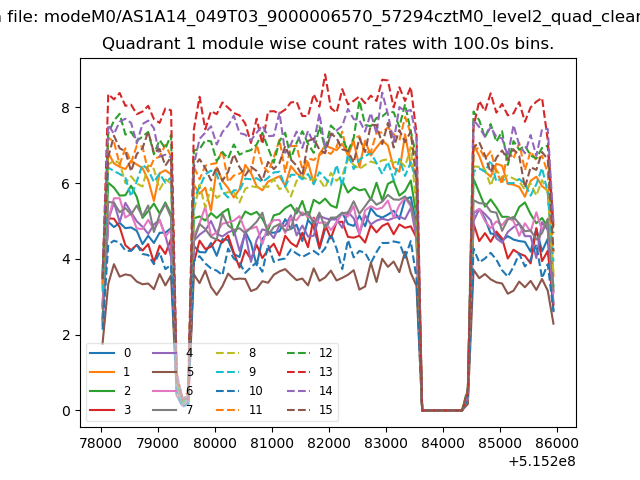
| Module-wise count rates for Quadrant A Data is divided into 100 sec bins |
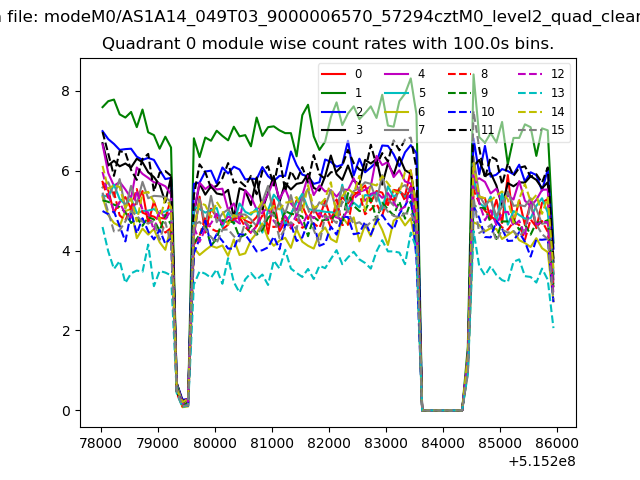 |
 |
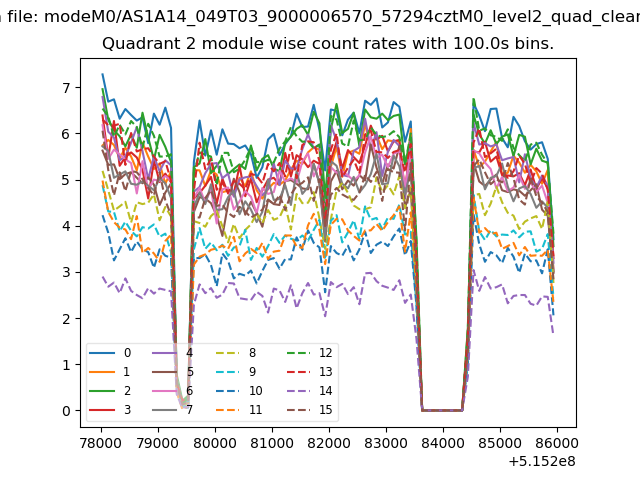
| Module-wise count rates for Quadrant B Data is divided into 100 sec bins |
 |
 |
| Module-wise count rates for Quadrant C Data is divided into 100 sec bins |
 |
 |
| Module-wise count rates for Quadrant D Data is divided into 100 sec bins |
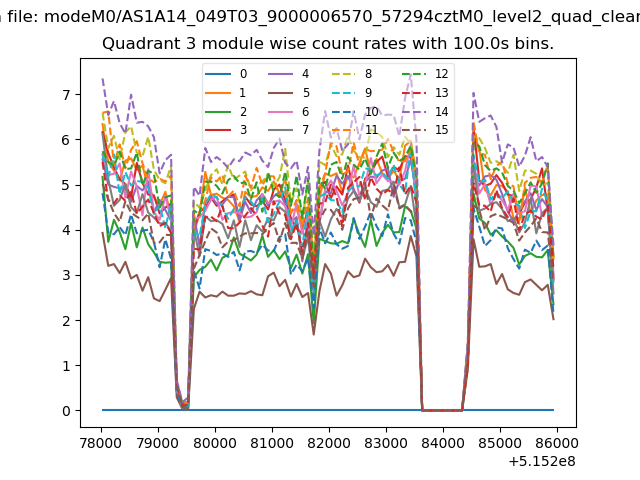 |
 |
| Parameter | Plot |
|---|---|
| CZT HV Monitor | 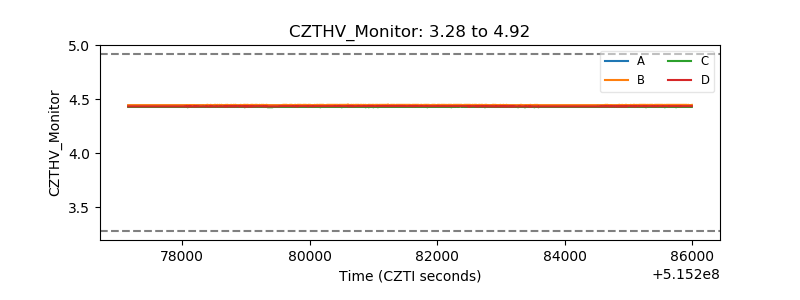 |
| D_VDD | 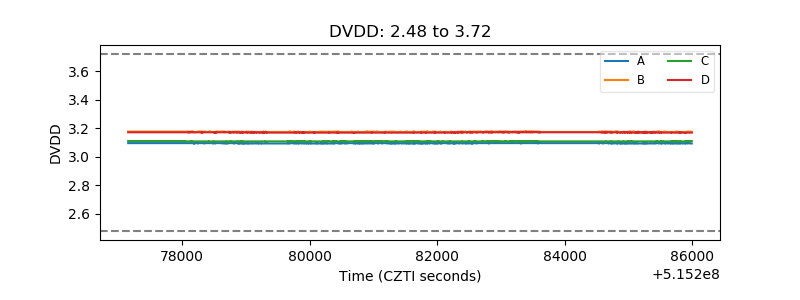 |
| Temperature 1 | 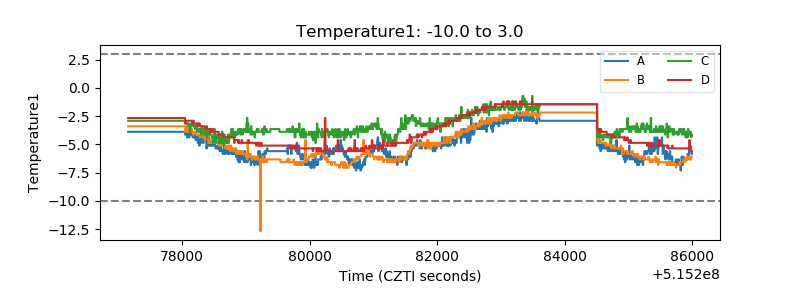 |
| Veto HV Monitor | 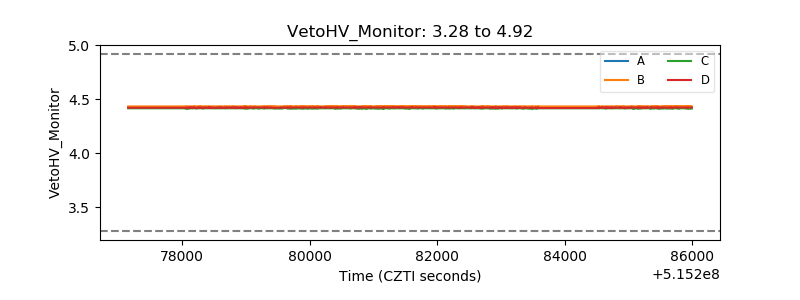 |
| Veto LLD | 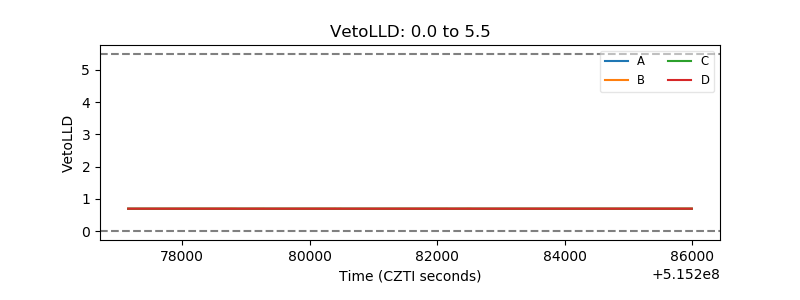 |
| Alpha Counter | 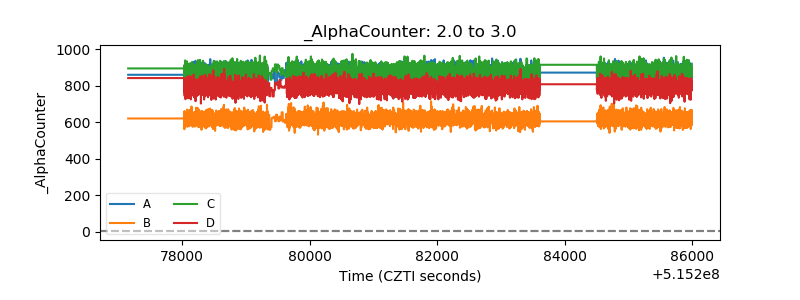 |
| _CPM_Rate | 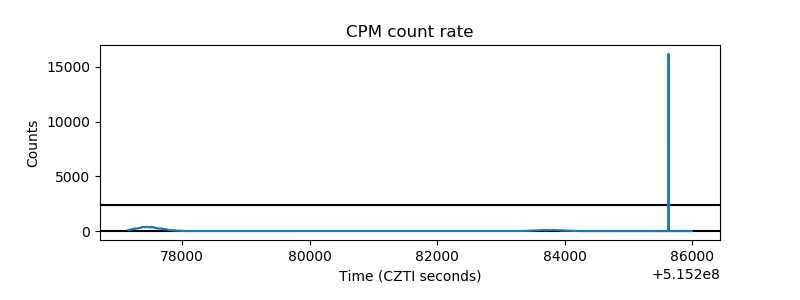 |
| CZT Counter | 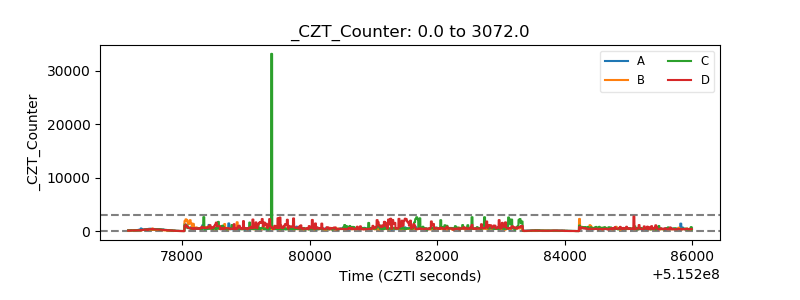 |
| +2.5 Volts monitor |  |
| +5 Volts monitor |  |
| _ROLL_ROT | 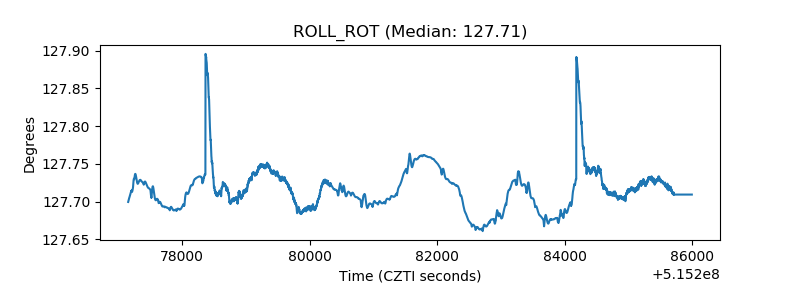 |
| _Roll_DEC | 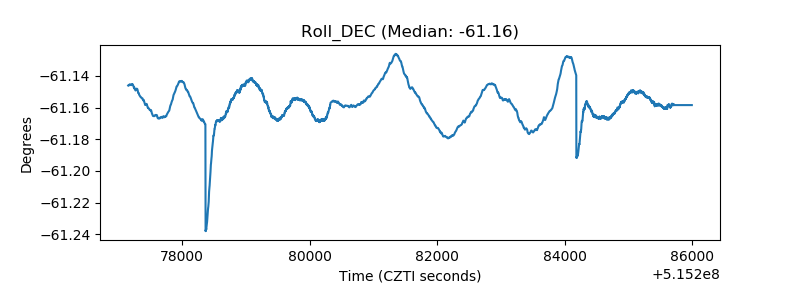 |
| _Roll_RA | 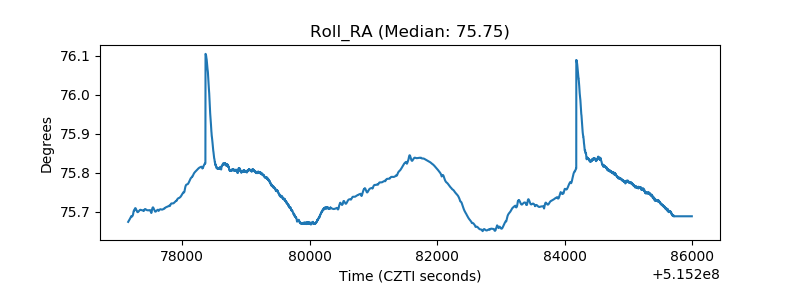 |
| Veto Counter | 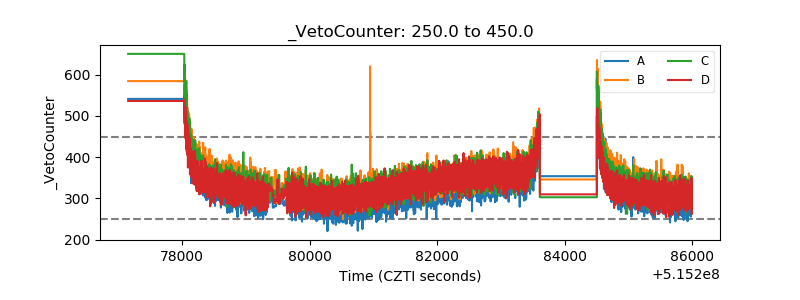 |