| Param | Original file | Final file |
|---|---|---|
| Filename | modeM0/AS1A14_049T03_9000006570_57296cztM0_level2.fits | modeM0/AS1A14_049T03_9000006570_57296cztM0_level2_quad_clean.evt |
| Size (bytes) | 620,409,600 | 99,979,200 |
| Size | 591.7 MB | 95.3 MB |
| Events in quadrant A | 5,097,430 | 657,744 |
| Events in quadrant B | 4,150,267 | 694,737 |
| Events in quadrant C | 6,247,544 | 587,318 |
| Events in quadrant D | 6,843,723 | 525,029 |
| Mode M0 | |||
|---|---|---|---|
| Quadrant | BADHDUFLAG | Total packets | Discarded packets |
| A | 0 | 20680 | 2 |
| B | 0 | 18208 | 1 |
| C | 0 | 24110 | 1 |
| D | 0 | 26052 | 1 |
| Mode M9 | |||
|---|---|---|---|
| Quadrant | BADHDUFLAG | Total packets | Discarded packets |
| A | 0 | 3 | 0 |
| B | 0 | 3 | 0 |
| C | 0 | 3 | 0 |
| D | 0 | 3 | 0 |
| Mode SS | |||
|---|---|---|---|
| Quadrant | BADHDUFLAG | Total packets | Discarded packets |
| A | 0 | 164 | 0 |
| B | 0 | 164 | 0 |
| C | 0 | 164 | 0 |
| D | 0 | 164 | 0 |
| Quadrant | Total seconds | Saturated seconds | Saturation percentage |
|---|---|---|---|
| A | 8083 | 199 | 2.461957% |
| B | 8084 | 151 | 1.867887% |
| C | 8084 | 462 | 5.714993% |
| D | 8084 | 797 | 9.858981% |
Noise dominated data is calculated using 1-second bins in cleaned event files. If a bin has >2000 counts, and if more than 50% of those come from <1% of pixels, then it is considered to be noise-dominated and hence unusable.
| Quadrant | # 1 sec bins | Bins with >0 counts | Bins with >2000 counts | High rate bins dominated by noise | Noise dominated (total time) | Noise dominated (detector-on time) | Marked lightcurve |
|---|---|---|---|---|---|---|---|
| A | 8698 | 8369 | 154 | 154 | 1.77% | 1.84% | 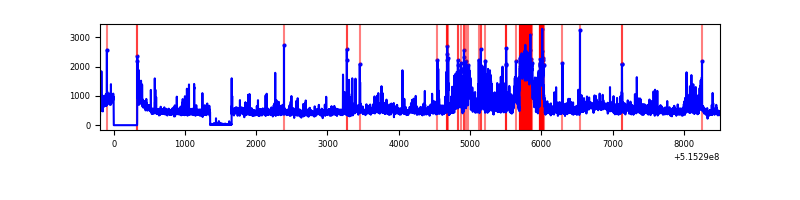 |
| B | 8699 | 8370 | 22 | 22 | 0.25% | 0.26% | 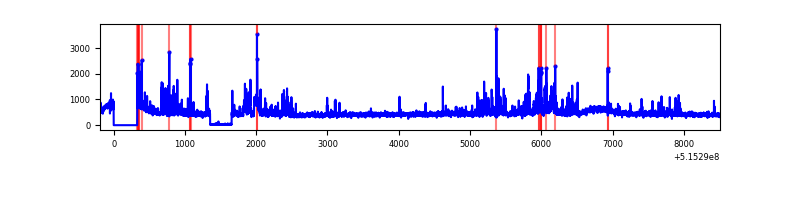 |
| C | 8698 | 8365 | 353 | 353 | 4.06% | 4.22% | 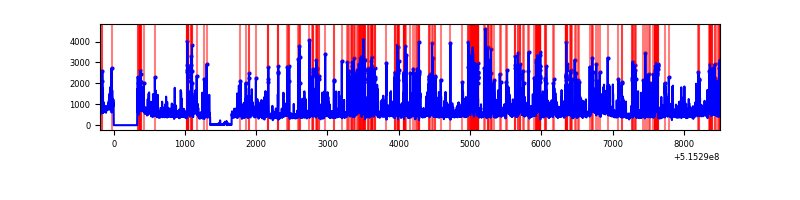 |
| D | 8699 | 8370 | 613 | 613 | 7.05% | 7.32% | 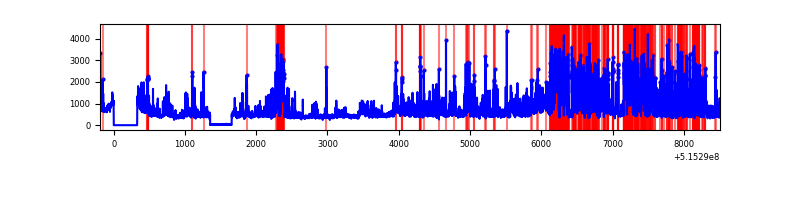 |
Top three noisy pixels from each quadrant. If the there are fewer than three noisy pixels in the level2.evt file, extra rows are filled as -1
| Pixel properties | Quadrant properties | ||||||
|---|---|---|---|---|---|---|---|
| Quadrant | DetID | PixID | Counts | Sigma | Mean | Median | Sigma |
| A | 0 | 12 | 887722 | 4119.97 | 879 | 854 | 215.3 |
| A | 8 | 4 | 527859 | 2448.21 | 879 | 854 | 215.3 |
| A | 3 | 14 | 185848 | 859.39 | 879 | 854 | 215.3 |
| B | 5 | 185 | 442436 | 2356.45 | 874 | 840 | 187.4 |
| B | 5 | 172 | 75578 | 398.82 | 874 | 840 | 187.4 |
| B | 10 | 16 | 46495 | 243.62 | 874 | 840 | 187.4 |
| C | 15 | 224 | 2117307 | 9390.69 | 841 | 833 | 225.4 |
| C | 6 | 223 | 239592 | 1059.36 | 841 | 833 | 225.4 |
| C | 14 | 254 | 156991 | 692.86 | 841 | 833 | 225.4 |
| D | 3 | 224 | 2588738 | 11383.79 | 812 | 775 | 227.3 |
| D | 6 | 159 | 426249 | 1871.55 | 812 | 775 | 227.3 |
| D | 7 | 96 | 128674 | 562.59 | 812 | 775 | 227.3 |
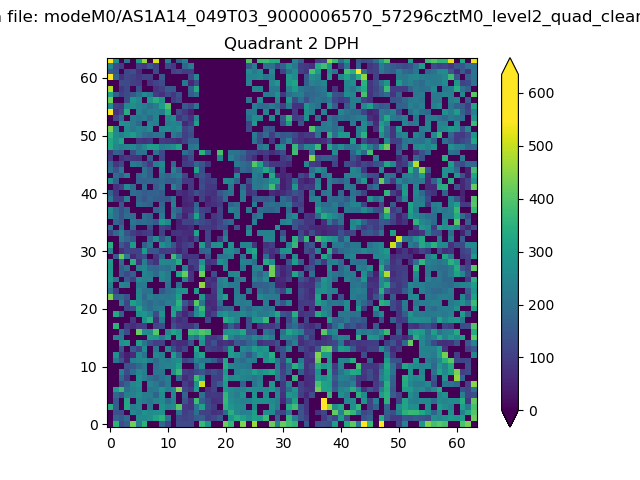
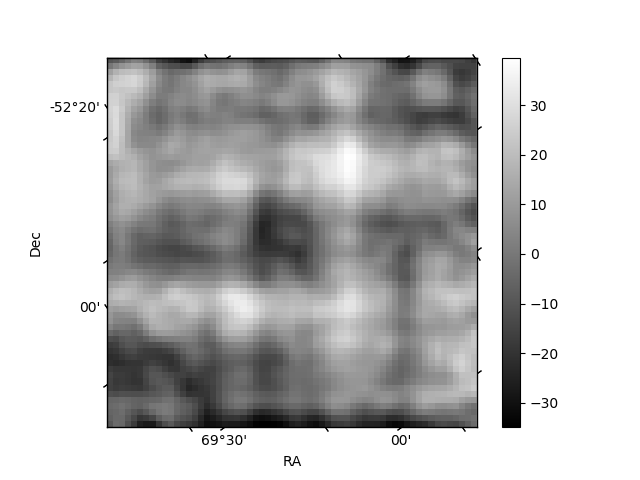
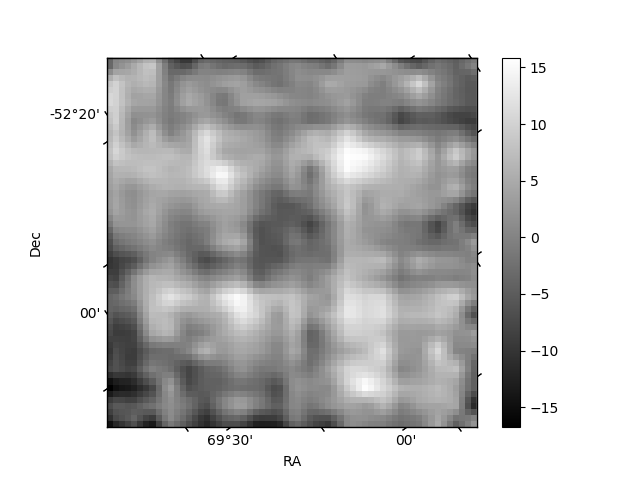
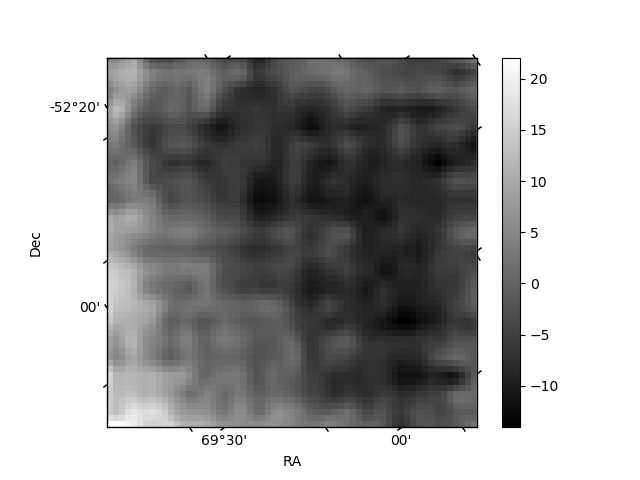
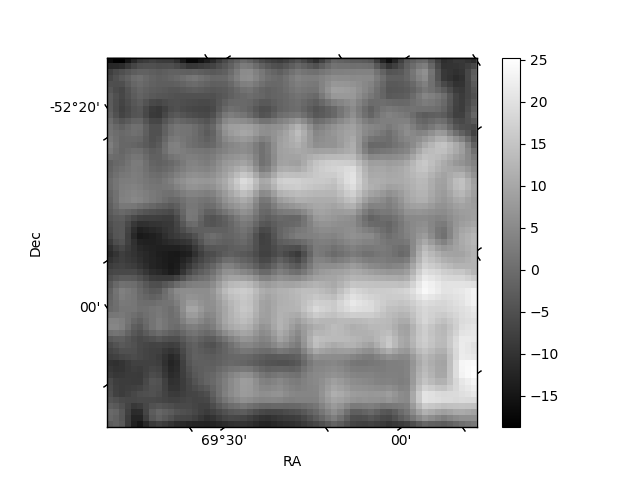
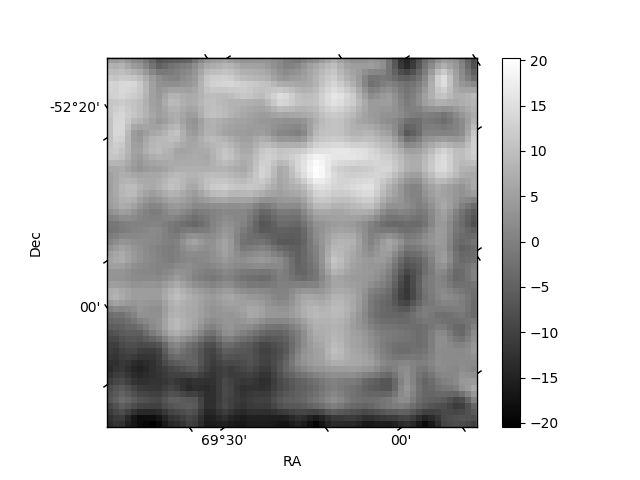
Histogram calculated using DETX and DETY for each event in the final _common_clean file
| Quadrant A | 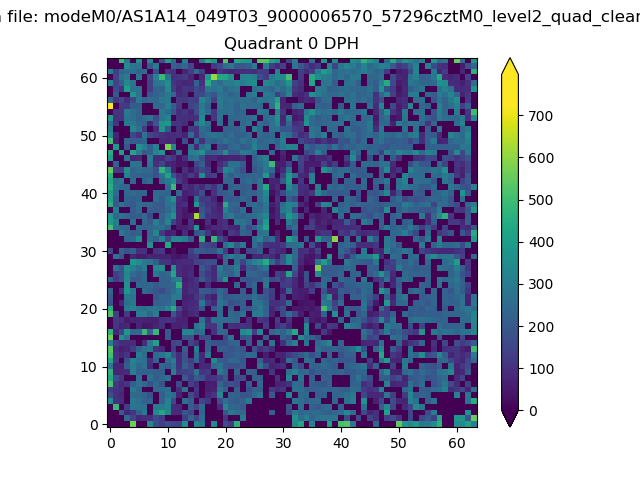 |
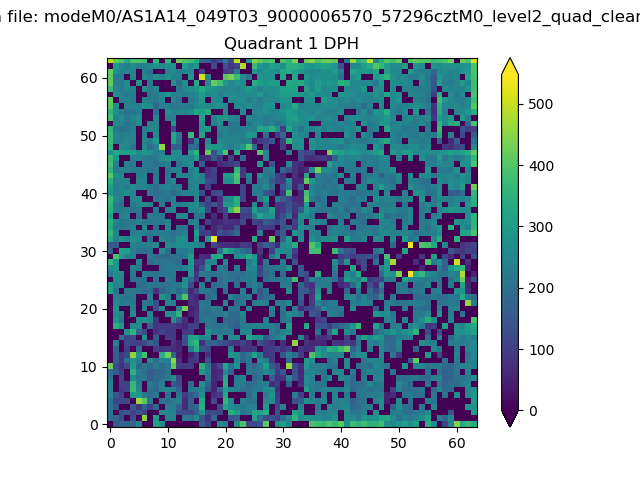 |
Quadrant B |
|---|---|---|---|
| Quadrant D | 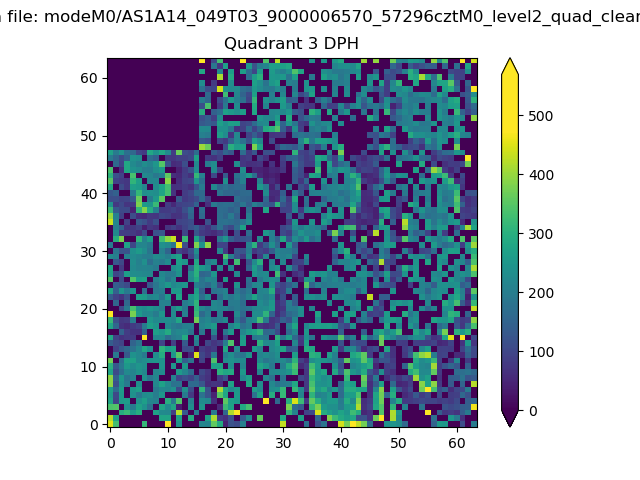 |
 |
Quadrant C |
| Plot type | Count rate plots | Images |
|---|---|---|
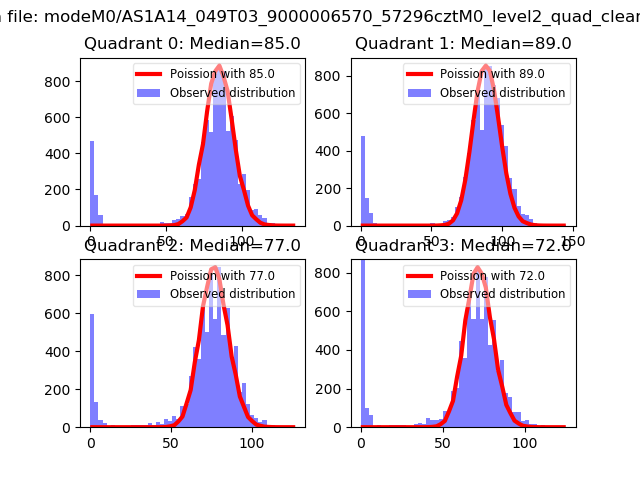
| Comparison with Poisson distribution Blue bars denote a histogram of data divided into 1 sec bins. Red curve is a Poisson curve with rate = median count rate of data. |
 |
 |
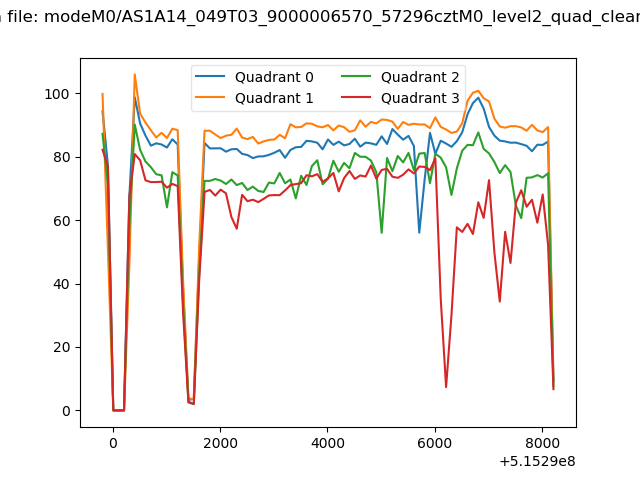
| Quadrant-wise count rates Data is divided into 100 sec bins |
 |
|
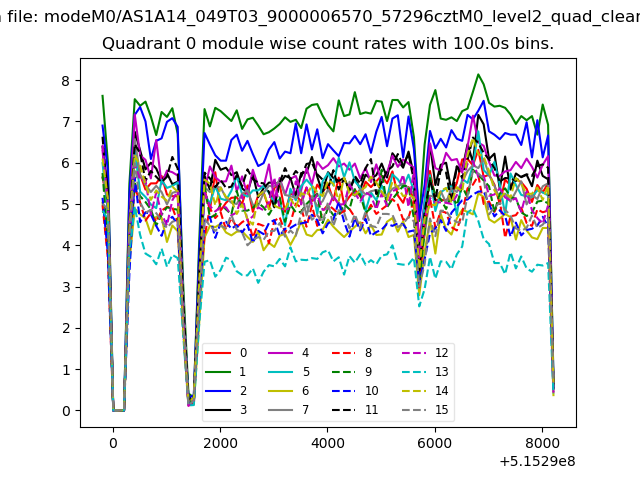
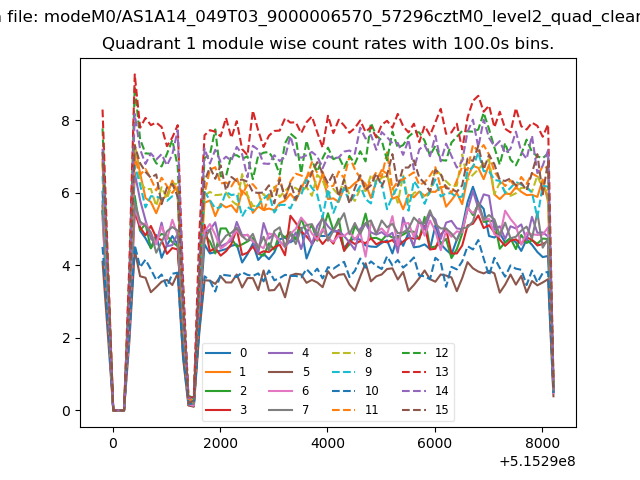
| Module-wise count rates for Quadrant A Data is divided into 100 sec bins |
 |
 |
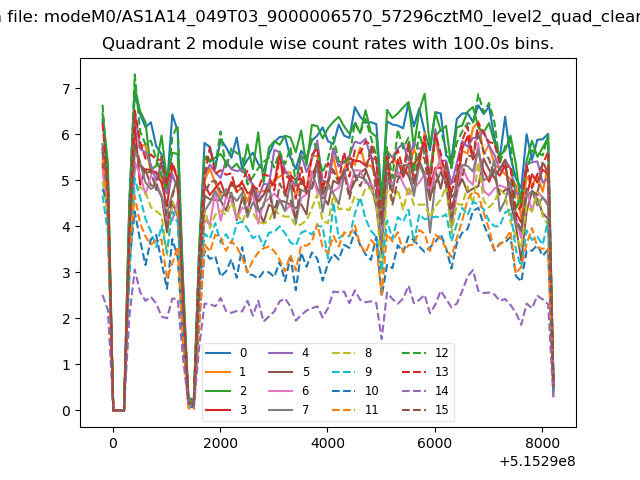
| Module-wise count rates for Quadrant B Data is divided into 100 sec bins |
 |
 |
| Module-wise count rates for Quadrant C Data is divided into 100 sec bins |
 |
 |
| Module-wise count rates for Quadrant D Data is divided into 100 sec bins |
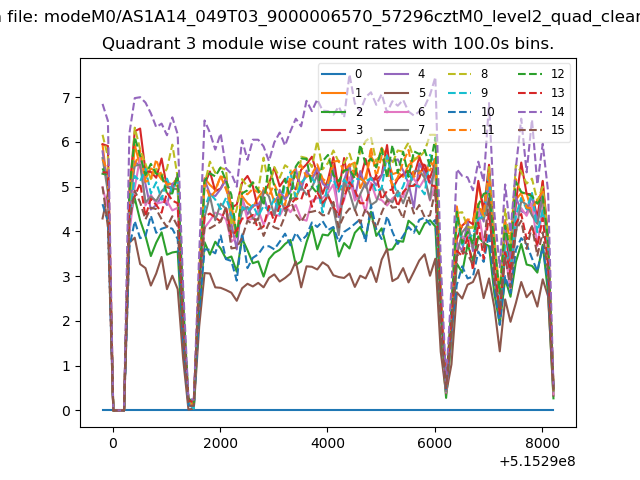 |
 |
| Parameter | Plot |
|---|---|
| CZT HV Monitor | 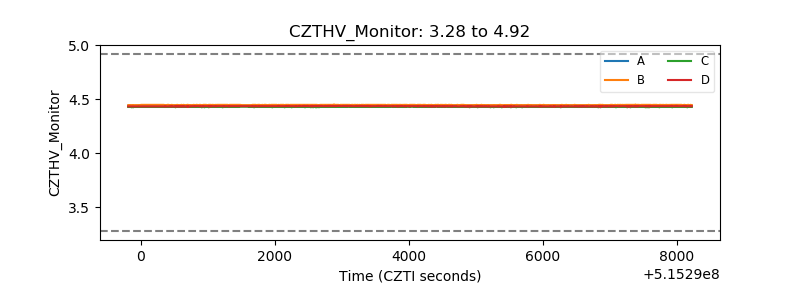 |
| D_VDD | 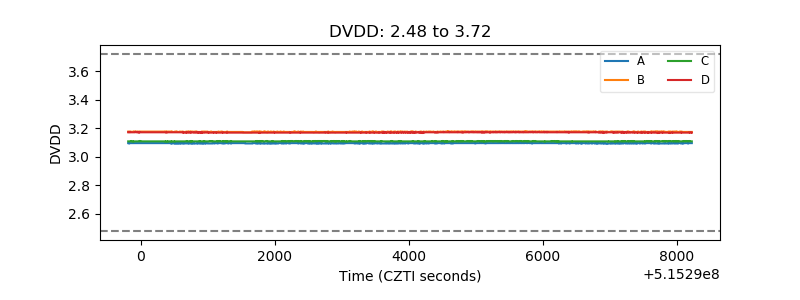 |
| Temperature 1 | 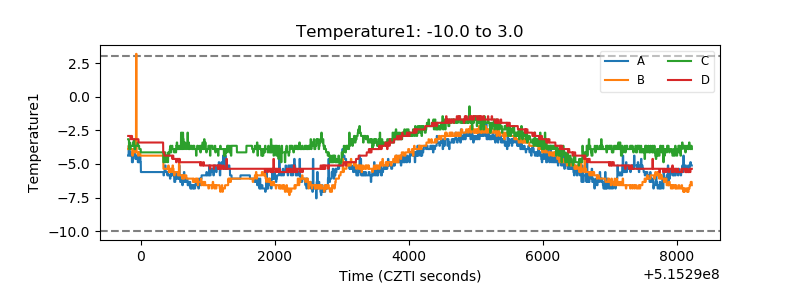 |
| Veto HV Monitor | 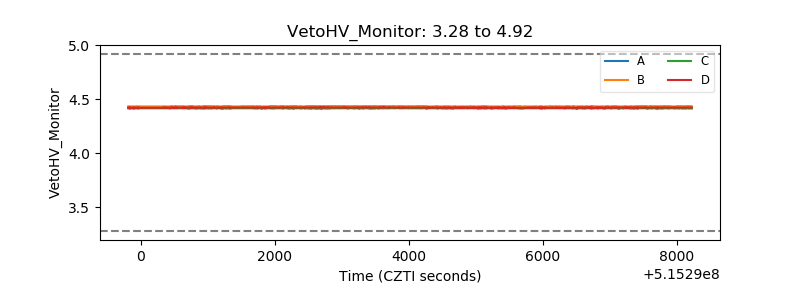 |
| Veto LLD | 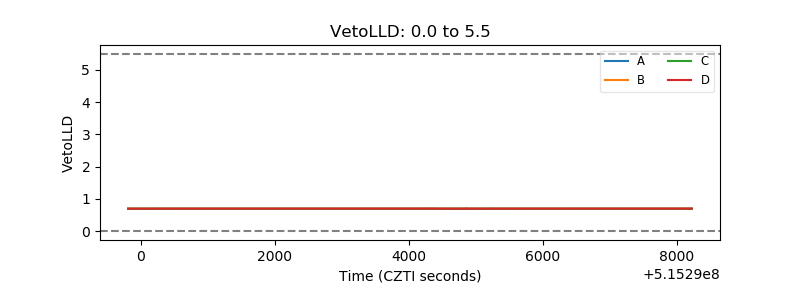 |
| Alpha Counter | 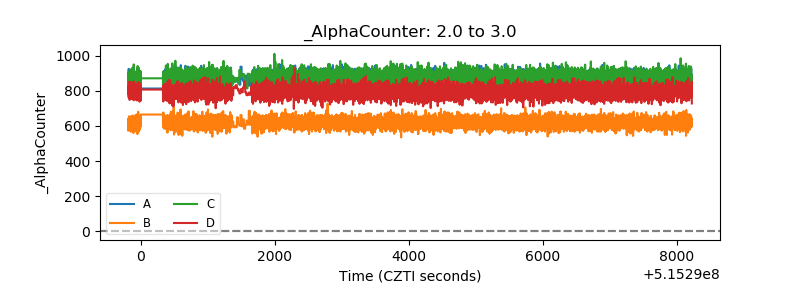 |
| _CPM_Rate | 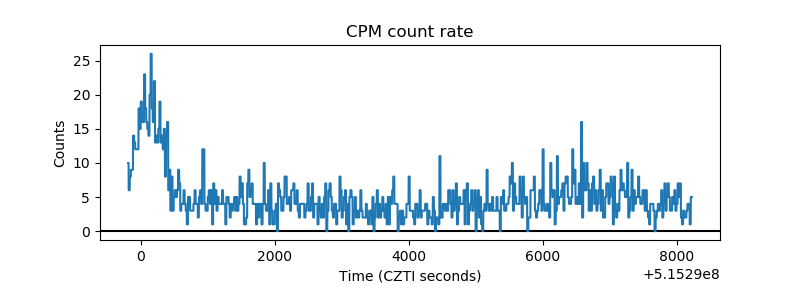 |
| CZT Counter | 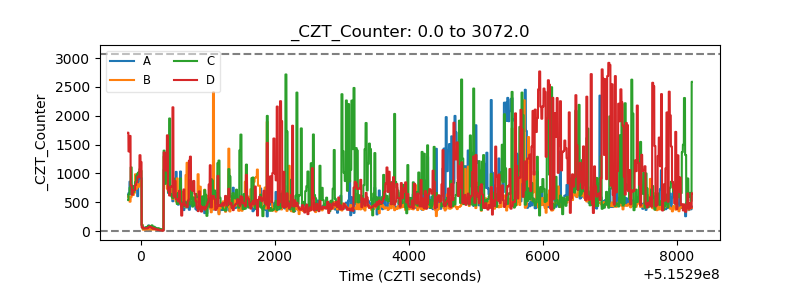 |
| +2.5 Volts monitor | 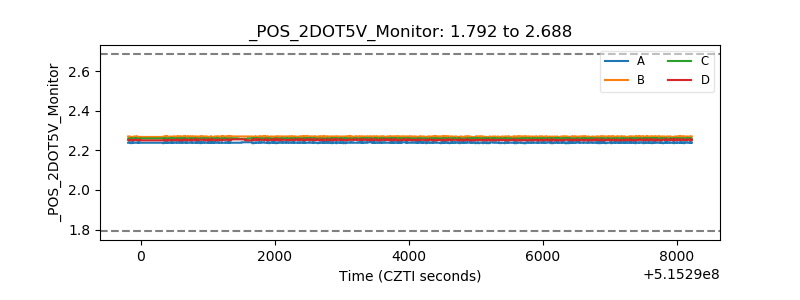 |
| +5 Volts monitor | 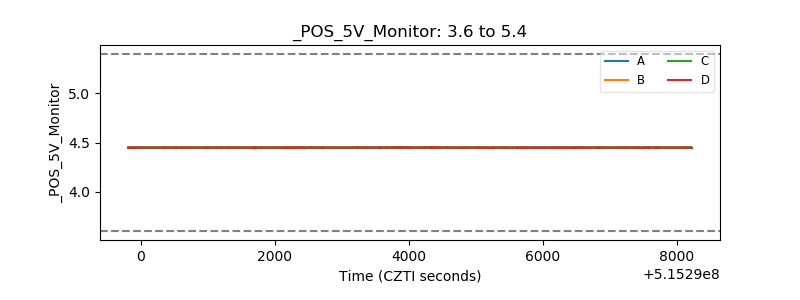 |
| _ROLL_ROT | 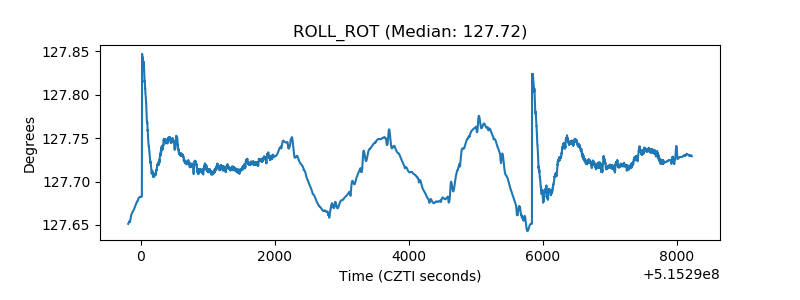 |
| _Roll_DEC | 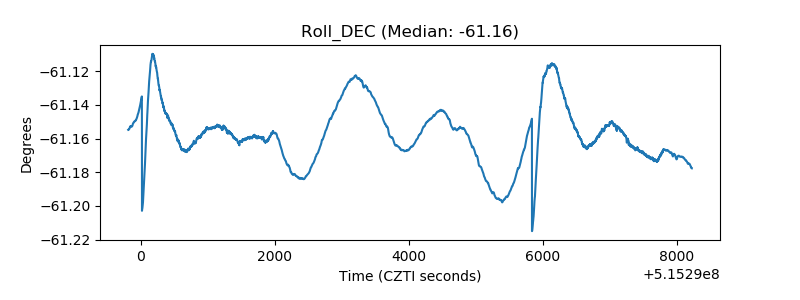 |
| _Roll_RA | 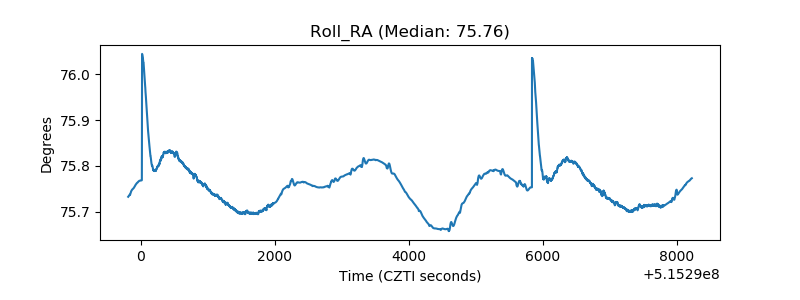 |
| Veto Counter | 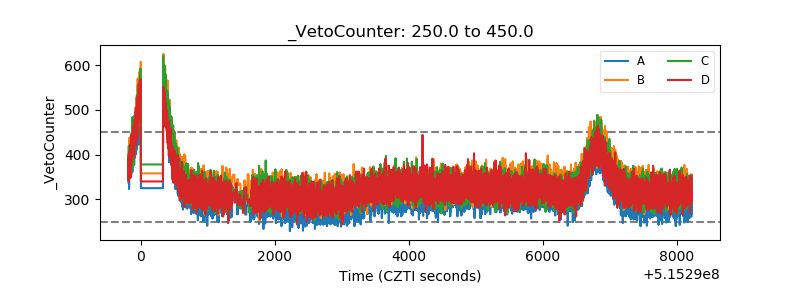 |