| Param | Original file | Final file |
|---|---|---|
| Filename | modeM0/AS1A14_049T03_9000006570_57300cztM0_level2.fits | modeM0/AS1A14_049T03_9000006570_57300cztM0_level2_quad_clean.evt |
| Size (bytes) | 1,378,906,560 | 262,451,520 |
| Size | 1.3 GB | 250.3 MB |
| Events in quadrant A | 14,096,754 | 1,675,951 |
| Events in quadrant B | 9,634,607 | 1,846,207 |
| Events in quadrant C | 13,395,128 | 1,609,939 |
| Events in quadrant D | 12,468,901 | 1,523,675 |
| Mode M0 | |||
|---|---|---|---|
| Quadrant | BADHDUFLAG | Total packets | Discarded packets |
| A | 0 | 54436 | 2 |
| B | 0 | 41818 | 2 |
| C | 0 | 52893 | 2 |
| D | 0 | 49880 | 2 |
| Mode M9 | |||
|---|---|---|---|
| Quadrant | BADHDUFLAG | Total packets | Discarded packets |
| A | 0 | 9 | 0 |
| B | 0 | 9 | 0 |
| C | 0 | 9 | 0 |
| D | 0 | 9 | 0 |
| Mode SS | |||
|---|---|---|---|
| Quadrant | BADHDUFLAG | Total packets | Discarded packets |
| A | 0 | 380 | 0 |
| B | 0 | 380 | 0 |
| C | 0 | 380 | 0 |
| D | 0 | 380 | 0 |
| Quadrant | Total seconds | Saturated seconds | Saturation percentage |
|---|---|---|---|
| A | 18717 | 1240 | 6.624993% |
| B | 18717 | 521 | 2.783566% |
| C | 18718 | 1102 | 5.887381% |
| D | 18718 | 906 | 4.840261% |
Noise dominated data is calculated using 1-second bins in cleaned event files. If a bin has >2000 counts, and if more than 50% of those come from <1% of pixels, then it is considered to be noise-dominated and hence unusable.
| Quadrant | # 1 sec bins | Bins with >0 counts | Bins with >2000 counts | High rate bins dominated by noise | Noise dominated (total time) | Noise dominated (detector-on time) | Marked lightcurve |
|---|---|---|---|---|---|---|---|
| A | 19652 | 18717 | 932 | 932 | 4.74% | 4.98% | 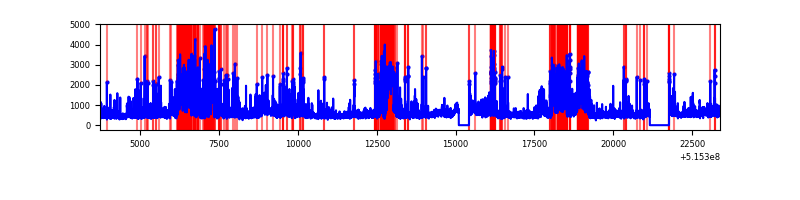 |
| B | 19652 | 18717 | 109 | 109 | 0.55% | 0.58% | 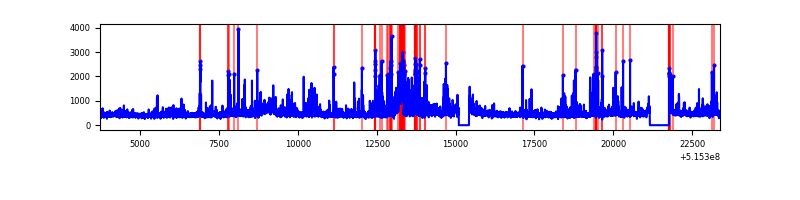 |
| C | 19653 | 18719 | 716 | 716 | 3.64% | 3.82% | 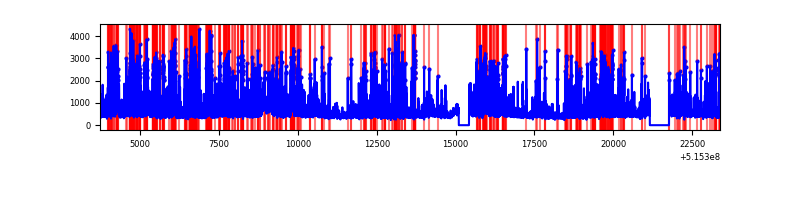 |
| D | 19653 | 18719 | 594 | 594 | 3.02% | 3.17% | 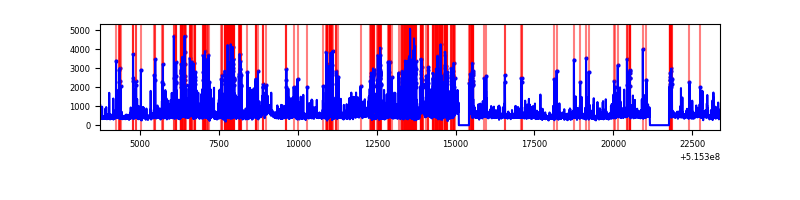 |
Top three noisy pixels from each quadrant. If the there are fewer than three noisy pixels in the level2.evt file, extra rows are filled as -1
| Pixel properties | Quadrant properties | ||||||
|---|---|---|---|---|---|---|---|
| Quadrant | DetID | PixID | Counts | Sigma | Mean | Median | Sigma |
| A | 3 | 14 | 3697380 | 7507.72 | 2003 | 1952 | 492.2 |
| A | 8 | 4 | 968882 | 1964.44 | 2003 | 1952 | 492.2 |
| A | 0 | 12 | 840822 | 1704.27 | 2003 | 1952 | 492.2 |
| B | 10 | 247 | 487269 | 1128.63 | 2001 | 1923 | 430.0 |
| B | 8 | 128 | 360172 | 833.08 | 2001 | 1923 | 430.0 |
| B | 5 | 185 | 350880 | 811.47 | 2001 | 1923 | 430.0 |
| C | 15 | 224 | 4495802 | 8562.44 | 1944 | 1919 | 524.8 |
| C | 14 | 254 | 386741 | 733.22 | 1944 | 1919 | 524.8 |
| C | 6 | 223 | 265149 | 501.55 | 1944 | 1919 | 524.8 |
| D | 3 | 224 | 2802168 | 5131.14 | 1947 | 1860 | 545.7 |
| D | 8 | 240 | 621829 | 1136.0 | 1947 | 1860 | 545.7 |
| D | 3 | 12 | 396369 | 722.88 | 1947 | 1860 | 545.7 |
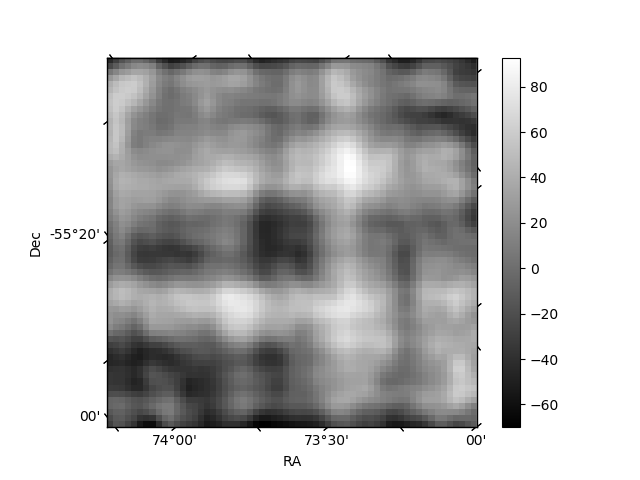
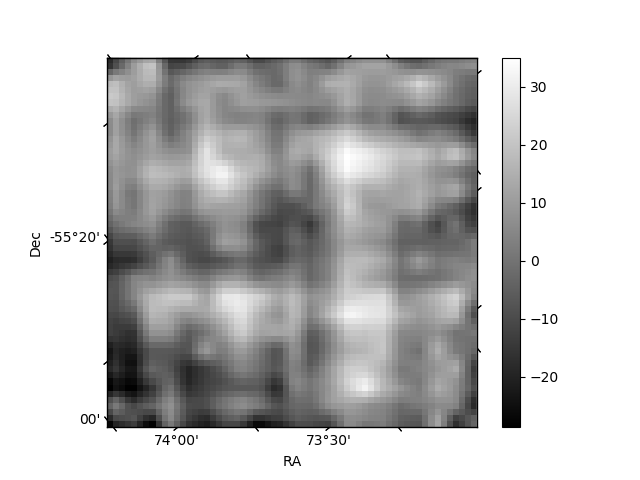
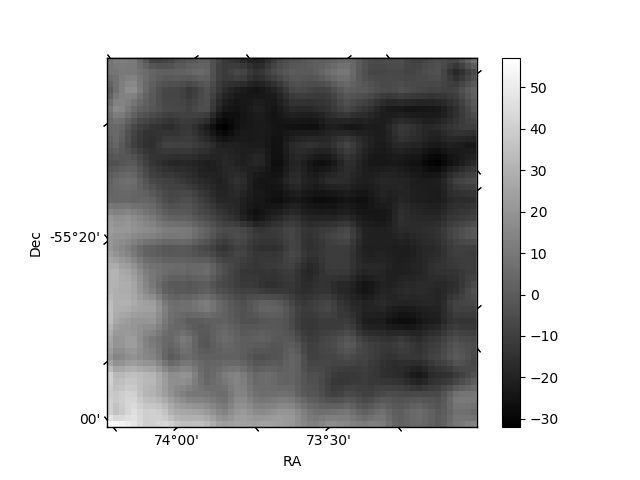
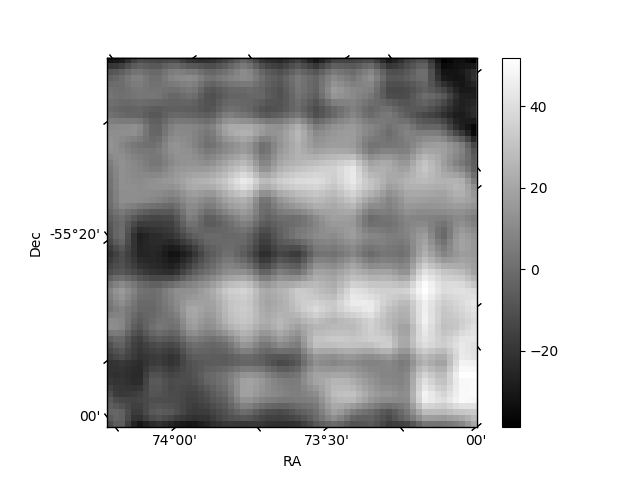
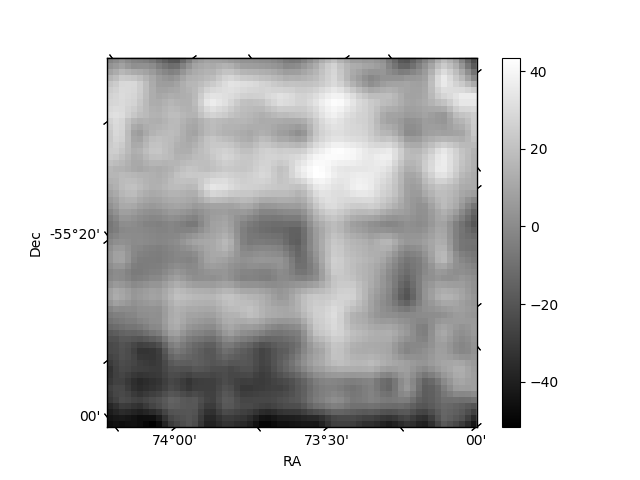
Histogram calculated using DETX and DETY for each event in the final _common_clean file
| Quadrant A | 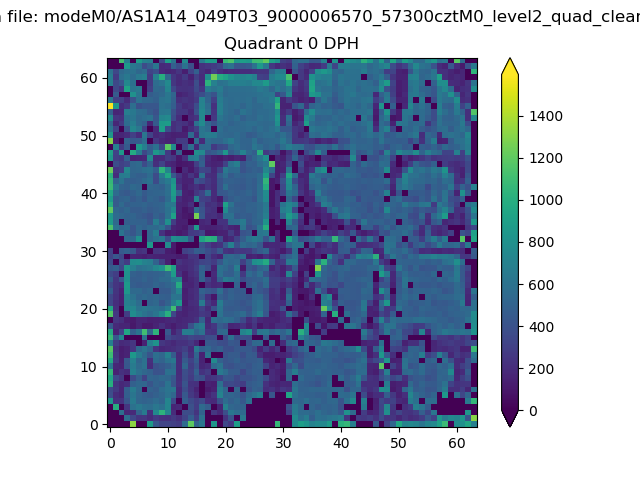 |
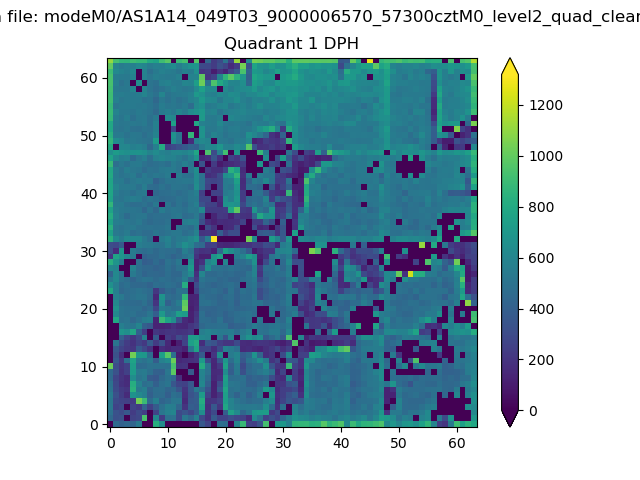 |
Quadrant B |
|---|---|---|---|
| Quadrant D | 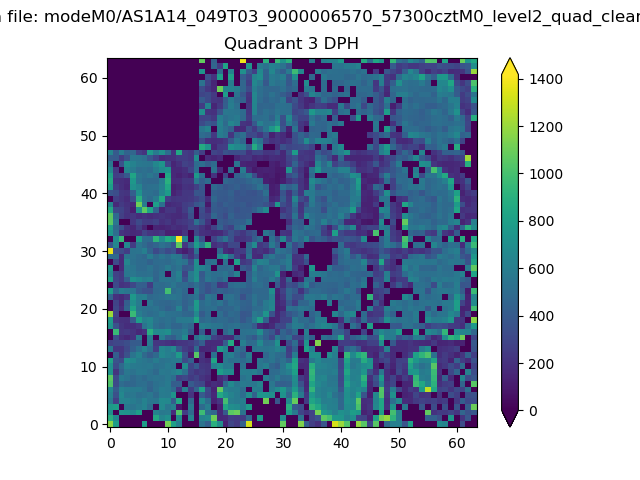 |
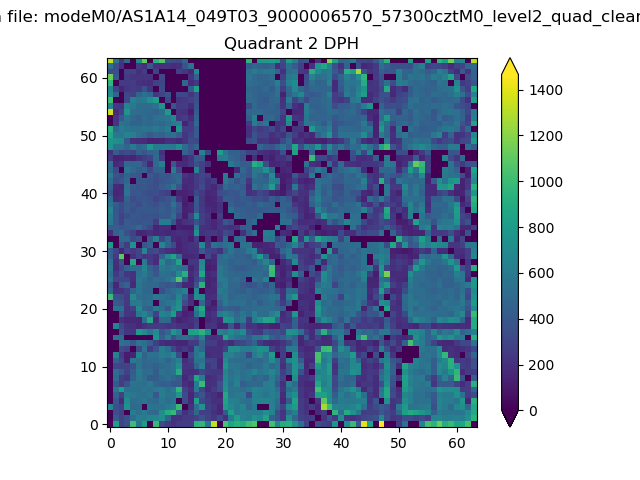 |
Quadrant C |
| Plot type | Count rate plots | Images |
|---|---|---|
| Comparison with Poisson distribution Blue bars denote a histogram of data divided into 1 sec bins. Red curve is a Poisson curve with rate = median count rate of data. |
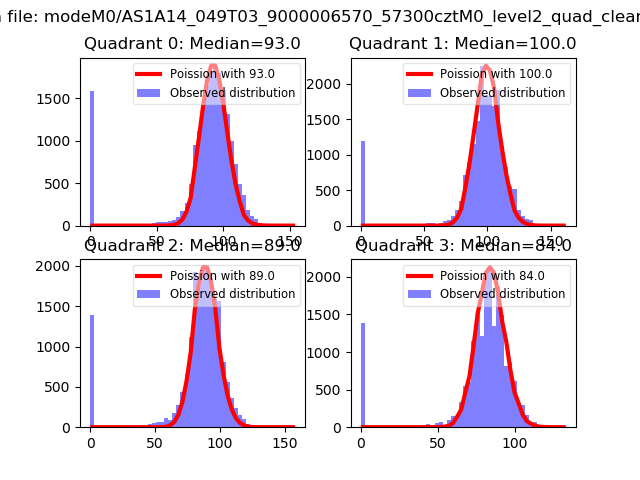 |
 |
| Quadrant-wise count rates Data is divided into 100 sec bins |
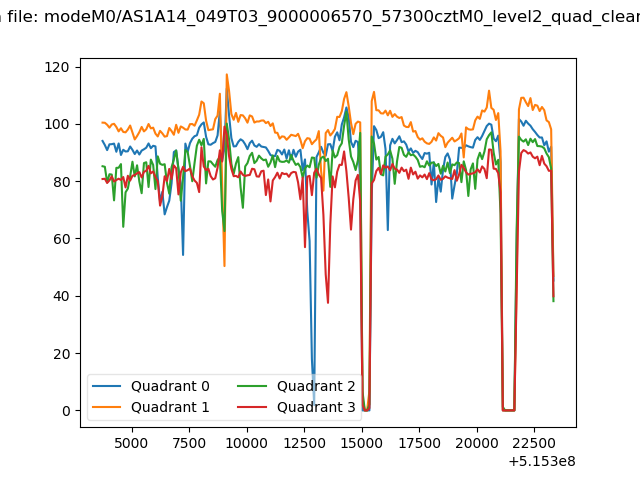 |
|
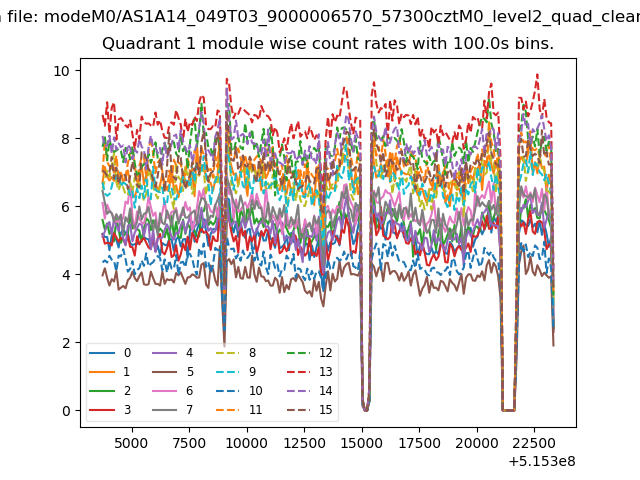
| Module-wise count rates for Quadrant A Data is divided into 100 sec bins |
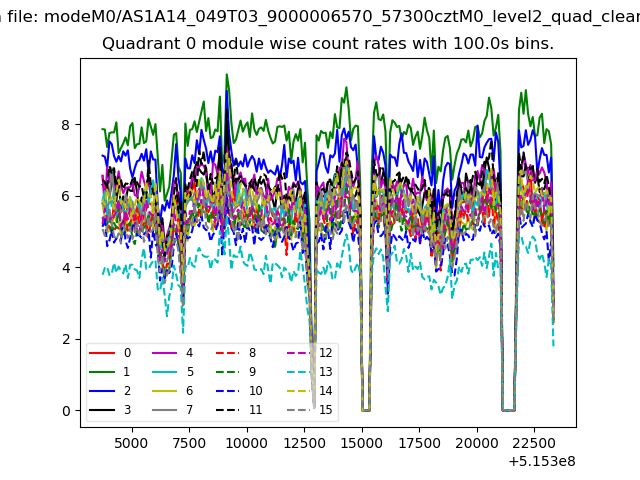 |
 |
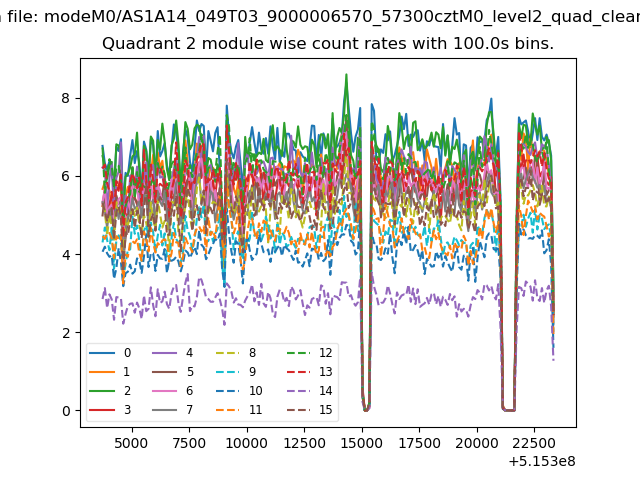
| Module-wise count rates for Quadrant B Data is divided into 100 sec bins |
 |
 |
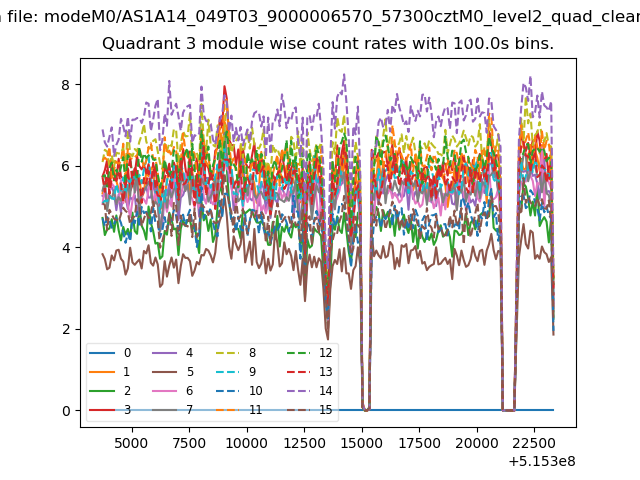
| Module-wise count rates for Quadrant C Data is divided into 100 sec bins |
 |
 |
| Module-wise count rates for Quadrant D Data is divided into 100 sec bins |
 |
 |
| Parameter | Plot |
|---|---|
| CZT HV Monitor | 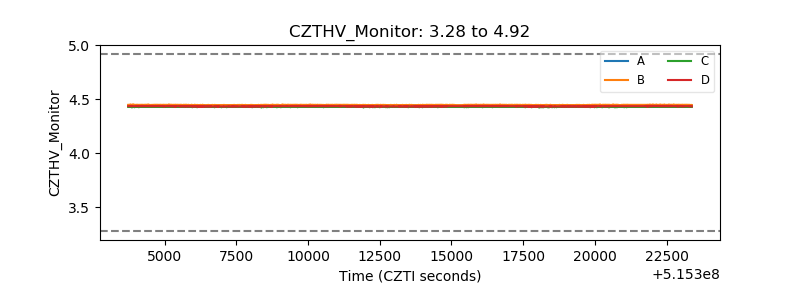 |
| D_VDD | 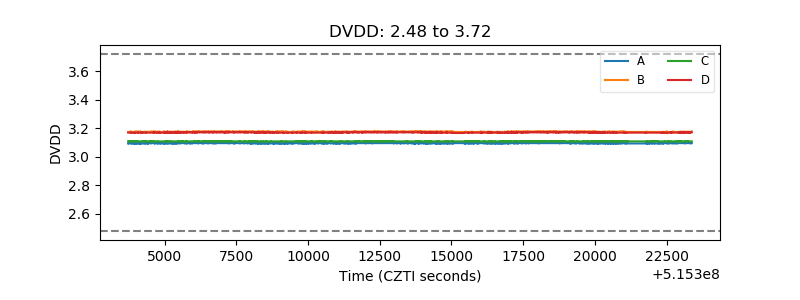 |
| Temperature 1 | 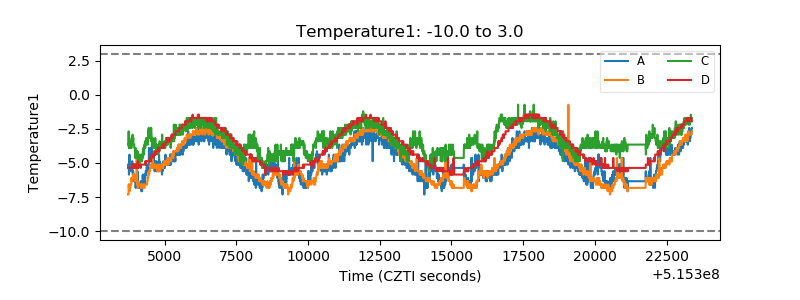 |
| Veto HV Monitor |  |
| Veto LLD | 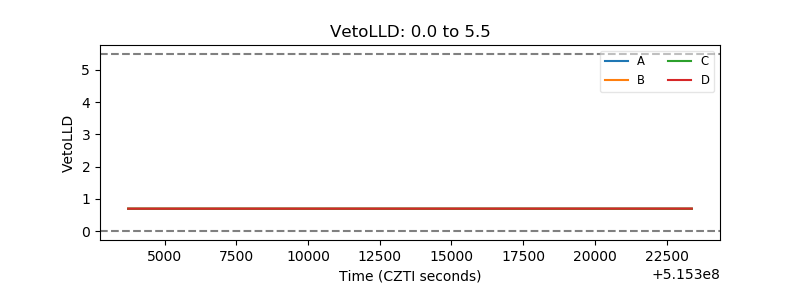 |
| Alpha Counter | 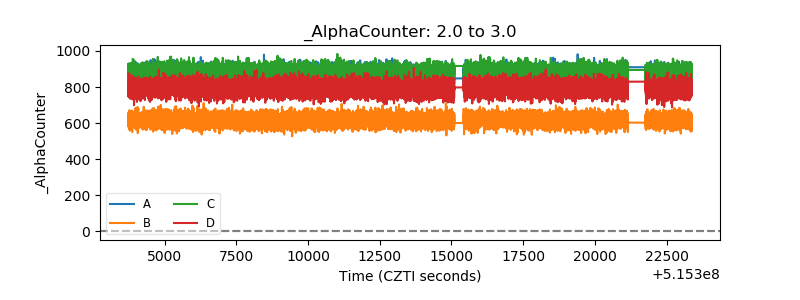 |
| _CPM_Rate | 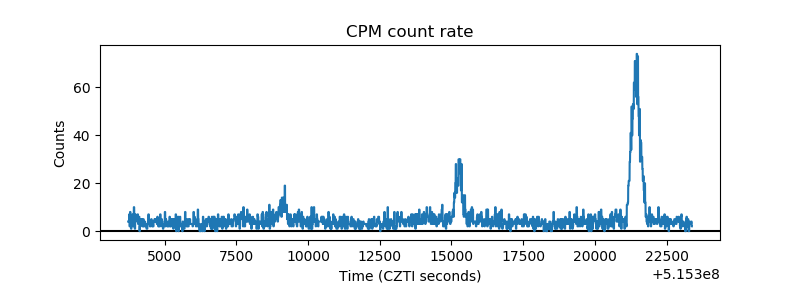 |
| CZT Counter | 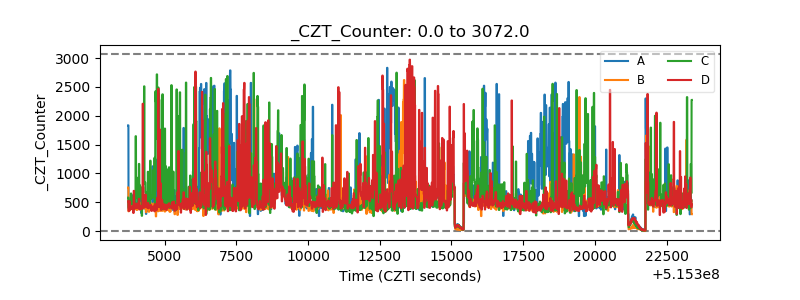 |
| +2.5 Volts monitor |  |
| +5 Volts monitor |  |
| _ROLL_ROT | 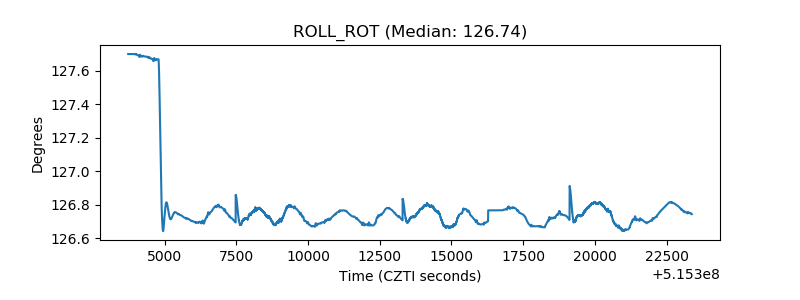 |
| _Roll_DEC | 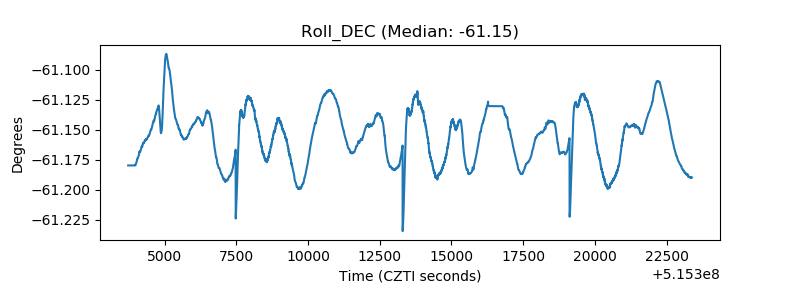 |
| _Roll_RA | 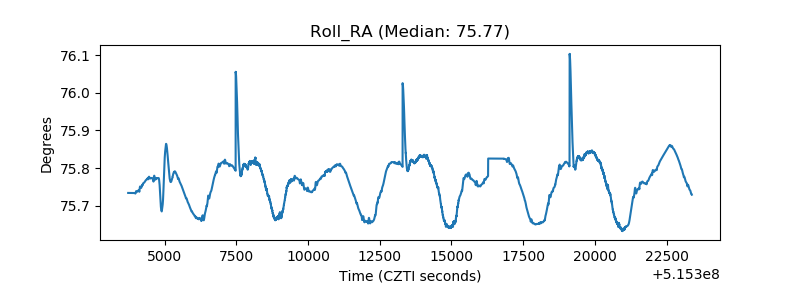 |
| Veto Counter | 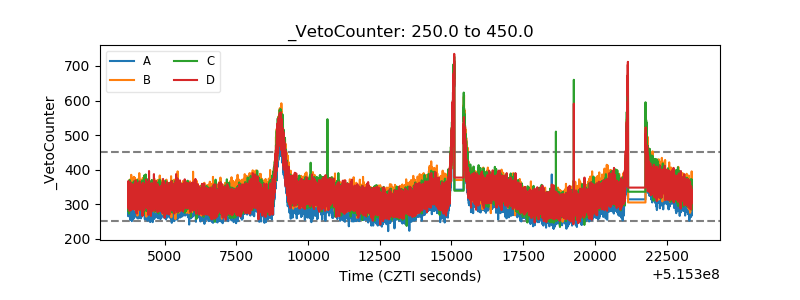 |