| Param | Original file | Final file |
|---|---|---|
| Filename | modeM0/AS1A14_049T03_9000006570_57303cztM0_level2.fits | modeM0/AS1A14_049T03_9000006570_57303cztM0_level2_quad_clean.evt |
| Size (bytes) | 441,063,360 | 91,788,480 |
| Size | 420.6 MB | 87.5 MB |
| Events in quadrant A | 3,671,698 | 606,367 |
| Events in quadrant B | 3,739,323 | 643,300 |
| Events in quadrant C | 4,526,270 | 555,203 |
| Events in quadrant D | 3,895,890 | 531,067 |
| Mode M0 | |||
|---|---|---|---|
| Quadrant | BADHDUFLAG | Total packets | Discarded packets |
| A | 0 | 15135 | 1 |
| B | 0 | 15511 | 1 |
| C | 0 | 17963 | 1 |
| D | 0 | 16011 | 1 |
| Mode M9 | |||
|---|---|---|---|
| Quadrant | BADHDUFLAG | Total packets | Discarded packets |
| A | 0 | 9 | 0 |
| B | 0 | 9 | 0 |
| C | 0 | 9 | 0 |
| D | 0 | 9 | 0 |
| Mode SS | |||
|---|---|---|---|
| Quadrant | BADHDUFLAG | Total packets | Discarded packets |
| A | 0 | 130 | 0 |
| B | 0 | 130 | 0 |
| C | 0 | 130 | 0 |
| D | 0 | 130 | 0 |
| Quadrant | Total seconds | Saturated seconds | Saturation percentage |
|---|---|---|---|
| A | 6350 | 113 | 1.779528% |
| B | 6350 | 143 | 2.251969% |
| C | 6350 | 384 | 6.047244% |
| D | 6350 | 294 | 4.629921% |
Noise dominated data is calculated using 1-second bins in cleaned event files. If a bin has >2000 counts, and if more than 50% of those come from <1% of pixels, then it is considered to be noise-dominated and hence unusable.
| Quadrant | # 1 sec bins | Bins with >0 counts | Bins with >2000 counts | High rate bins dominated by noise | Noise dominated (total time) | Noise dominated (detector-on time) | Marked lightcurve |
|---|---|---|---|---|---|---|---|
| A | 7295 | 6350 | 46 | 46 | 0.63% | 0.72% | 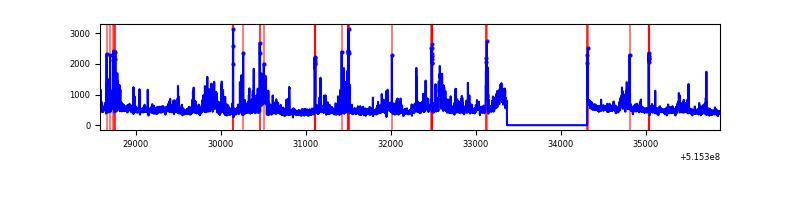 |
| B | 7295 | 6350 | 54 | 54 | 0.74% | 0.85% | 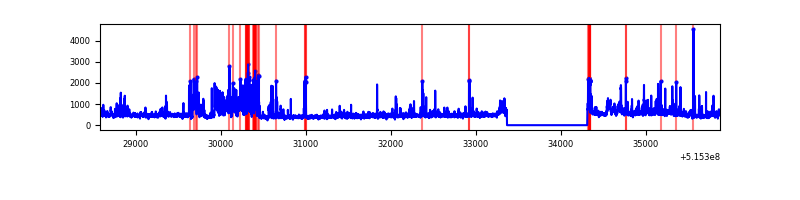 |
| C | 7295 | 6350 | 299 | 299 | 4.10% | 4.71% | 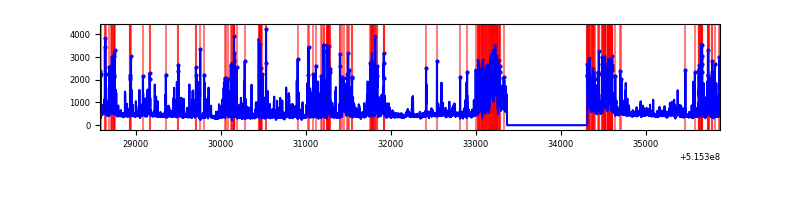 |
| D | 7295 | 6350 | 187 | 187 | 2.56% | 2.94% | 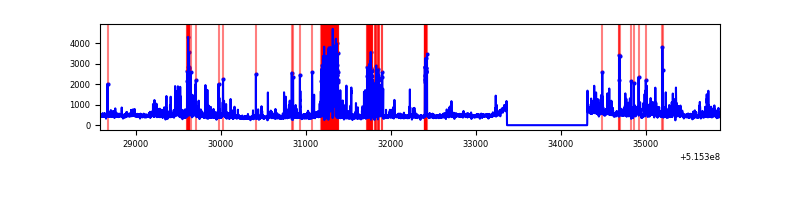 |
Top three noisy pixels from each quadrant. If the there are fewer than three noisy pixels in the level2.evt file, extra rows are filled as -1
| Pixel properties | Quadrant properties | ||||||
|---|---|---|---|---|---|---|---|
| Quadrant | DetID | PixID | Counts | Sigma | Mean | Median | Sigma |
| A | 3 | 14 | 449518 | 2639.72 | 690 | 671 | 170.0 |
| A | 0 | 12 | 387226 | 2273.37 | 690 | 671 | 170.0 |
| A | 7 | 64 | 89001 | 519.48 | 690 | 671 | 170.0 |
| B | 0 | 171 | 510214 | 3531.39 | 672 | 646 | 144.3 |
| B | 5 | 185 | 360902 | 2496.64 | 672 | 646 | 144.3 |
| B | 10 | 247 | 68515 | 470.34 | 672 | 646 | 144.3 |
| C | 15 | 224 | 1330075 | 7536.43 | 648 | 644 | 176.4 |
| C | 12 | 2 | 289822 | 1639.32 | 648 | 644 | 176.4 |
| C | 14 | 96 | 133261 | 751.79 | 648 | 644 | 176.4 |
| D | 3 | 224 | 821483 | 4376.55 | 659 | 629 | 187.6 |
| D | 8 | 240 | 233618 | 1242.23 | 659 | 629 | 187.6 |
| D | 2 | 249 | 74244 | 392.49 | 659 | 629 | 187.6 |
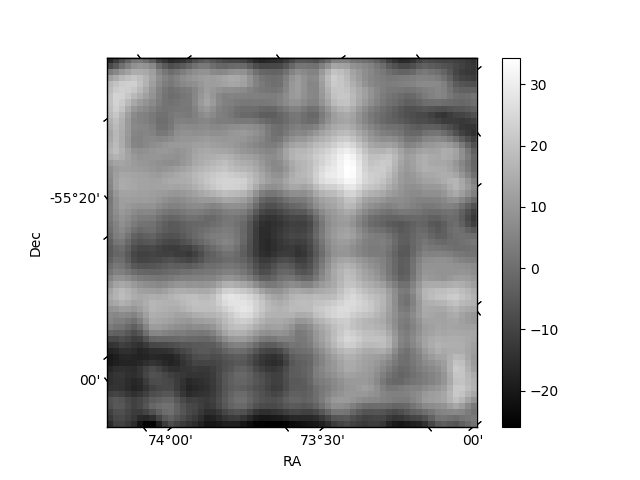
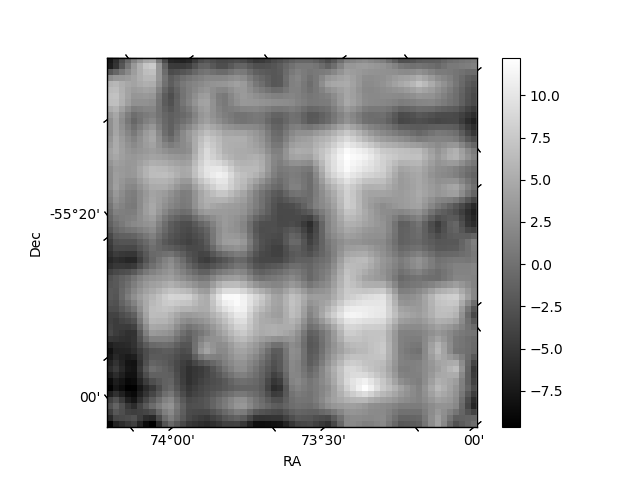
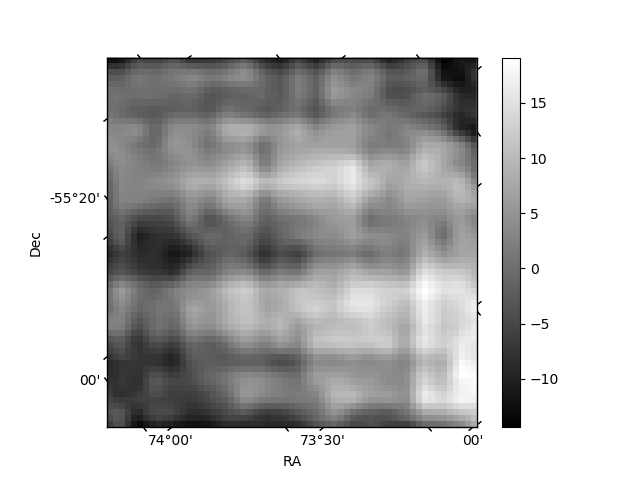
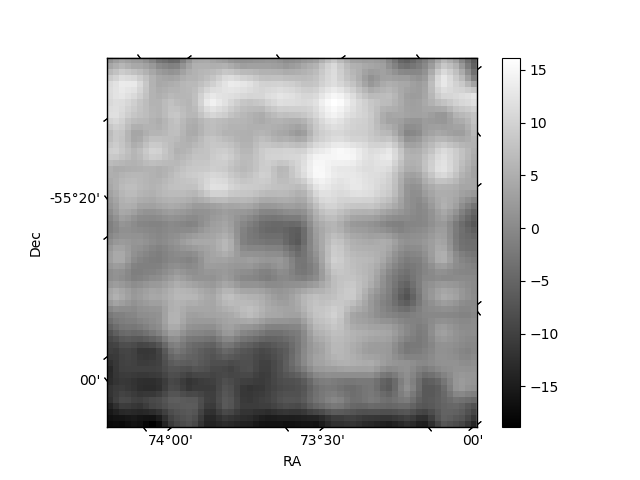
Histogram calculated using DETX and DETY for each event in the final _common_clean file
| Quadrant A | 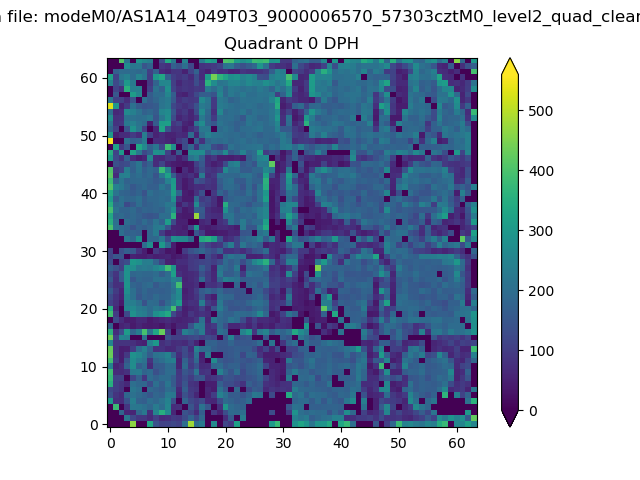 |
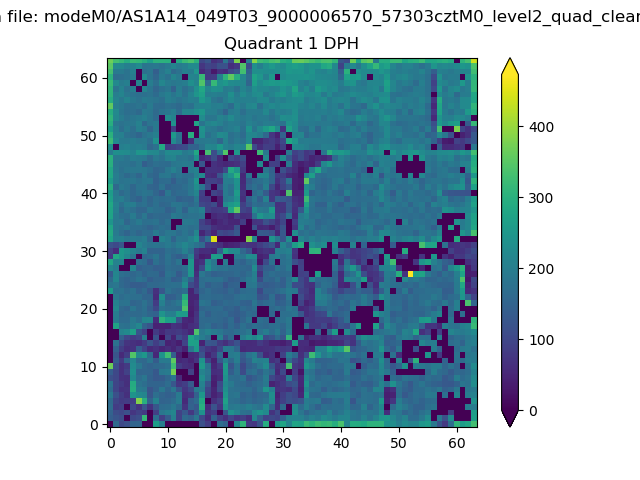 |
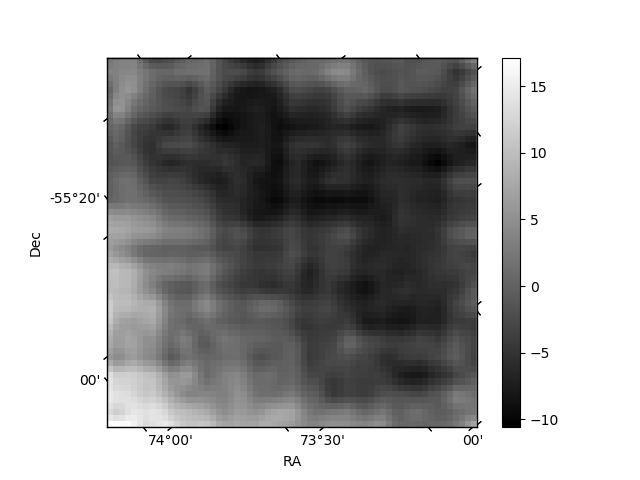
Quadrant B |
|---|---|---|---|
| Quadrant D | 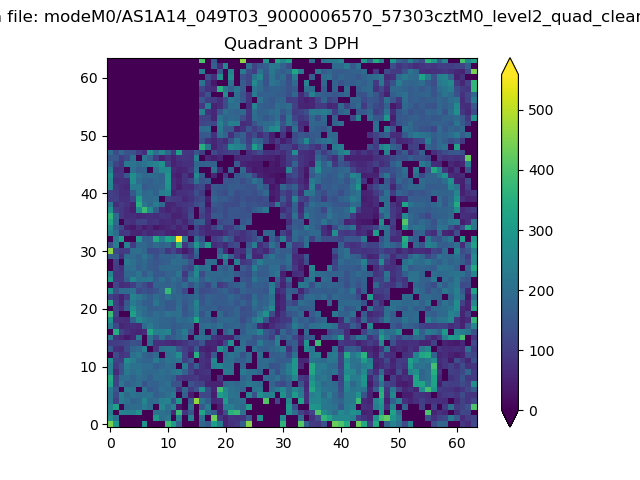 |
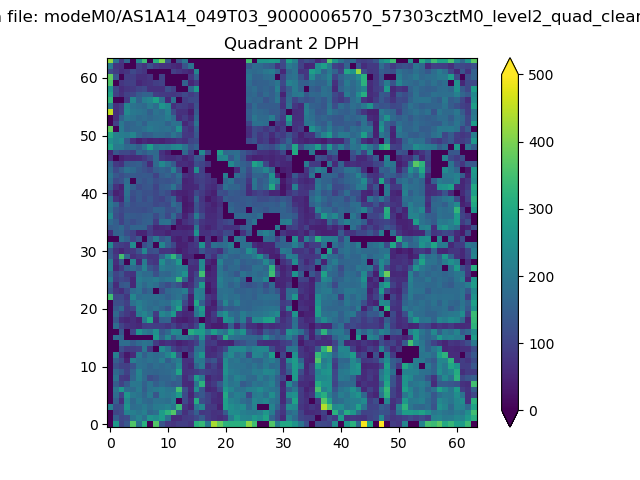 |
Quadrant C |
| Plot type | Count rate plots | Images |
|---|---|---|
| Comparison with Poisson distribution Blue bars denote a histogram of data divided into 1 sec bins. Red curve is a Poisson curve with rate = median count rate of data. |
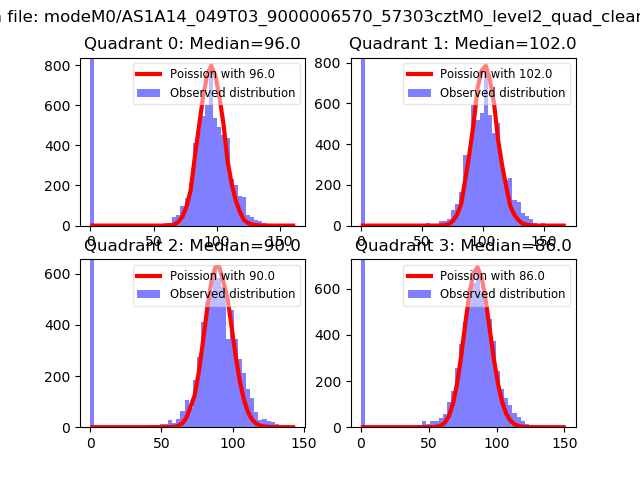 |
 |
| Quadrant-wise count rates Data is divided into 100 sec bins |
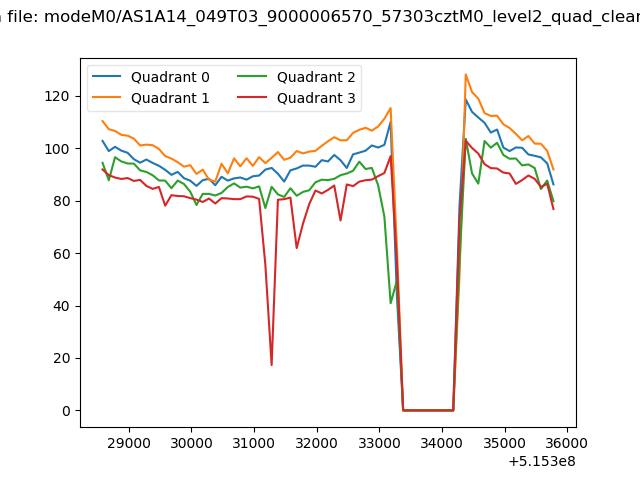 |
|
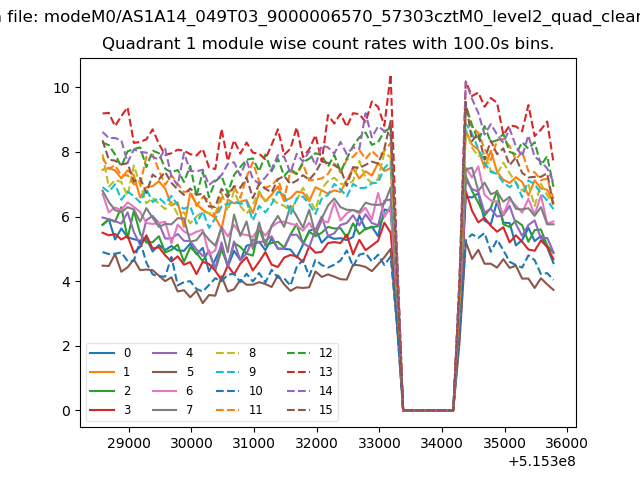
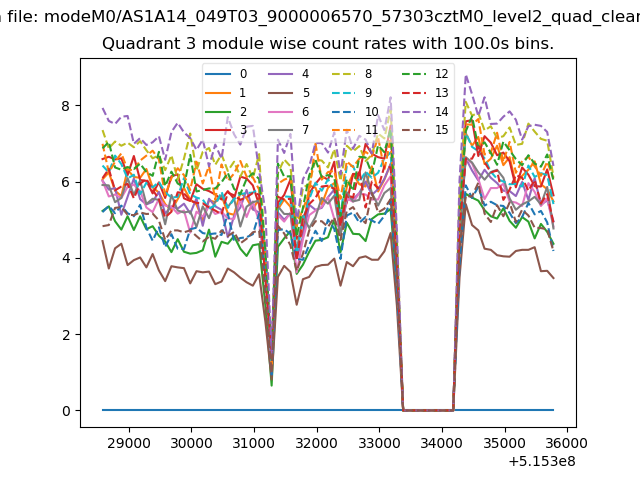
| Module-wise count rates for Quadrant A Data is divided into 100 sec bins |
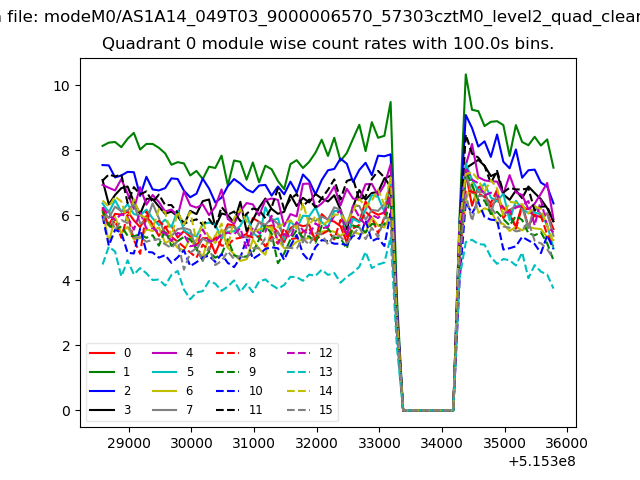 |
 |
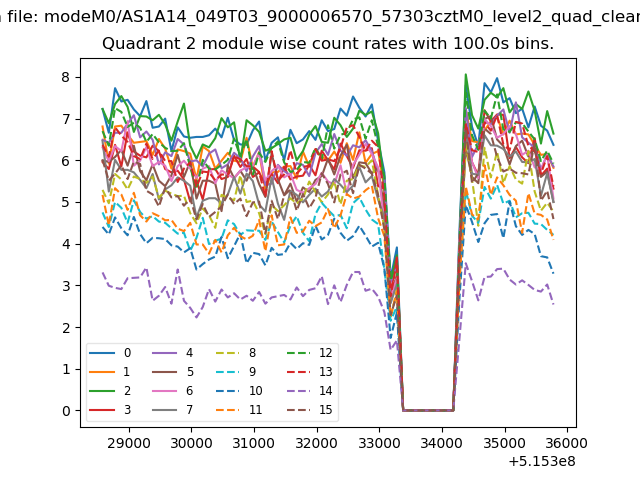
| Module-wise count rates for Quadrant B Data is divided into 100 sec bins |
 |
 |
| Module-wise count rates for Quadrant C Data is divided into 100 sec bins |
 |
 |
| Module-wise count rates for Quadrant D Data is divided into 100 sec bins |
 |
 |
| Parameter | Plot |
|---|---|
| CZT HV Monitor | 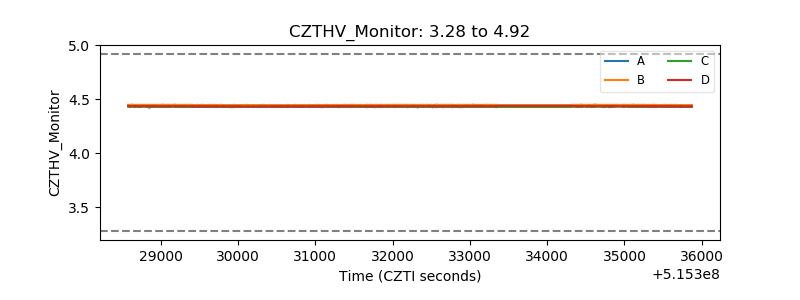 |
| D_VDD | 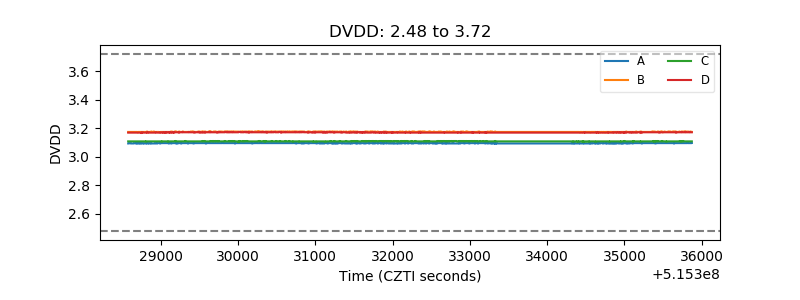 |
| Temperature 1 | 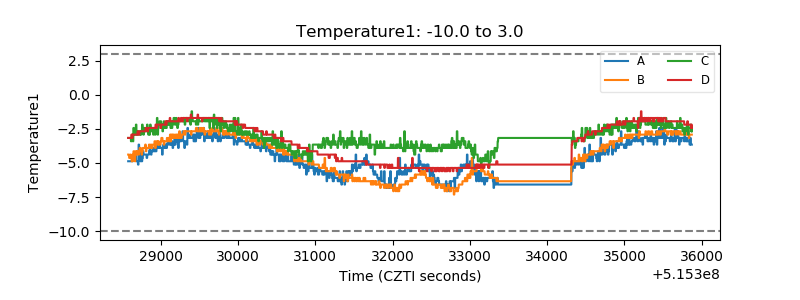 |
| Veto HV Monitor | 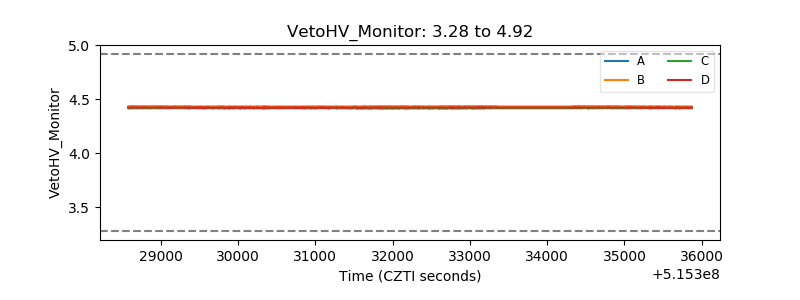 |
| Veto LLD | 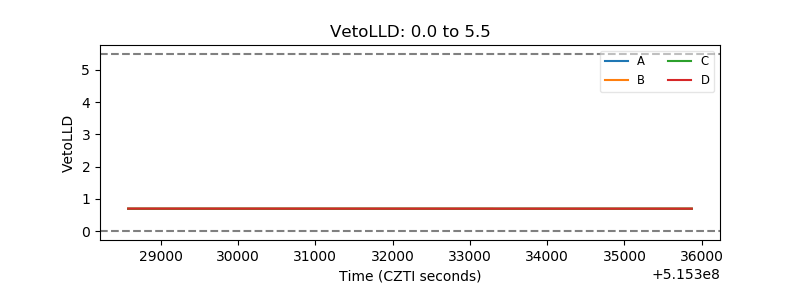 |
| Alpha Counter | 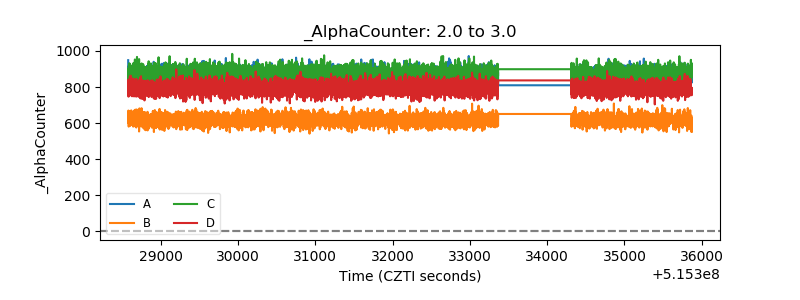 |
| _CPM_Rate | 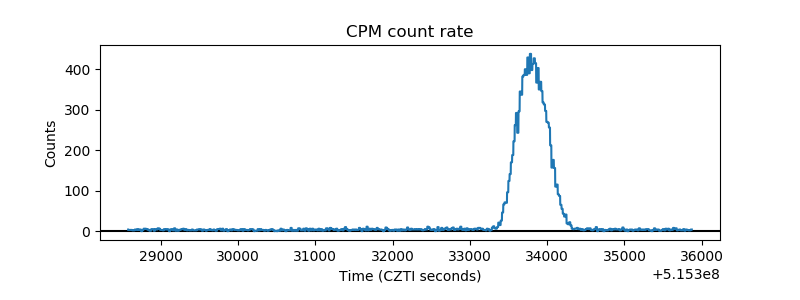 |
| CZT Counter | 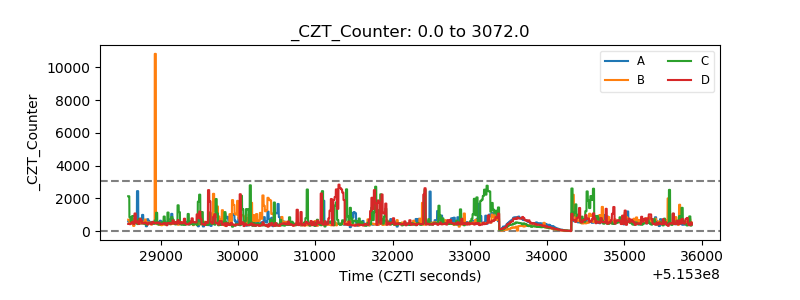 |
| +2.5 Volts monitor | 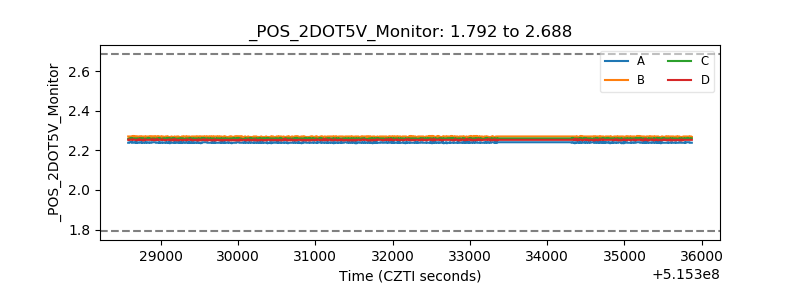 |
| +5 Volts monitor |  |
| _ROLL_ROT | 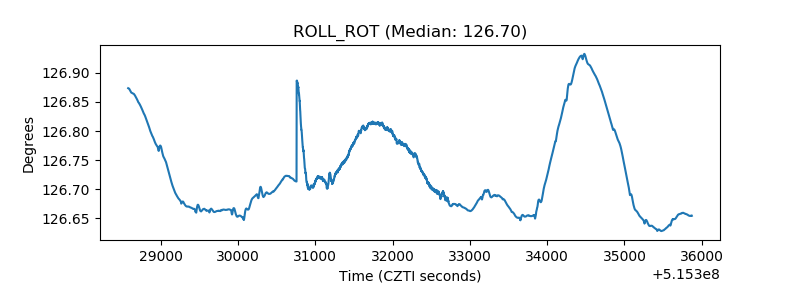 |
| _Roll_DEC | 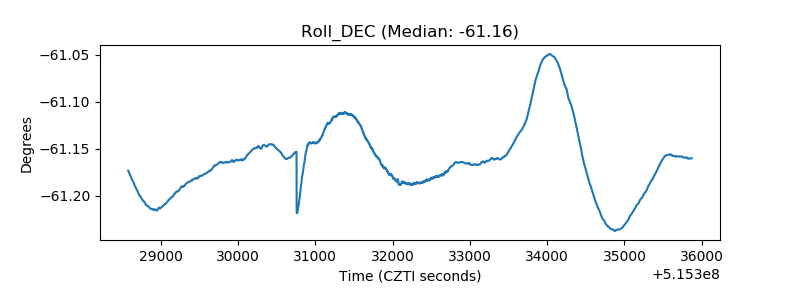 |
| _Roll_RA | 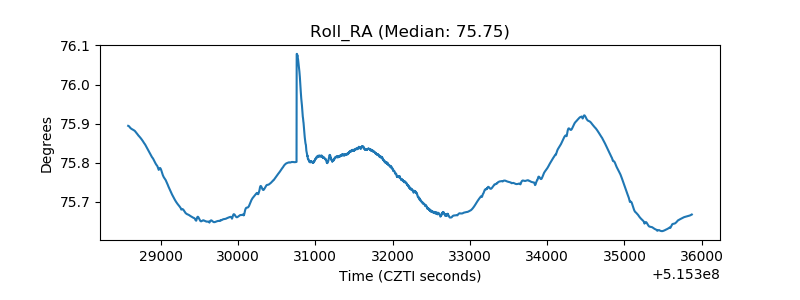 |
| Veto Counter | 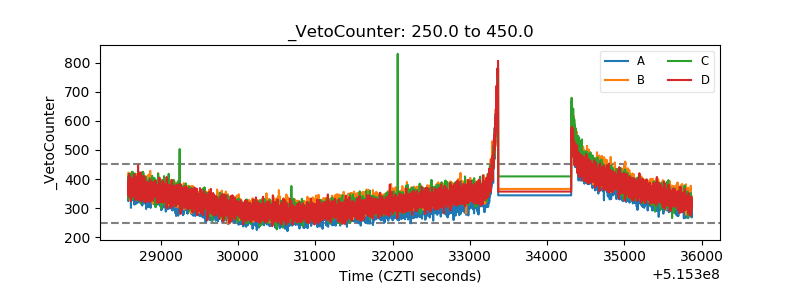 |