| Param | Original file | Final file |
|---|---|---|
| Filename | modeM0/AS1A14_049T03_9000006570_57304cztM0_level2.fits | modeM0/AS1A14_049T03_9000006570_57304cztM0_level2_quad_clean.evt |
| Size (bytes) | 452,790,720 | 93,202,560 |
| Size | 431.8 MB | 88.9 MB |
| Events in quadrant A | 3,486,308 | 624,447 |
| Events in quadrant B | 3,509,782 | 661,254 |
| Events in quadrant C | 4,238,553 | 551,002 |
| Events in quadrant D | 5,031,229 | 541,425 |
| Mode M0 | |||
|---|---|---|---|
| Quadrant | BADHDUFLAG | Total packets | Discarded packets |
| A | 0 | 14780 | 1 |
| B | 0 | 14736 | 2 |
| C | 0 | 17137 | 1 |
| D | 0 | 19394 | 1 |
| Mode M9 | |||
|---|---|---|---|
| Quadrant | BADHDUFLAG | Total packets | Discarded packets |
| A | 0 | 11 | 0 |
| B | 0 | 11 | 0 |
| C | 0 | 11 | 0 |
| D | 0 | 11 | 0 |
| Mode SS | |||
|---|---|---|---|
| Quadrant | BADHDUFLAG | Total packets | Discarded packets |
| A | 0 | 128 | 0 |
| B | 0 | 128 | 0 |
| C | 0 | 128 | 0 |
| D | 0 | 128 | 0 |
| Quadrant | Total seconds | Saturated seconds | Saturation percentage |
|---|---|---|---|
| A | 6368 | 83 | 1.303392% |
| B | 6367 | 149 | 2.340192% |
| C | 6368 | 468 | 7.349246% |
| D | 6368 | 398 | 6.250000% |
Noise dominated data is calculated using 1-second bins in cleaned event files. If a bin has >2000 counts, and if more than 50% of those come from <1% of pixels, then it is considered to be noise-dominated and hence unusable.
| Quadrant | # 1 sec bins | Bins with >0 counts | Bins with >2000 counts | High rate bins dominated by noise | Noise dominated (total time) | Noise dominated (detector-on time) | Marked lightcurve |
|---|---|---|---|---|---|---|---|
| A | 7428 | 6368 | 12 | 12 | 0.16% | 0.19% | 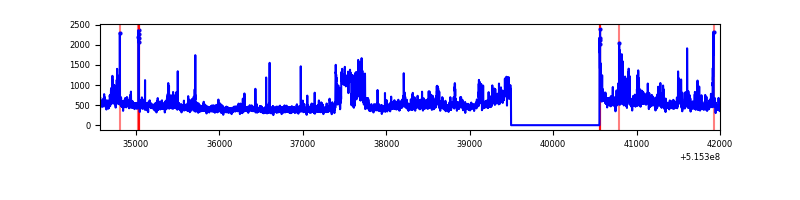 |
| B | 7427 | 6367 | 49 | 49 | 0.66% | 0.77% | 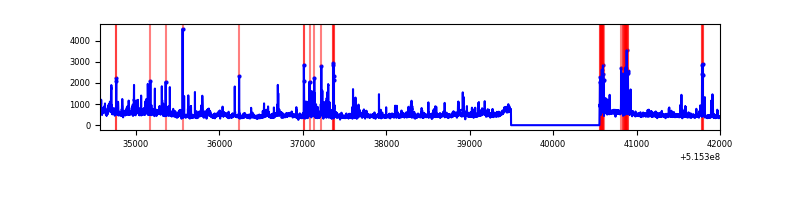 |
| C | 7428 | 6368 | 371 | 371 | 4.99% | 5.83% | 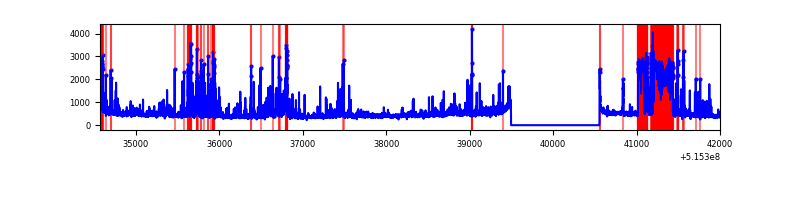 |
| D | 7428 | 6368 | 307 | 307 | 4.13% | 4.82% | 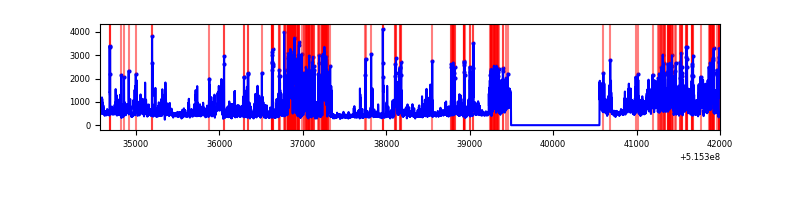 |
Top three noisy pixels from each quadrant. If the there are fewer than three noisy pixels in the level2.evt file, extra rows are filled as -1
| Pixel properties | Quadrant properties | ||||||
|---|---|---|---|---|---|---|---|
| Quadrant | DetID | PixID | Counts | Sigma | Mean | Median | Sigma |
| A | 3 | 14 | 389956 | 2264.08 | 701 | 683 | 171.9 |
| A | 0 | 12 | 277414 | 1609.52 | 701 | 683 | 171.9 |
| A | 8 | 4 | 56097 | 322.3 | 701 | 683 | 171.9 |
| B | 5 | 185 | 435087 | 2974.6 | 682 | 657 | 146.0 |
| B | 0 | 171 | 114146 | 777.07 | 682 | 657 | 146.0 |
| B | 10 | 16 | 86566 | 588.23 | 682 | 657 | 146.0 |
| C | 15 | 224 | 1397991 | 8028.89 | 637 | 632 | 174.0 |
| C | 10 | 22 | 89338 | 509.68 | 637 | 632 | 174.0 |
| C | 14 | 96 | 73390 | 418.05 | 637 | 632 | 174.0 |
| D | 3 | 224 | 1414543 | 7571.1 | 660 | 630 | 186.8 |
| D | 2 | 249 | 456678 | 2442.01 | 660 | 630 | 186.8 |
| D | 8 | 240 | 412717 | 2206.61 | 660 | 630 | 186.8 |
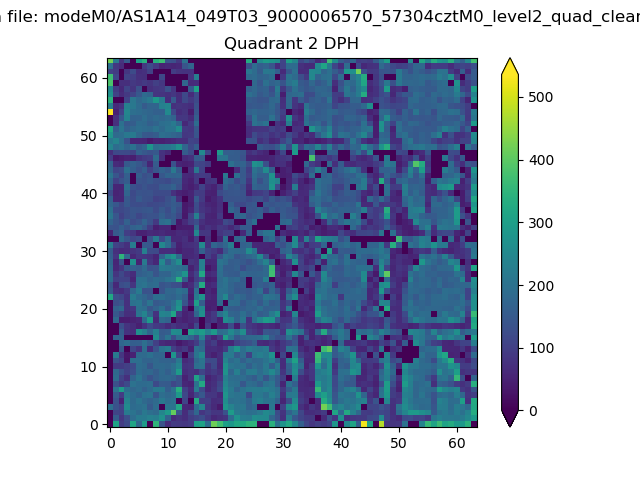
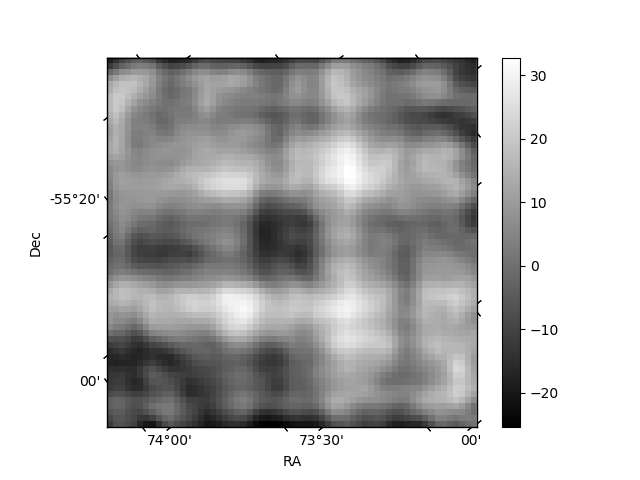
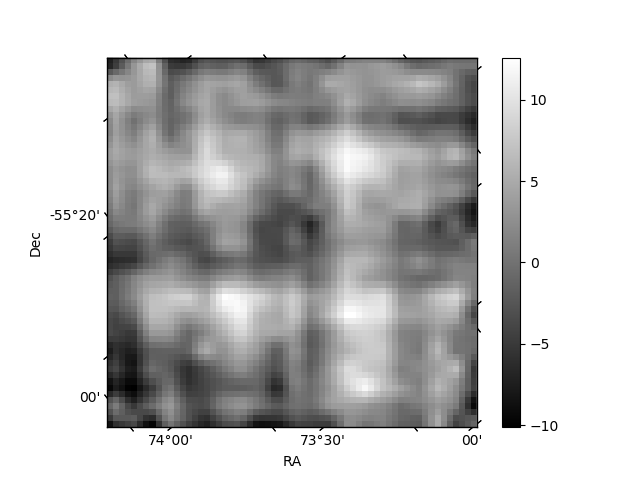
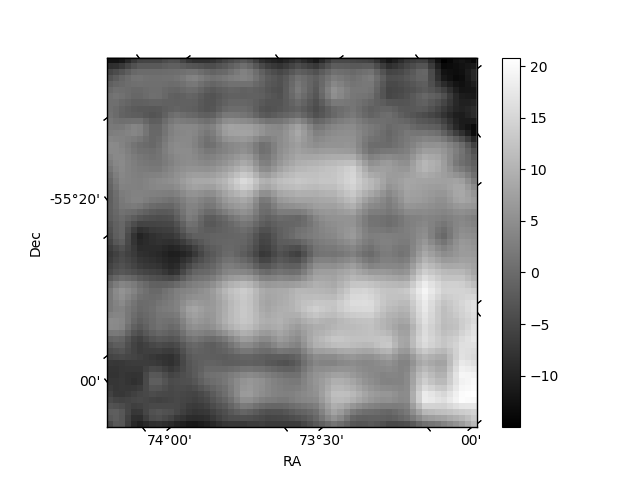
Histogram calculated using DETX and DETY for each event in the final _common_clean file
| Quadrant A | 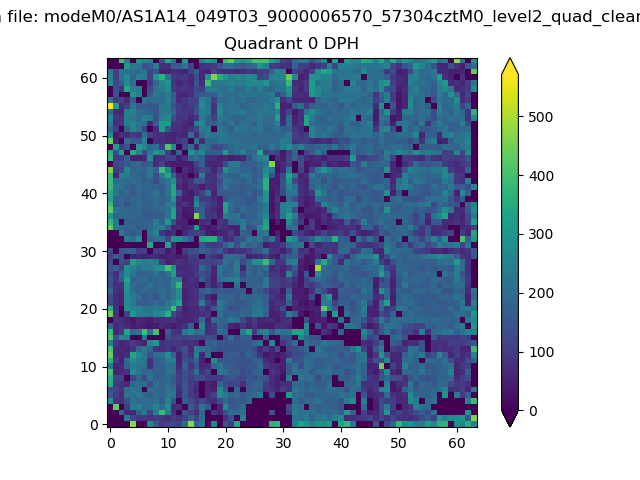 |
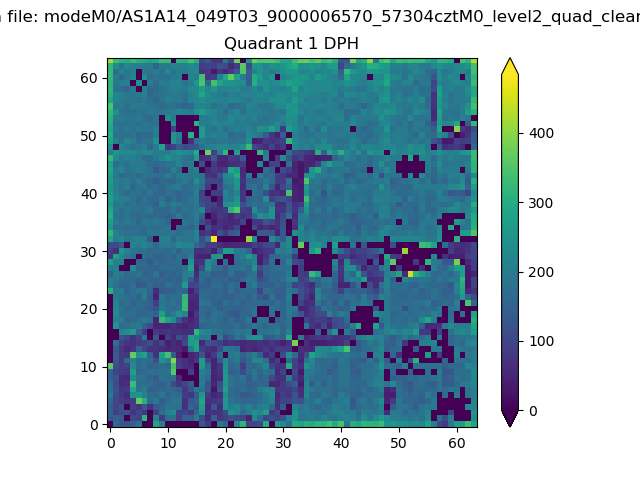 |
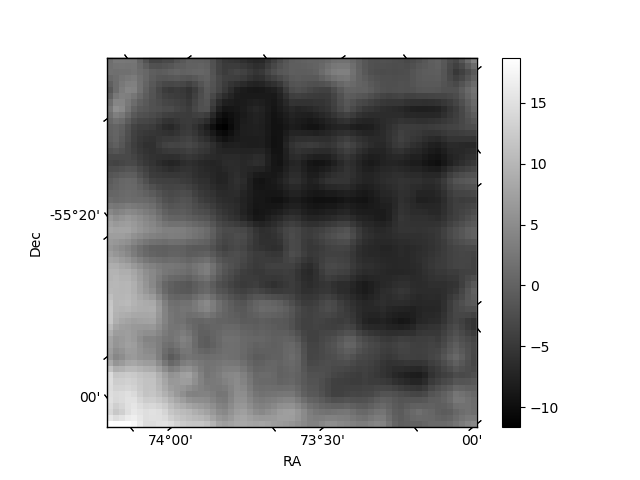
Quadrant B |
|---|---|---|---|
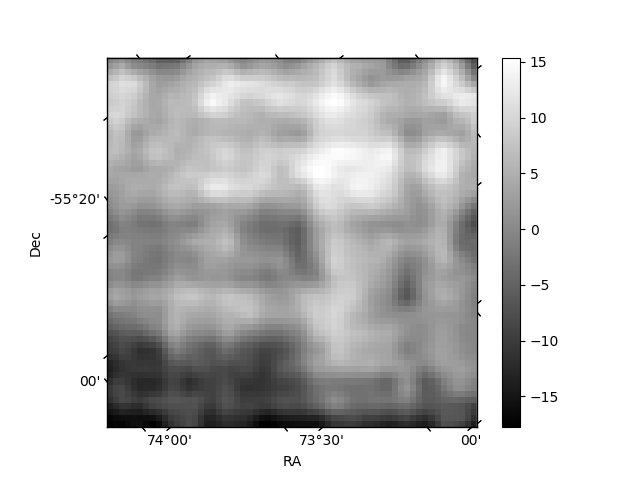
| Quadrant D | 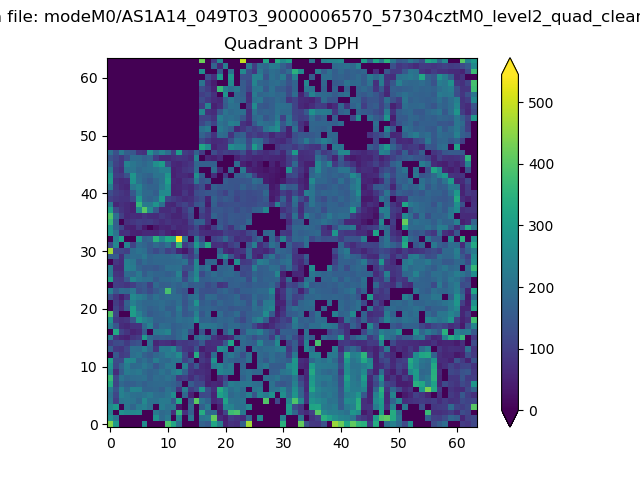 |
 |
Quadrant C |
| Plot type | Count rate plots | Images |
|---|---|---|
| Comparison with Poisson distribution Blue bars denote a histogram of data divided into 1 sec bins. Red curve is a Poisson curve with rate = median count rate of data. |
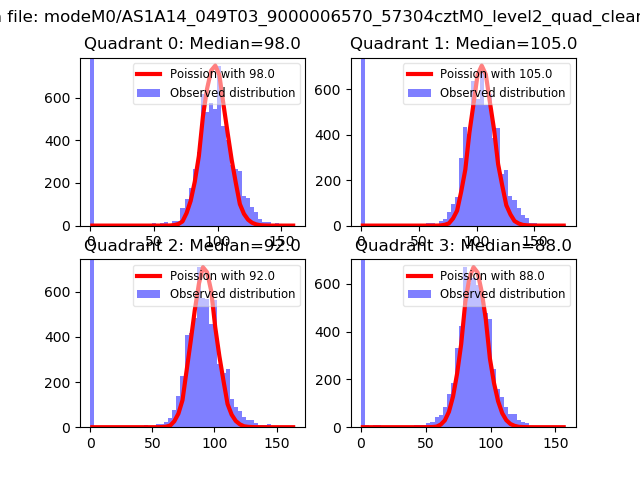 |
 |
| Quadrant-wise count rates Data is divided into 100 sec bins |
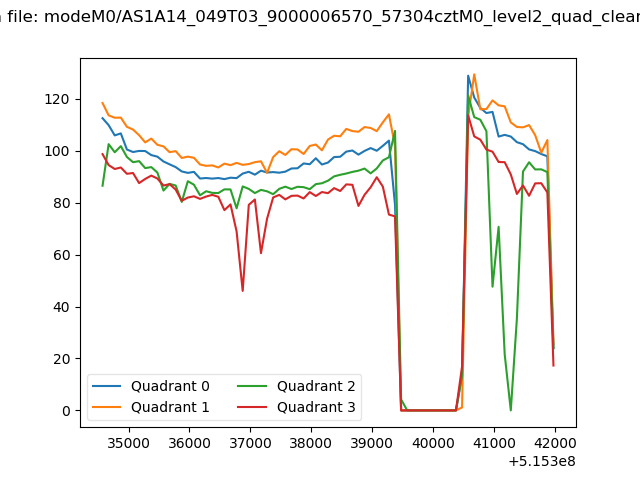 |
|
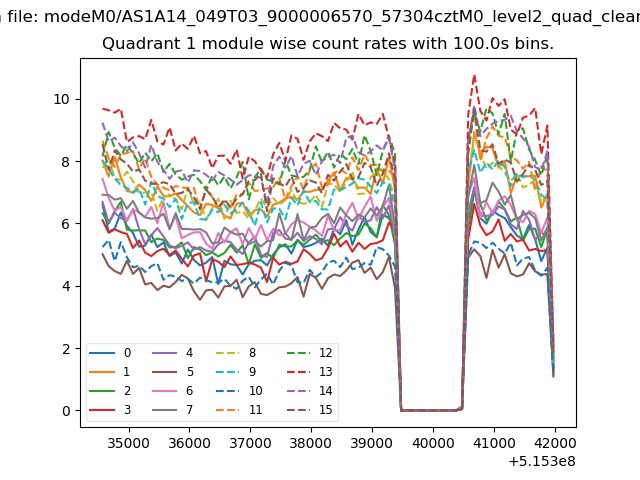
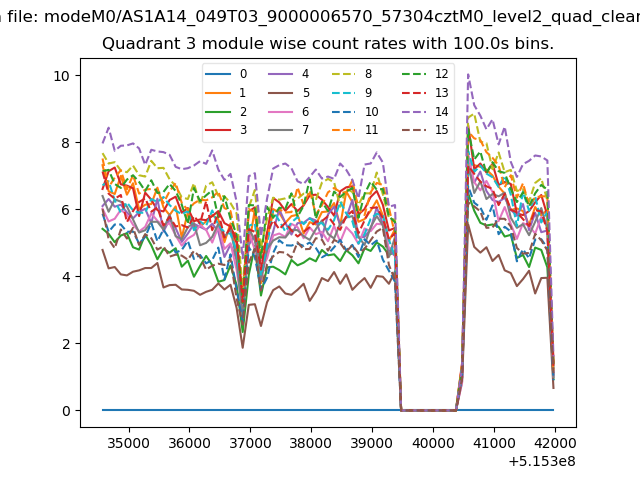
| Module-wise count rates for Quadrant A Data is divided into 100 sec bins |
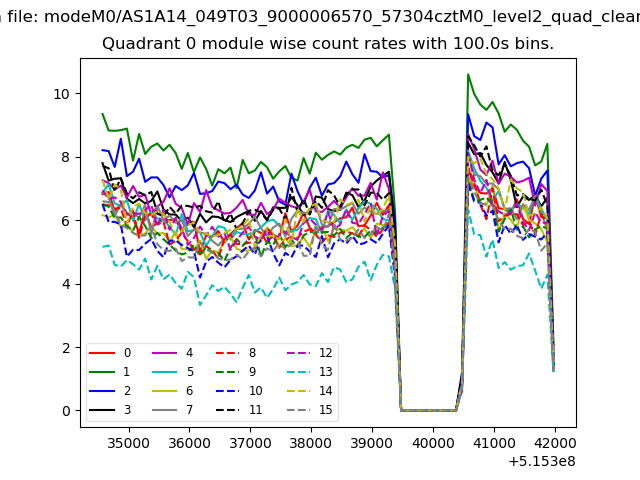 |
 |
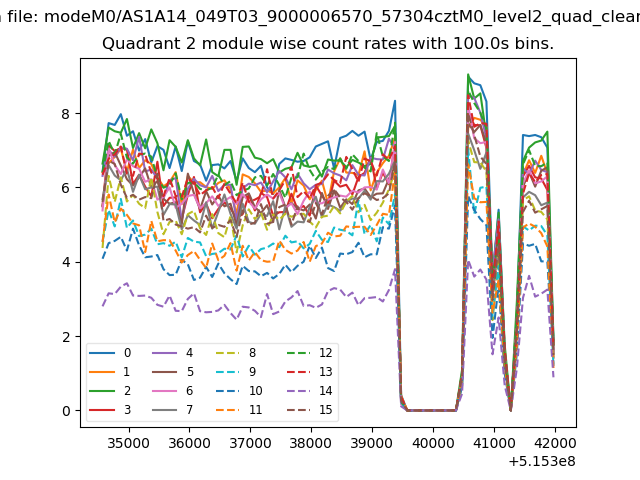
| Module-wise count rates for Quadrant B Data is divided into 100 sec bins |
 |
 |
| Module-wise count rates for Quadrant C Data is divided into 100 sec bins |
 |
 |
| Module-wise count rates for Quadrant D Data is divided into 100 sec bins |
 |
 |
| Parameter | Plot |
|---|---|
| CZT HV Monitor |  |
| D_VDD | 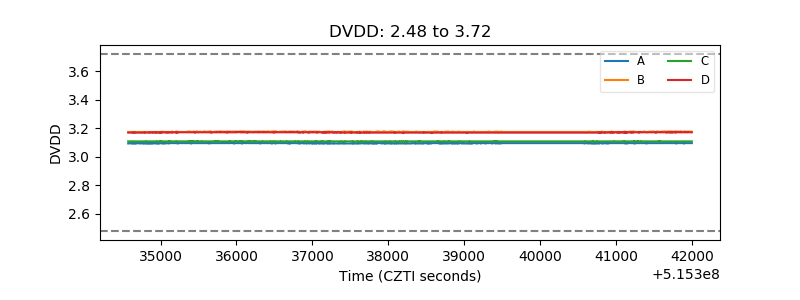 |
| Temperature 1 | 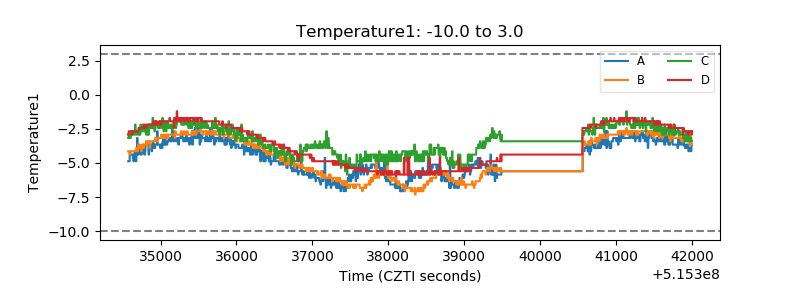 |
| Veto HV Monitor | 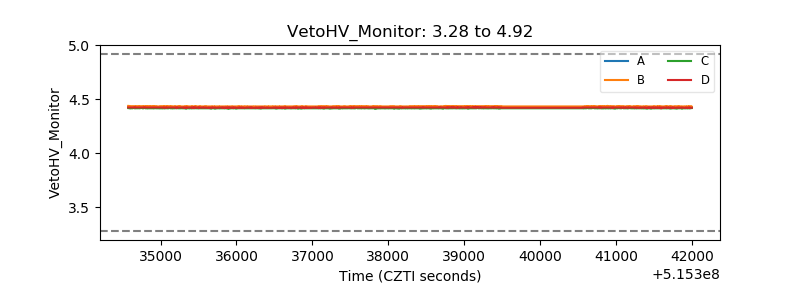 |
| Veto LLD | 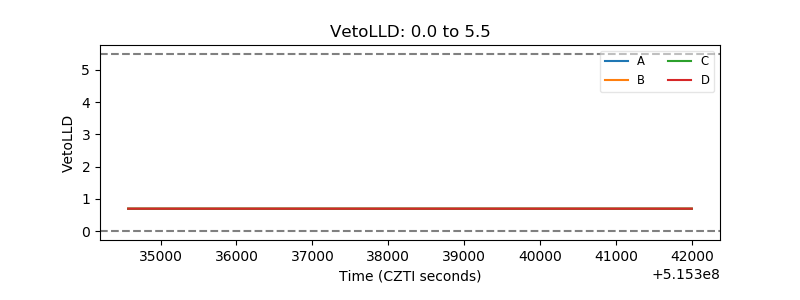 |
| Alpha Counter | 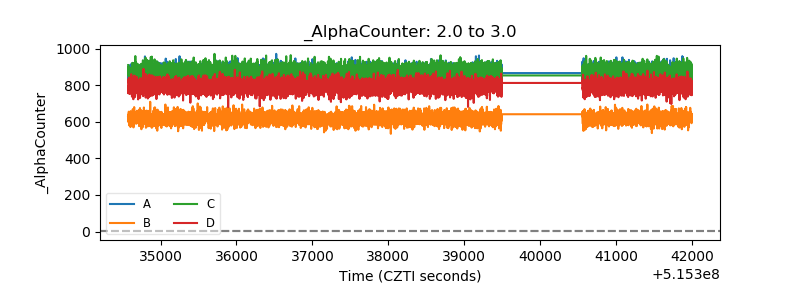 |
| _CPM_Rate | 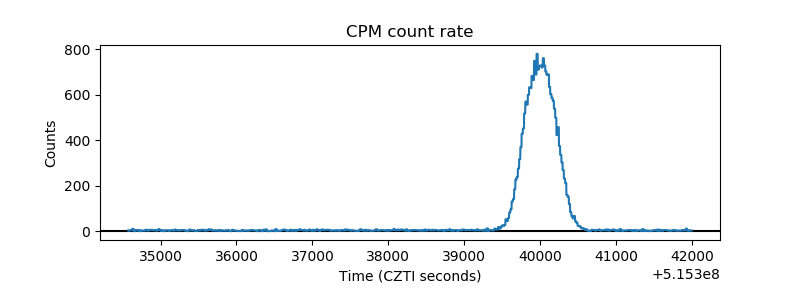 |
| CZT Counter | 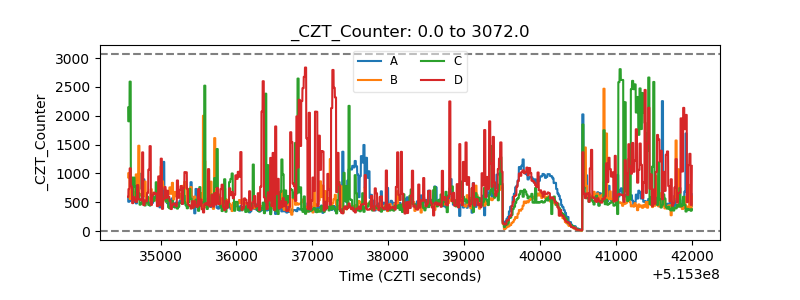 |
| +2.5 Volts monitor | 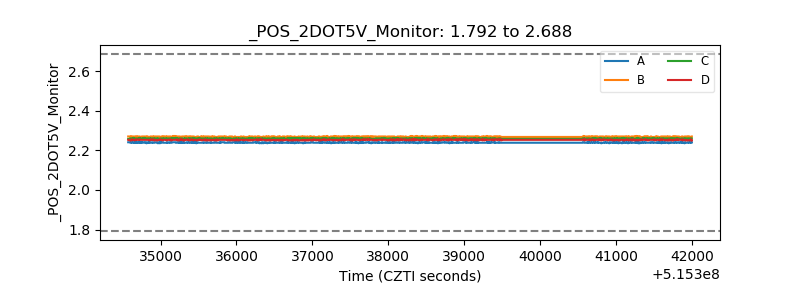 |
| +5 Volts monitor | 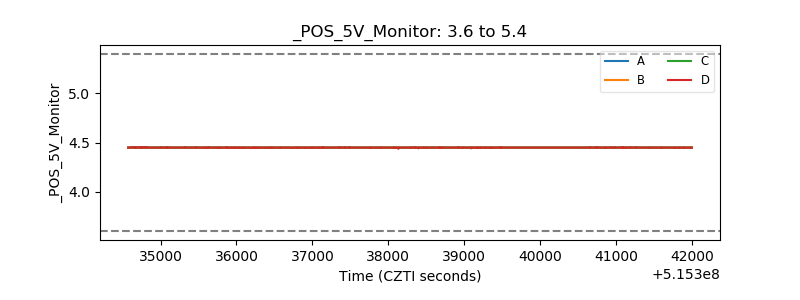 |
| _ROLL_ROT | 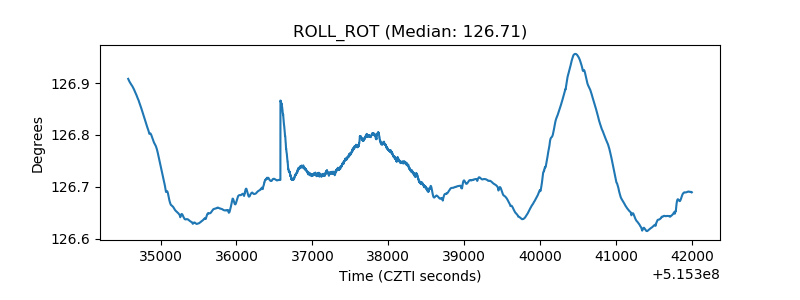 |
| _Roll_DEC | 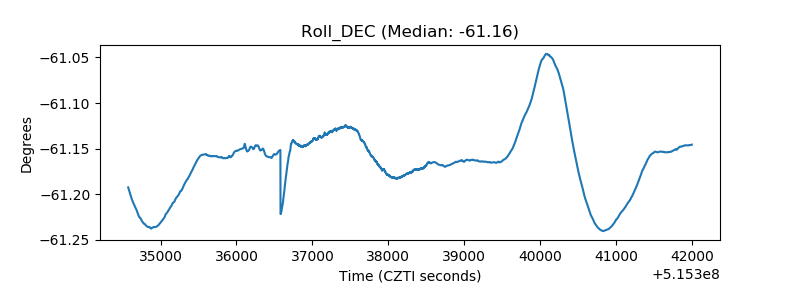 |
| _Roll_RA | 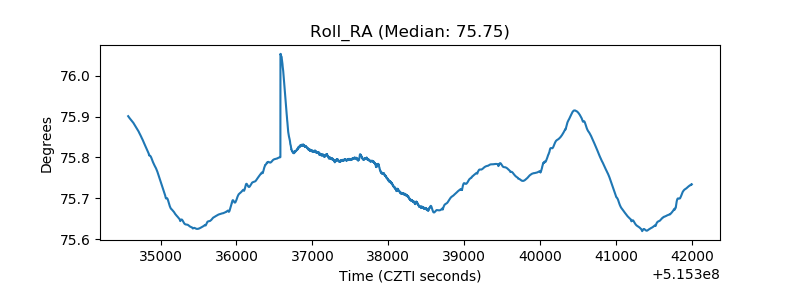 |
| Veto Counter | 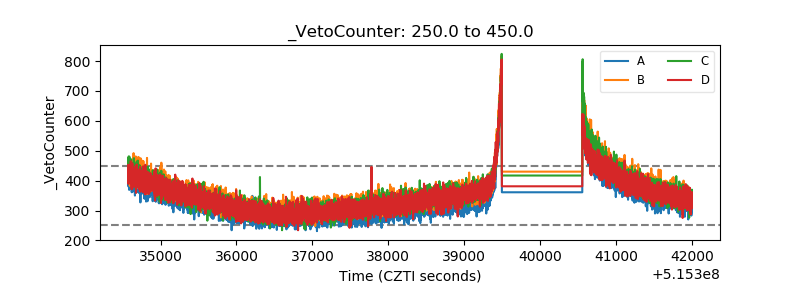 |