| Param | Original file | Final file |
|---|---|---|
| Filename | modeM0/AS1A14_049T03_9000006570_57306cztM0_level2.fits | modeM0/AS1A14_049T03_9000006570_57306cztM0_level2_quad_clean.evt |
| Size (bytes) | 400,374,720 | 97,318,080 |
| Size | 381.8 MB | 92.8 MB |
| Events in quadrant A | 3,118,115 | 650,836 |
| Events in quadrant B | 3,238,778 | 686,187 |
| Events in quadrant C | 4,099,788 | 597,024 |
| Events in quadrant D | 3,871,008 | 570,944 |
| Mode M0 | |||
|---|---|---|---|
| Quadrant | BADHDUFLAG | Total packets | Discarded packets |
| A | 0 | 13607 | 2 |
| B | 0 | 14032 | 2 |
| C | 0 | 16614 | 3 |
| D | 0 | 15870 | 2 |
| Mode M9 | |||
|---|---|---|---|
| Quadrant | BADHDUFLAG | Total packets | Discarded packets |
| A | 0 | 15 | 0 |
| B | 0 | 16 | 0 |
| C | 0 | 16 | 0 |
| D | 0 | 16 | 0 |
| Mode SS | |||
|---|---|---|---|
| Quadrant | BADHDUFLAG | Total packets | Discarded packets |
| A | 0 | 128 | 0 |
| B | 0 | 128 | 0 |
| C | 0 | 128 | 0 |
| D | 0 | 128 | 0 |
| Quadrant | Total seconds | Saturated seconds | Saturation percentage |
|---|---|---|---|
| A | 6335 | 51 | 0.805051% |
| B | 6335 | 145 | 2.288871% |
| C | 6334 | 190 | 2.999684% |
| D | 6334 | 125 | 1.973476% |
Noise dominated data is calculated using 1-second bins in cleaned event files. If a bin has >2000 counts, and if more than 50% of those come from <1% of pixels, then it is considered to be noise-dominated and hence unusable.
| Quadrant | # 1 sec bins | Bins with >0 counts | Bins with >2000 counts | High rate bins dominated by noise | Noise dominated (total time) | Noise dominated (detector-on time) | Marked lightcurve |
|---|---|---|---|---|---|---|---|
| A | 7540 | 6336 | 13 | 13 | 0.17% | 0.21% | 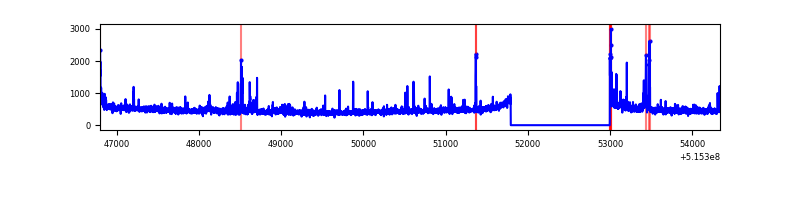 |
| B | 7540 | 6336 | 61 | 61 | 0.81% | 0.96% | 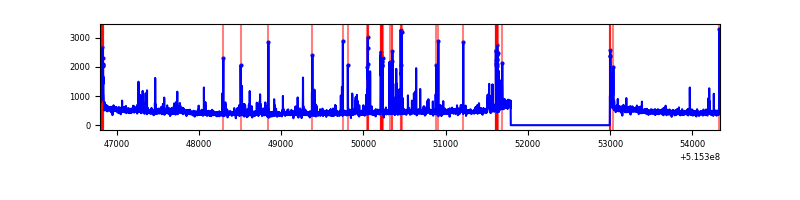 |
| C | 7539 | 6335 | 160 | 160 | 2.12% | 2.53% | 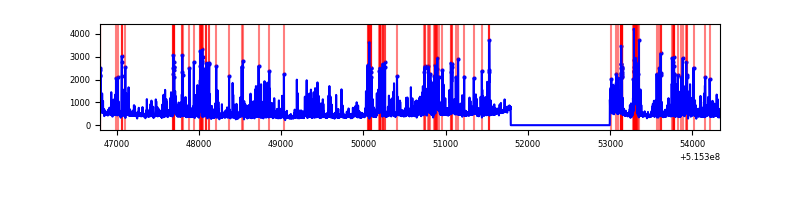 |
| D | 7539 | 6335 | 124 | 124 | 1.64% | 1.96% | 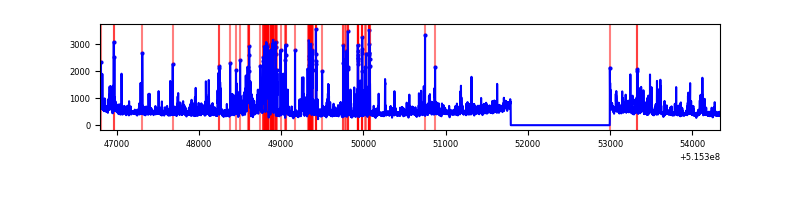 |
Top three noisy pixels from each quadrant. If the there are fewer than three noisy pixels in the level2.evt file, extra rows are filled as -1
| Pixel properties | Quadrant properties | ||||||
|---|---|---|---|---|---|---|---|
| Quadrant | DetID | PixID | Counts | Sigma | Mean | Median | Sigma |
| A | 3 | 14 | 209645 | 1194.03 | 708 | 689 | 175.0 |
| A | 8 | 4 | 80775 | 457.63 | 708 | 689 | 175.0 |
| A | 0 | 12 | 40465 | 227.29 | 708 | 689 | 175.0 |
| B | 8 | 234 | 171221 | 1138.09 | 695 | 670 | 149.9 |
| B | 5 | 185 | 86459 | 572.47 | 695 | 670 | 149.9 |
| B | 10 | 16 | 70550 | 466.31 | 695 | 670 | 149.9 |
| C | 15 | 224 | 1201067 | 6561.31 | 667 | 661 | 183.0 |
| C | 14 | 254 | 175741 | 956.97 | 667 | 661 | 183.0 |
| C | 12 | 252 | 32200 | 172.39 | 667 | 661 | 183.0 |
| D | 2 | 249 | 593196 | 3116.11 | 670 | 640 | 190.2 |
| D | 3 | 224 | 417550 | 2192.43 | 670 | 640 | 190.2 |
| D | 8 | 240 | 128812 | 674.03 | 670 | 640 | 190.2 |
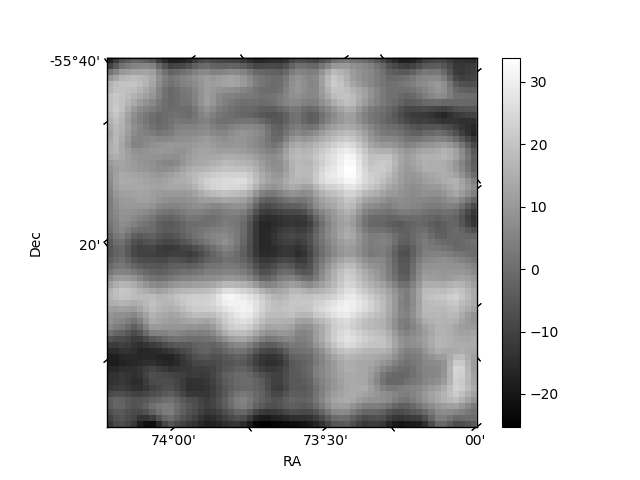
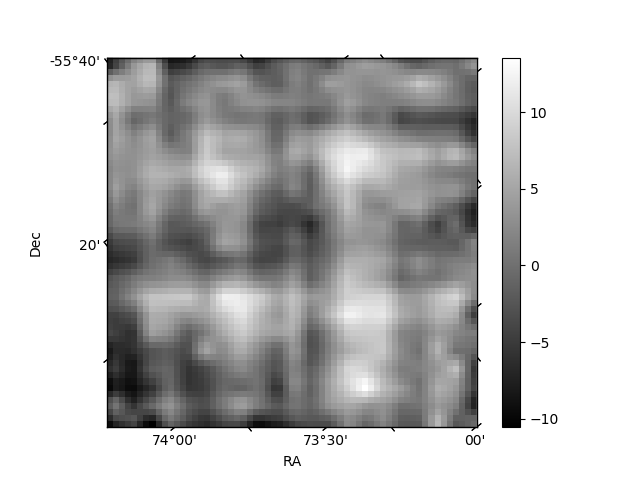
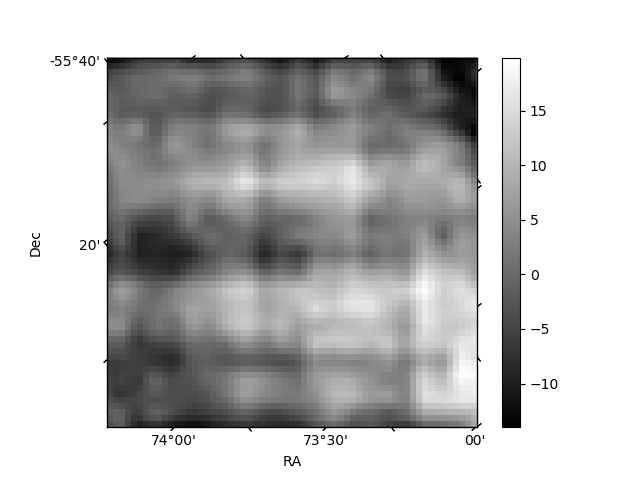
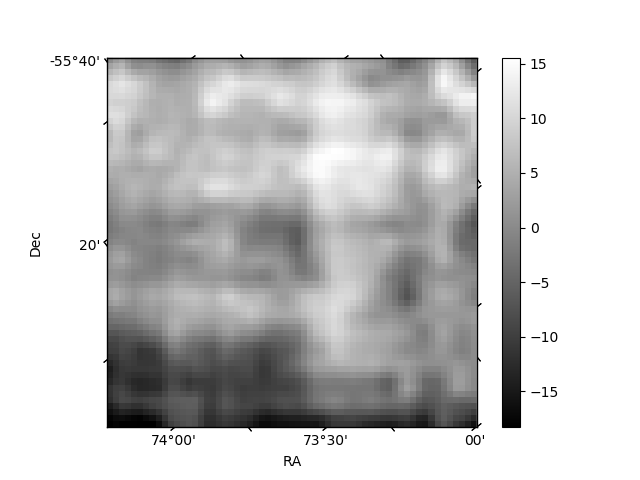
Histogram calculated using DETX and DETY for each event in the final _common_clean file
| Quadrant A | 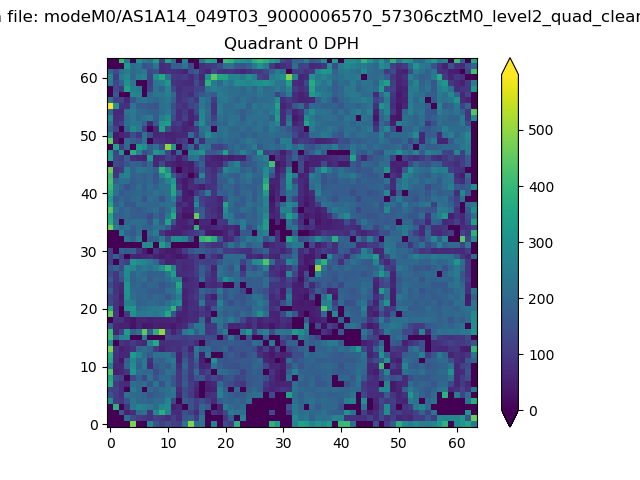 |
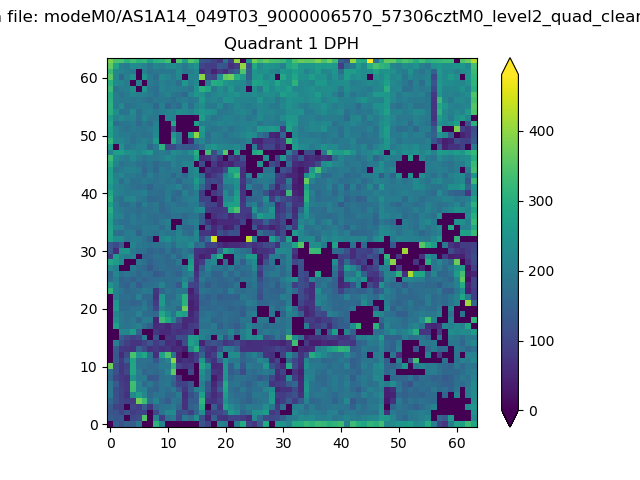 |
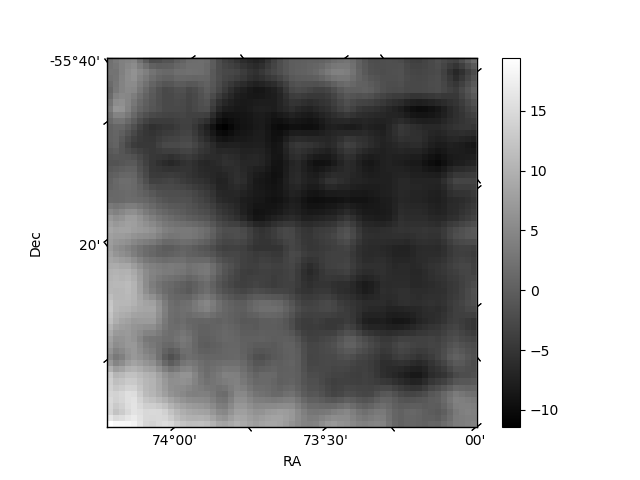
Quadrant B |
|---|---|---|---|
| Quadrant D | 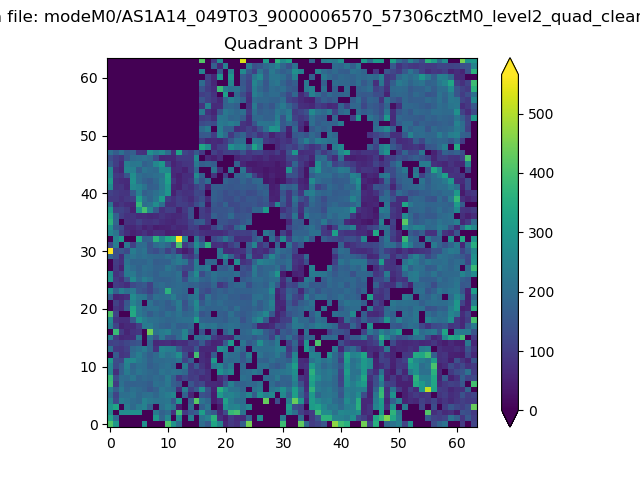 |
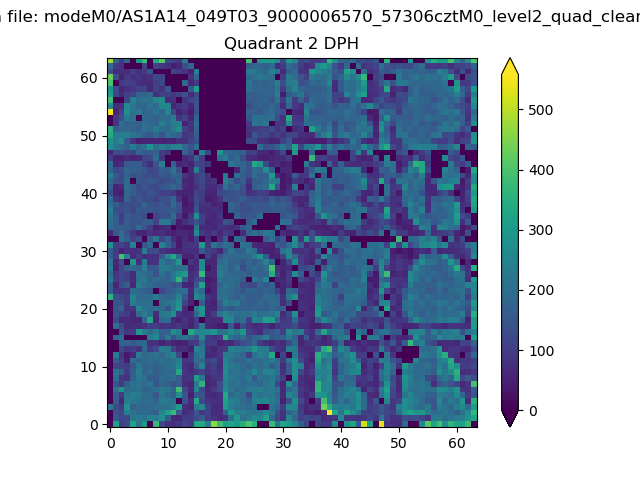 |
Quadrant C |
| Plot type | Count rate plots | Images |
|---|---|---|
| Comparison with Poisson distribution Blue bars denote a histogram of data divided into 1 sec bins. Red curve is a Poisson curve with rate = median count rate of data. |
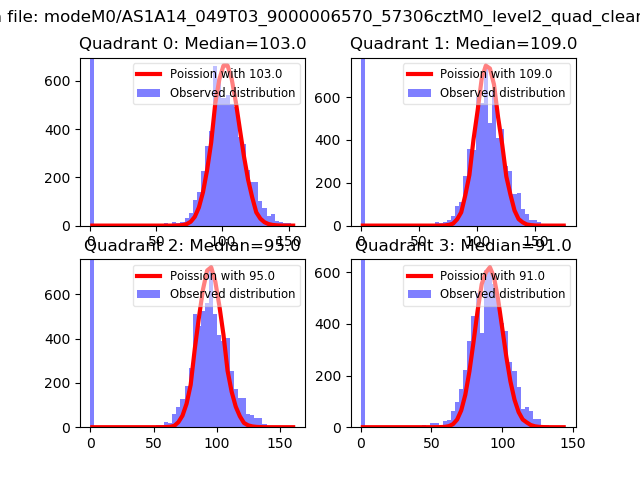 |
 |
| Quadrant-wise count rates Data is divided into 100 sec bins |
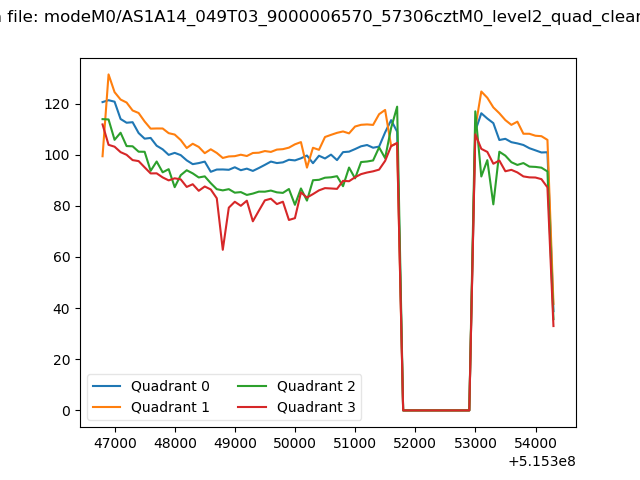 |
|
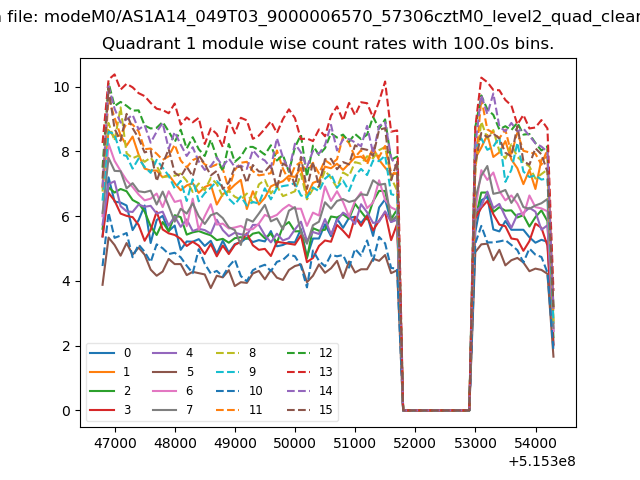
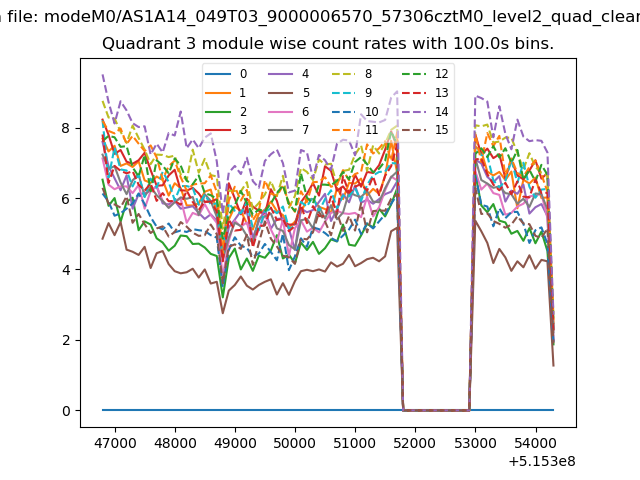
| Module-wise count rates for Quadrant A Data is divided into 100 sec bins |
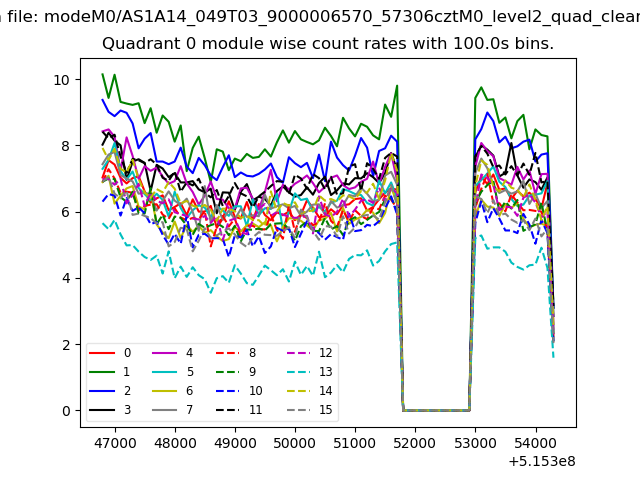 |
 |
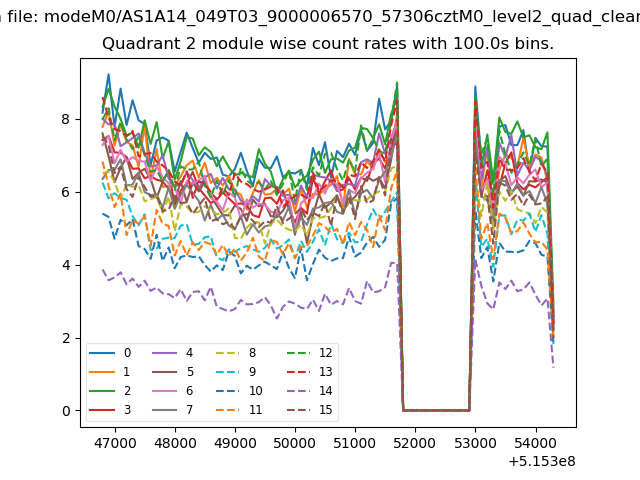
| Module-wise count rates for Quadrant B Data is divided into 100 sec bins |
 |
 |
| Module-wise count rates for Quadrant C Data is divided into 100 sec bins |
 |
 |
| Module-wise count rates for Quadrant D Data is divided into 100 sec bins |
 |
 |
| Parameter | Plot |
|---|---|
| CZT HV Monitor |  |
| D_VDD | 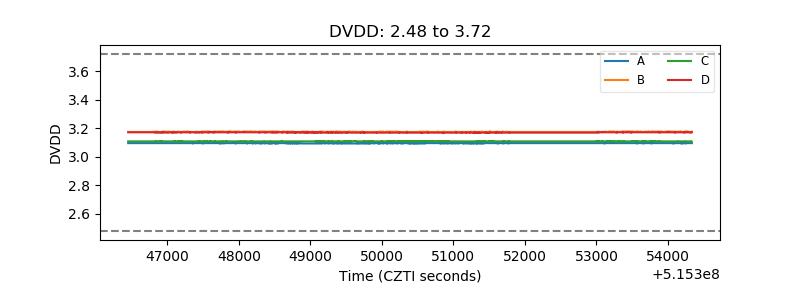 |
| Temperature 1 | 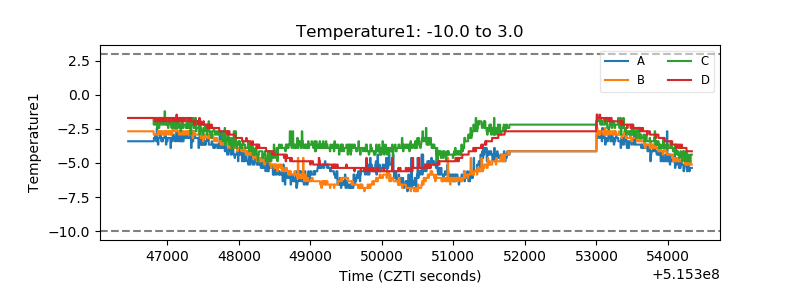 |
| Veto HV Monitor | 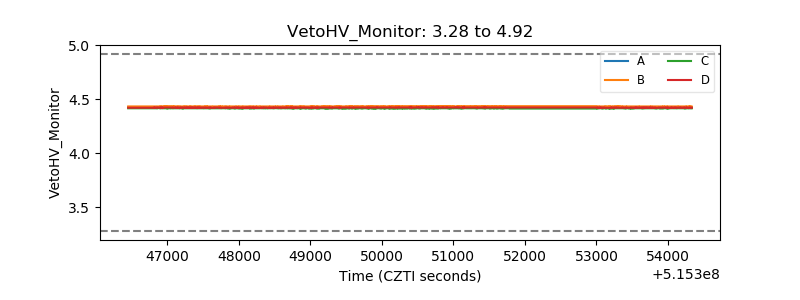 |
| Veto LLD | 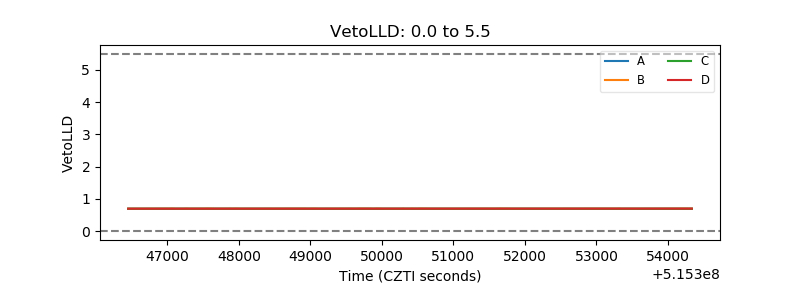 |
| Alpha Counter | 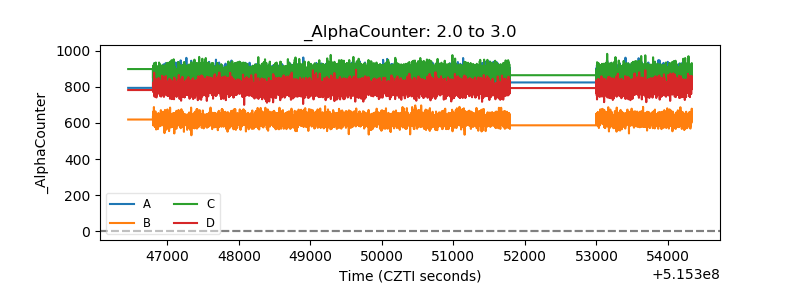 |
| _CPM_Rate | 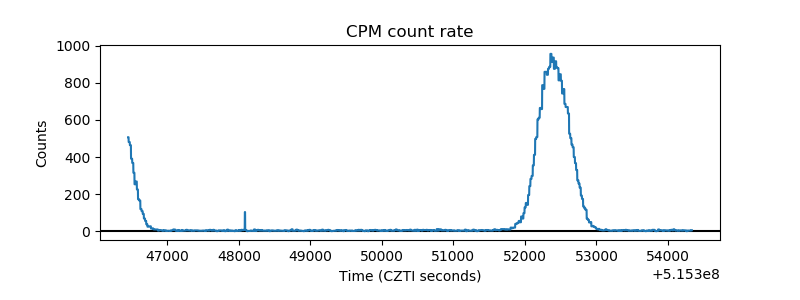 |
| CZT Counter | 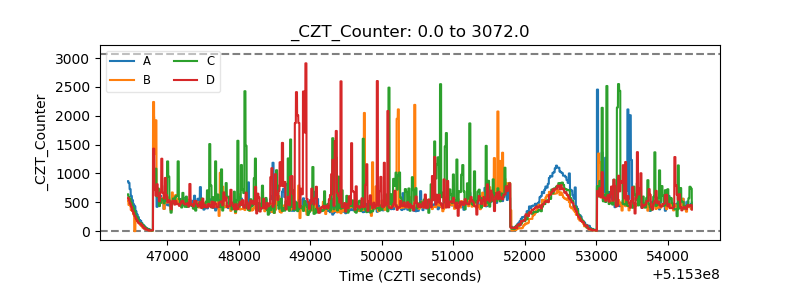 |
| +2.5 Volts monitor |  |
| +5 Volts monitor |  |
| _ROLL_ROT | 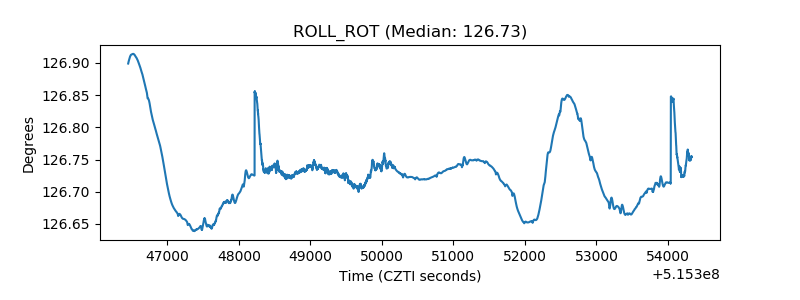 |
| _Roll_DEC | 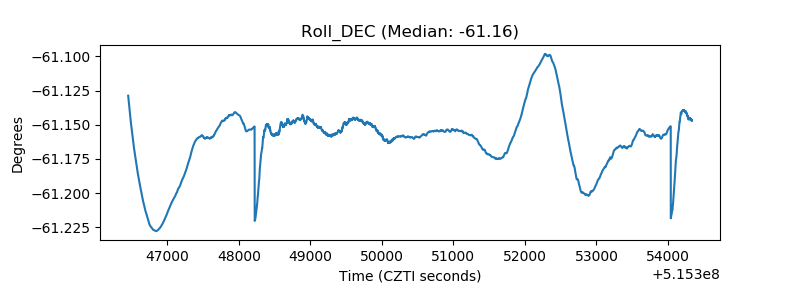 |
| _Roll_RA | 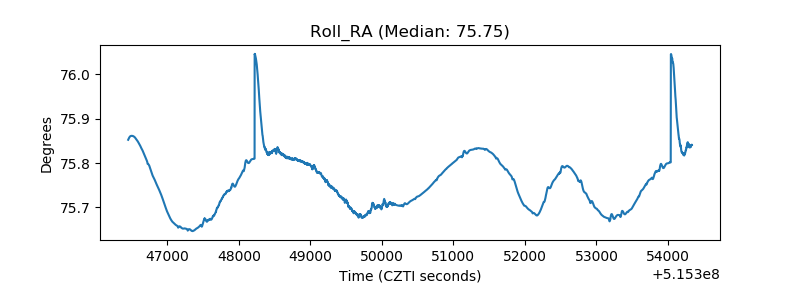 |
| Veto Counter | 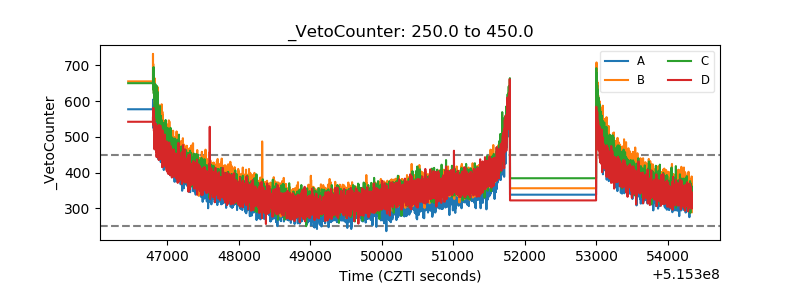 |