| Param | Original file | Final file |
|---|---|---|
| Filename | modeM0/AS1A14_049T03_9000006570_57307cztM0_level2.fits | modeM0/AS1A14_049T03_9000006570_57307cztM0_level2_quad_clean.evt |
| Size (bytes) | 380,445,120 | 91,920,960 |
| Size | 362.8 MB | 87.7 MB |
| Events in quadrant A | 2,903,380 | 613,612 |
| Events in quadrant B | 3,053,169 | 650,211 |
| Events in quadrant C | 4,440,737 | 554,518 |
| Events in quadrant D | 3,211,290 | 539,816 |
| Mode M0 | |||
|---|---|---|---|
| Quadrant | BADHDUFLAG | Total packets | Discarded packets |
| A | 0 | 13019 | 109 |
| B | 0 | 13536 | 129 |
| C | 0 | 17711 | 282 |
| D | 0 | 14057 | 210 |
| Mode M9 | |||
|---|---|---|---|
| Quadrant | BADHDUFLAG | Total packets | Discarded packets |
| A | 0 | 12 | 0 |
| B | 0 | 12 | 0 |
| C | 0 | 12 | 0 |
| D | 0 | 12 | 0 |
| Mode SS | |||
|---|---|---|---|
| Quadrant | BADHDUFLAG | Total packets | Discarded packets |
| A | 0 | 124 | 0 |
| B | 0 | 124 | 0 |
| C | 0 | 124 | 2 |
| D | 0 | 124 | 0 |
| Quadrant | Total seconds | Saturated seconds | Saturation percentage |
|---|---|---|---|
| A | 6107 | 30 | 0.491240% |
| B | 6100 | 110 | 1.803279% |
| C | 6083 | 271 | 4.455039% |
| D | 6078 | 38 | 0.625206% |
Noise dominated data is calculated using 1-second bins in cleaned event files. If a bin has >2000 counts, and if more than 50% of those come from <1% of pixels, then it is considered to be noise-dominated and hence unusable.
| Quadrant | # 1 sec bins | Bins with >0 counts | Bins with >2000 counts | High rate bins dominated by noise | Noise dominated (total time) | Noise dominated (detector-on time) | Marked lightcurve |
|---|---|---|---|---|---|---|---|
| A | 7338 | 6159 | 8 | 8 | 0.11% | 0.13% | 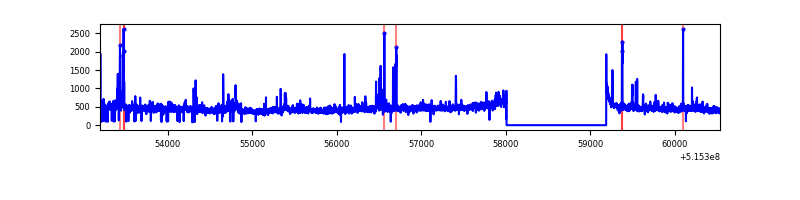 |
| B | 7338 | 6152 | 43 | 43 | 0.59% | 0.70% | 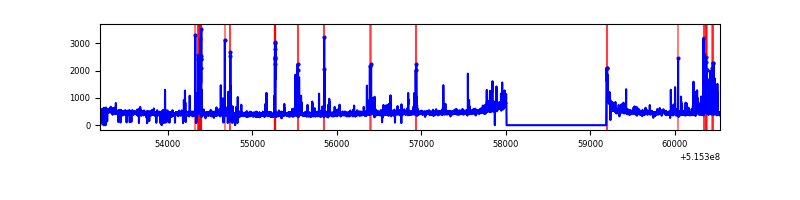 |
| C | 7339 | 6155 | 246 | 246 | 3.35% | 4.00% | 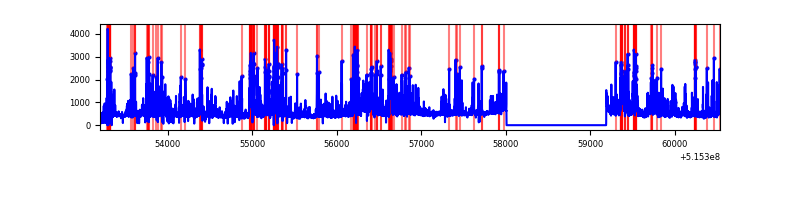 |
| D | 7338 | 6153 | 27 | 27 | 0.37% | 0.44% | 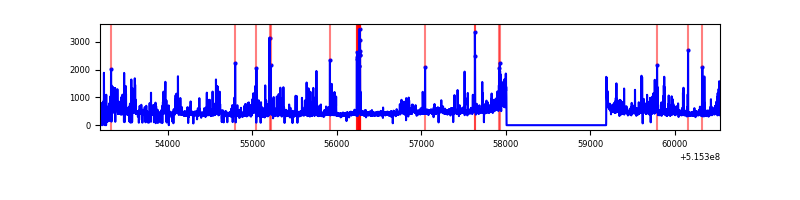 |
Top three noisy pixels from each quadrant. If the there are fewer than three noisy pixels in the level2.evt file, extra rows are filled as -1
| Pixel properties | Quadrant properties | ||||||
|---|---|---|---|---|---|---|---|
| Quadrant | DetID | PixID | Counts | Sigma | Mean | Median | Sigma |
| A | 3 | 14 | 117602 | 710.93 | 668 | 651 | 164.5 |
| A | 0 | 12 | 79657 | 480.27 | 668 | 651 | 164.5 |
| A | 8 | 4 | 68777 | 414.13 | 668 | 651 | 164.5 |
| B | 7 | 252 | 204753 | 1423.8 | 659 | 633 | 143.4 |
| B | 8 | 234 | 63679 | 439.76 | 659 | 633 | 143.4 |
| B | 5 | 185 | 40567 | 278.55 | 659 | 633 | 143.4 |
| C | 15 | 224 | 1707678 | 9999.86 | 625 | 621 | 170.7 |
| C | 14 | 254 | 122206 | 712.24 | 625 | 621 | 170.7 |
| C | 9 | 237 | 54718 | 316.9 | 625 | 621 | 170.7 |
| D | 3 | 224 | 387835 | 2181.95 | 630 | 602 | 177.5 |
| D | 8 | 240 | 107651 | 603.19 | 630 | 602 | 177.5 |
| D | 2 | 249 | 105515 | 591.16 | 630 | 602 | 177.5 |
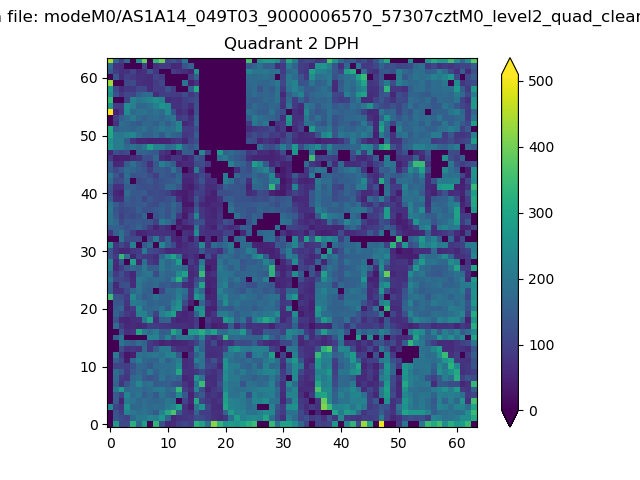
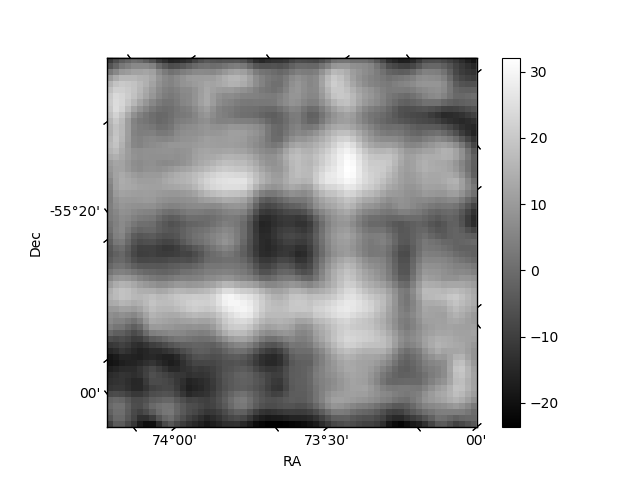
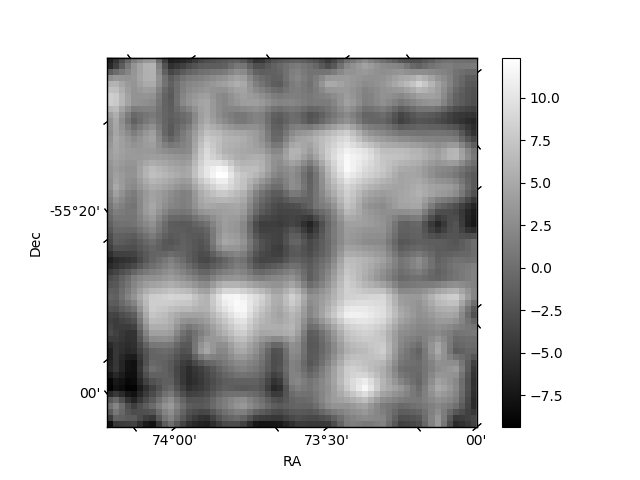
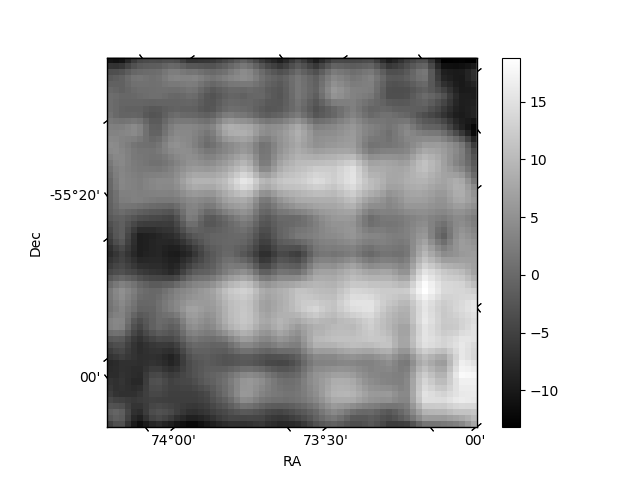
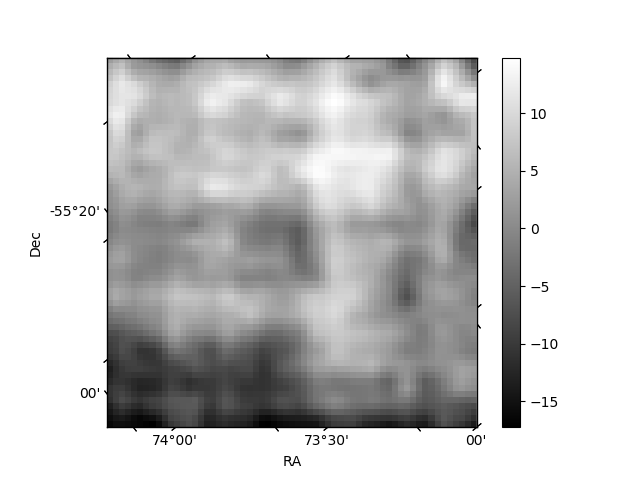
Histogram calculated using DETX and DETY for each event in the final _common_clean file
| Quadrant A | 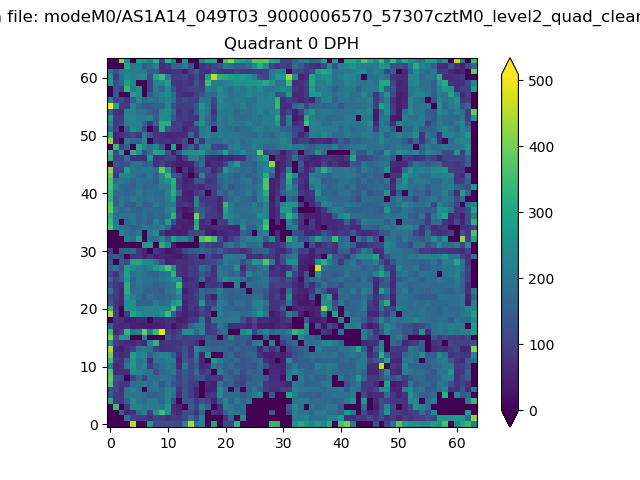 |
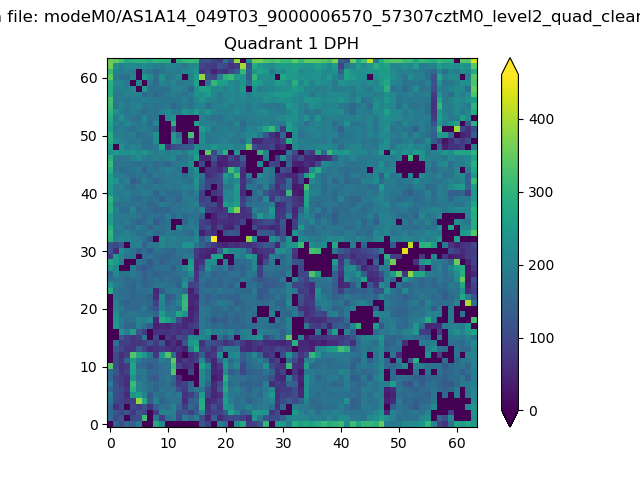 |
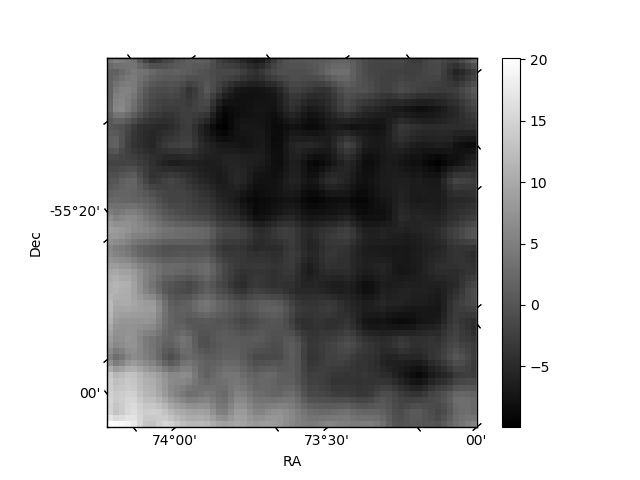
Quadrant B |
|---|---|---|---|
| Quadrant D | 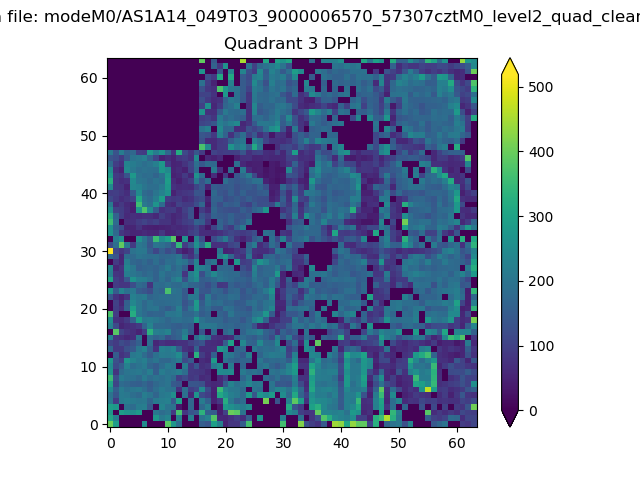 |
 |
Quadrant C |
| Plot type | Count rate plots | Images |
|---|---|---|
| Comparison with Poisson distribution Blue bars denote a histogram of data divided into 1 sec bins. Red curve is a Poisson curve with rate = median count rate of data. |
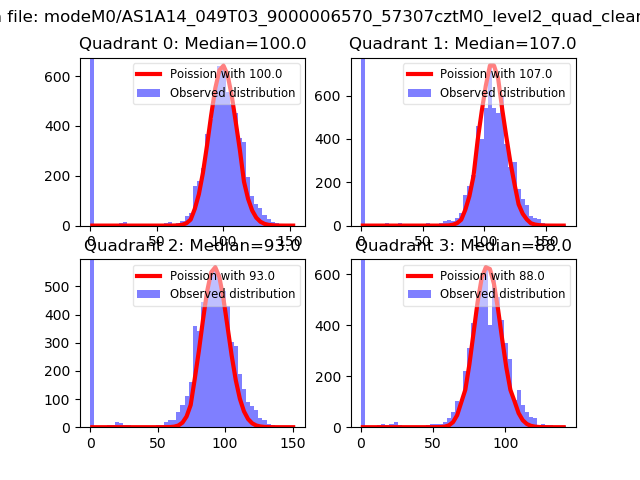 |
 |
| Quadrant-wise count rates Data is divided into 100 sec bins |
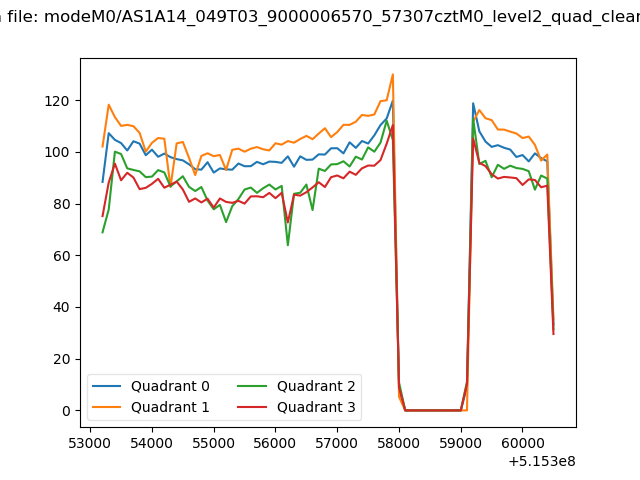 |
|
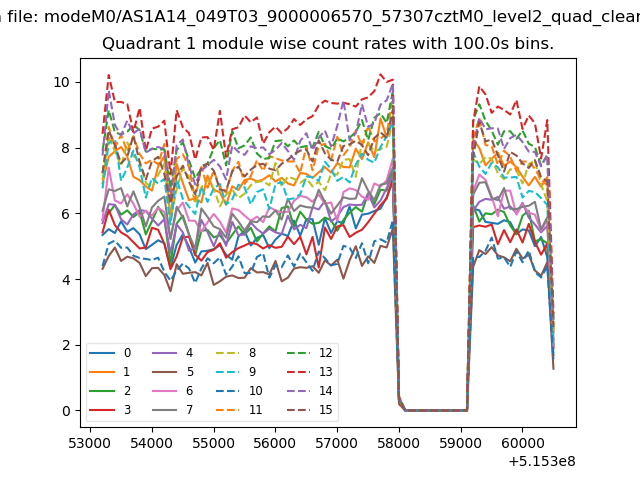
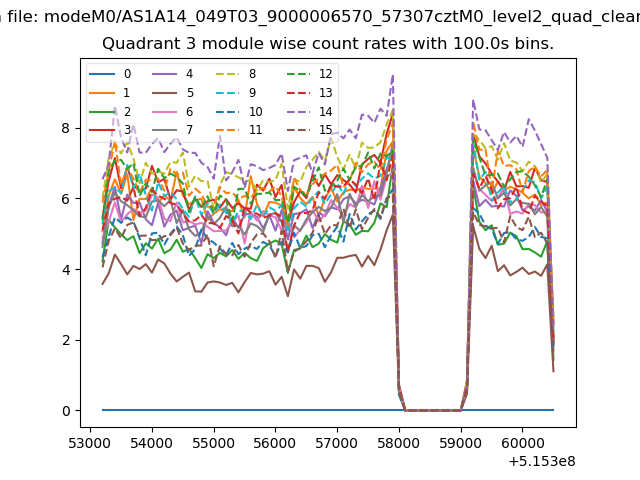
| Module-wise count rates for Quadrant A Data is divided into 100 sec bins |
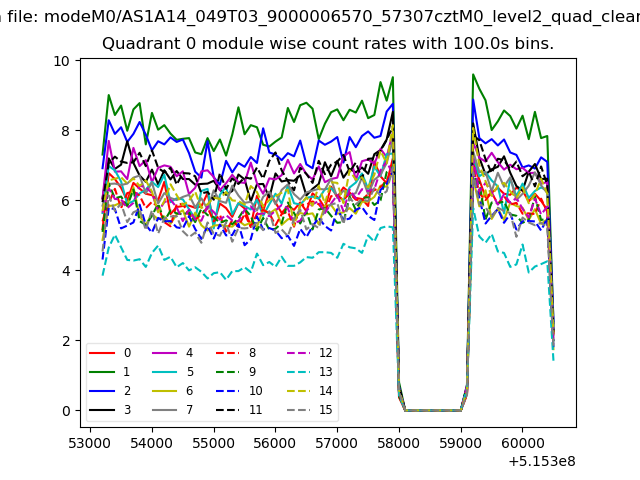 |
 |
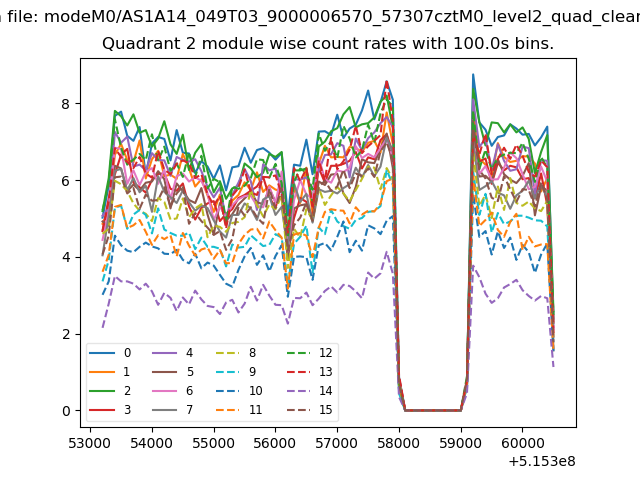
| Module-wise count rates for Quadrant B Data is divided into 100 sec bins |
 |
 |
| Module-wise count rates for Quadrant C Data is divided into 100 sec bins |
 |
 |
| Module-wise count rates for Quadrant D Data is divided into 100 sec bins |
 |
 |
| Parameter | Plot |
|---|---|
| CZT HV Monitor | 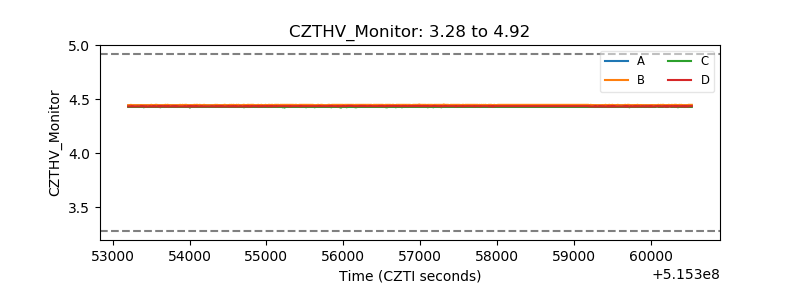 |
| D_VDD | 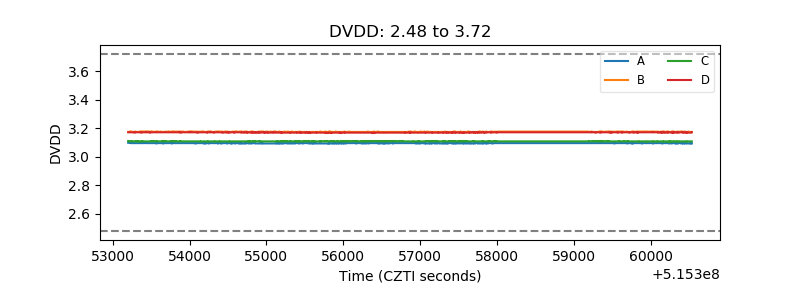 |
| Temperature 1 | 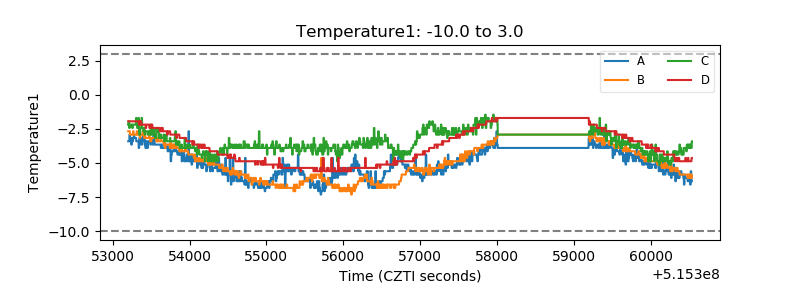 |
| Veto HV Monitor | 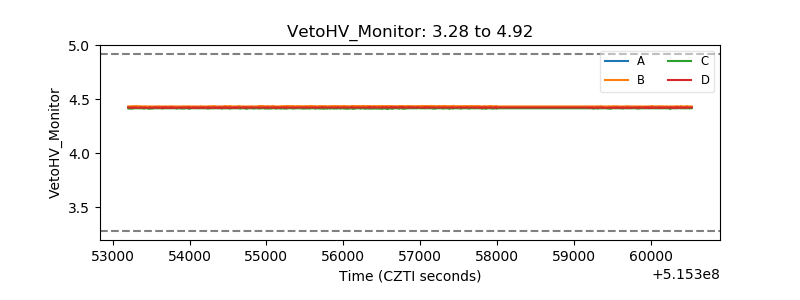 |
| Veto LLD | 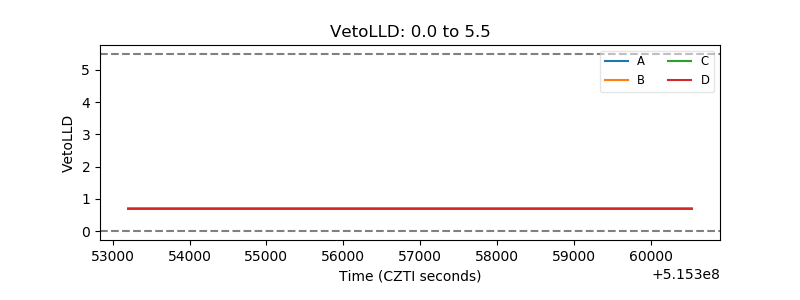 |
| Alpha Counter | 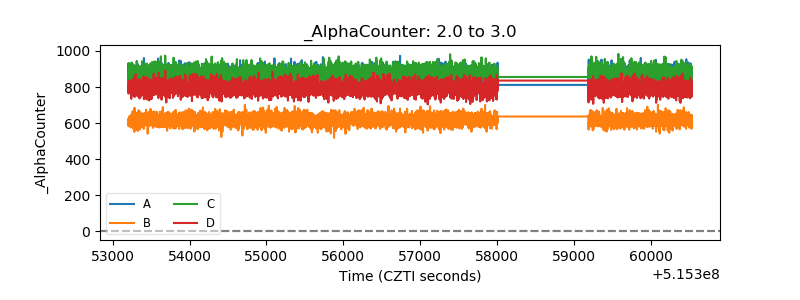 |
| _CPM_Rate | 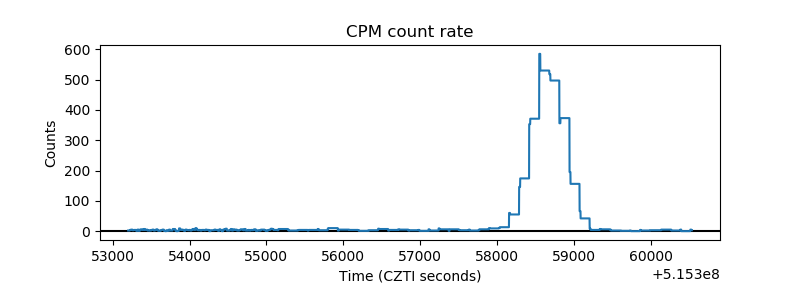 |
| CZT Counter | 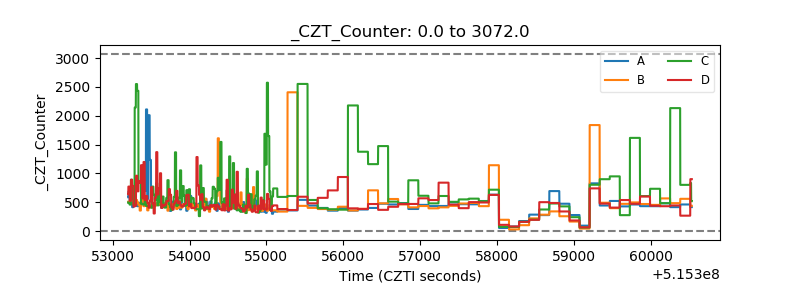 |
| +2.5 Volts monitor |  |
| +5 Volts monitor |  |
| _ROLL_ROT | 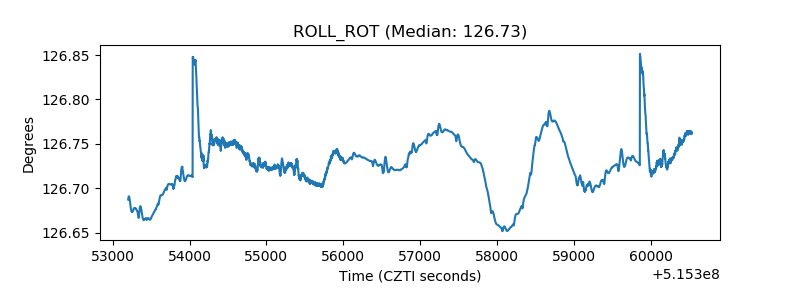 |
| _Roll_DEC | 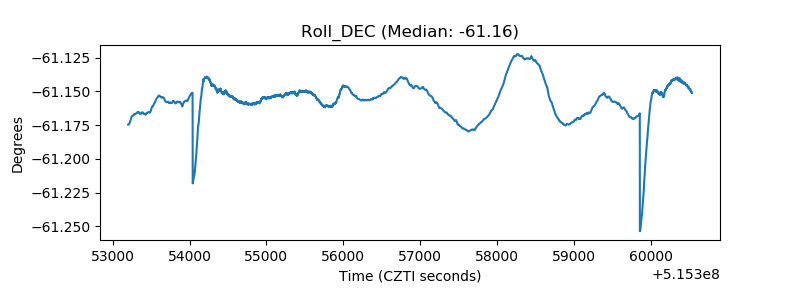 |
| _Roll_RA |  |
| Veto Counter | 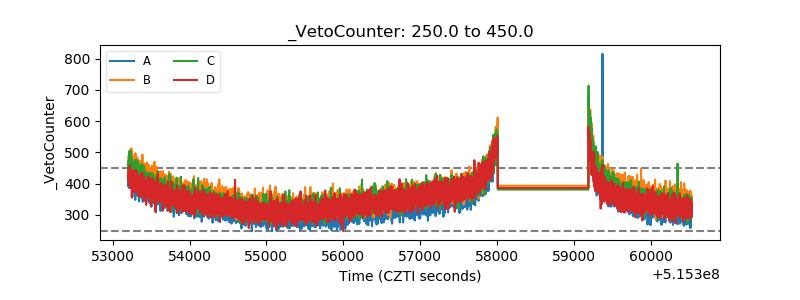 |