| Param | Original file | Final file |
|---|---|---|
| Filename | modeM0/AS1A14_049T03_9000006570_57308cztM0_level2.fits | modeM0/AS1A14_049T03_9000006570_57308cztM0_level2_quad_clean.evt |
| Size (bytes) | 147,300,480 | 32,048,640 |
| Size | 140.5 MB | 30.6 MB |
| Events in quadrant A | 1,139,611 | 213,849 |
| Events in quadrant B | 1,227,520 | 223,099 |
| Events in quadrant C | 1,549,720 | 190,058 |
| Events in quadrant D | 1,359,212 | 182,456 |
| Mode M0 | |||
|---|---|---|---|
| Quadrant | BADHDUFLAG | Total packets | Discarded packets |
| A | 0 | 7382 | 2455 |
| B | 0 | 7767 | 2631 |
| C | 0 | 9888 | 3767 |
| D | 0 | 9390 | 3847 |
| Mode M9 | |||
|---|---|---|---|
| Quadrant | BADHDUFLAG | Total packets | Discarded packets |
| A | 0 | 10 | 0 |
| B | 0 | 10 | 0 |
| C | 0 | 10 | 1 |
| D | 0 | 10 | 0 |
| Mode SS | |||
|---|---|---|---|
| Quadrant | BADHDUFLAG | Total packets | Discarded packets |
| A | 0 | 69 | 25 |
| B | 0 | 72 | 26 |
| C | 0 | 72 | 32 |
| D | 0 | 70 | 23 |
| Quadrant | Total seconds | Saturated seconds | Saturation percentage |
|---|---|---|---|
| A | 2297 | 31 | 1.349586% |
| B | 2263 | 68 | 3.004861% |
| C | 2189 | 113 | 5.162175% |
| D | 2186 | 44 | 2.012809% |
Noise dominated data is calculated using 1-second bins in cleaned event files. If a bin has >2000 counts, and if more than 50% of those come from <1% of pixels, then it is considered to be noise-dominated and hence unusable.
| Quadrant | # 1 sec bins | Bins with >0 counts | Bins with >2000 counts | High rate bins dominated by noise | Noise dominated (total time) | Noise dominated (detector-on time) | Marked lightcurve |
|---|---|---|---|---|---|---|---|
| A | 4042 | 2549 | 0 | 0 | 0.00% | 0.00% | 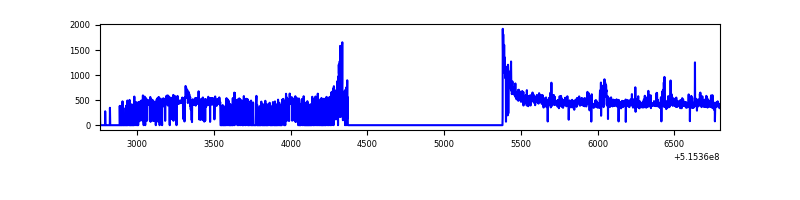 |
| B | 3957 | 2508 | 7 | 7 | 0.18% | 0.28% | 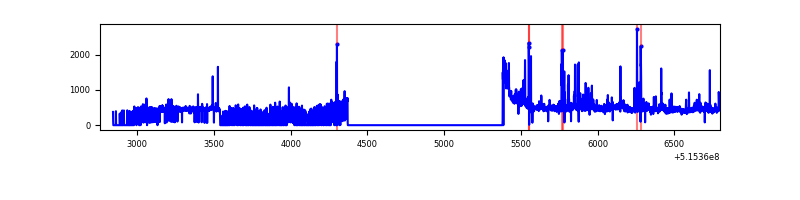 |
| C | 4002 | 2417 | 71 | 71 | 1.77% | 2.94% | 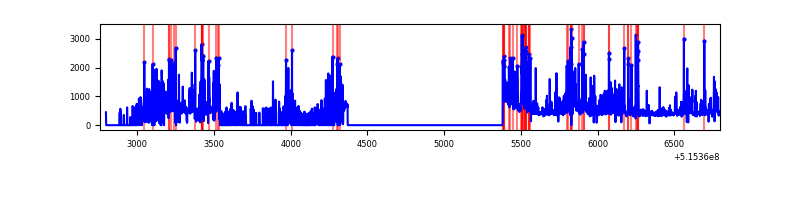 |
| D | 3945 | 2400 | 28 | 28 | 0.71% | 1.17% | 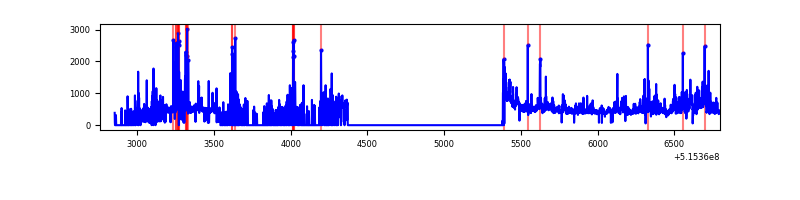 |
Top three noisy pixels from each quadrant. If the there are fewer than three noisy pixels in the level2.evt file, extra rows are filled as -1
| Pixel properties | Quadrant properties | ||||||
|---|---|---|---|---|---|---|---|
| Quadrant | DetID | PixID | Counts | Sigma | Mean | Median | Sigma |
| A | 0 | 12 | 33614 | 512.04 | 260 | 254 | 65.2 |
| A | 3 | 14 | 30573 | 465.36 | 260 | 254 | 65.2 |
| A | 8 | 4 | 26861 | 408.39 | 260 | 254 | 65.2 |
| B | 5 | 185 | 81855 | 1460.08 | 251 | 242 | 55.9 |
| B | 7 | 252 | 52513 | 935.14 | 251 | 242 | 55.9 |
| B | 10 | 16 | 41081 | 730.62 | 251 | 242 | 55.9 |
| C | 15 | 224 | 536502 | 8281.72 | 233 | 230 | 64.8 |
| C | 14 | 254 | 42107 | 646.71 | 233 | 230 | 64.8 |
| C | 6 | 223 | 36168 | 555.0 | 233 | 230 | 64.8 |
| D | 3 | 224 | 203233 | 2984.46 | 234 | 222 | 68.0 |
| D | 8 | 240 | 145703 | 2138.71 | 234 | 222 | 68.0 |
| D | 2 | 249 | 29016 | 423.3 | 234 | 222 | 68.0 |
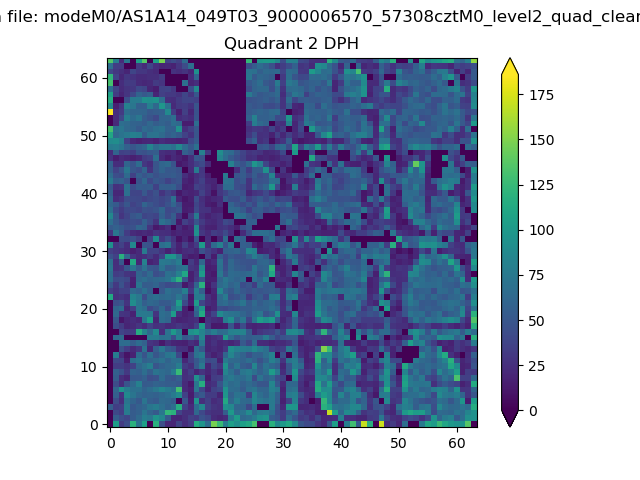
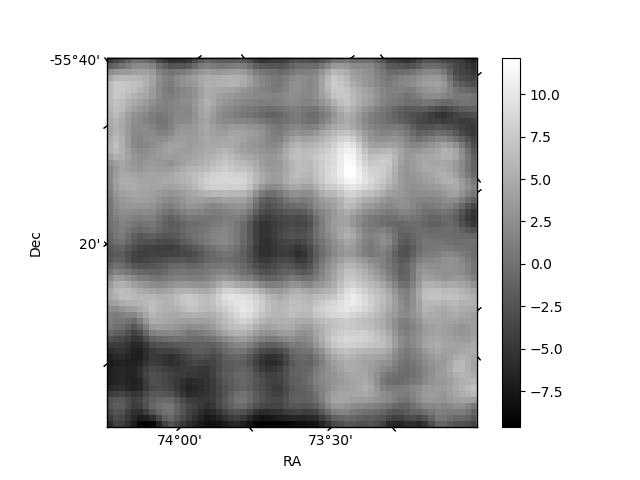
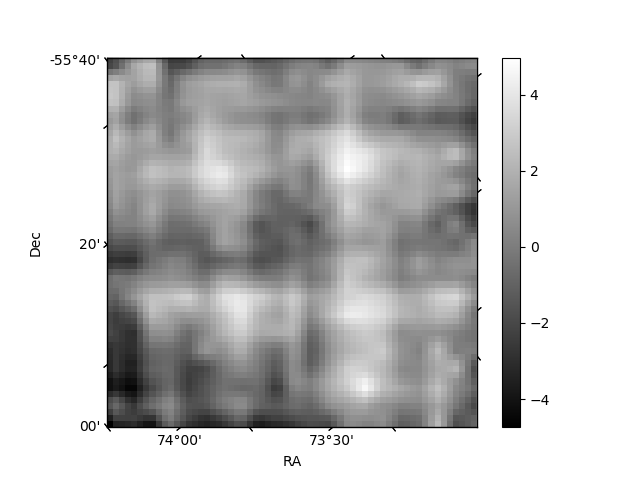
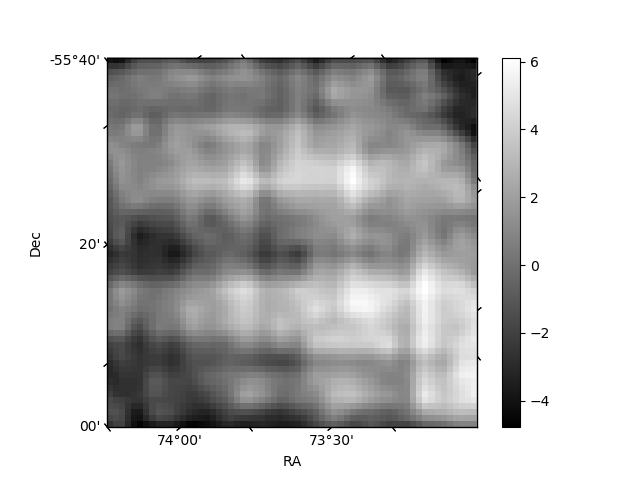
Histogram calculated using DETX and DETY for each event in the final _common_clean file
| Quadrant A | 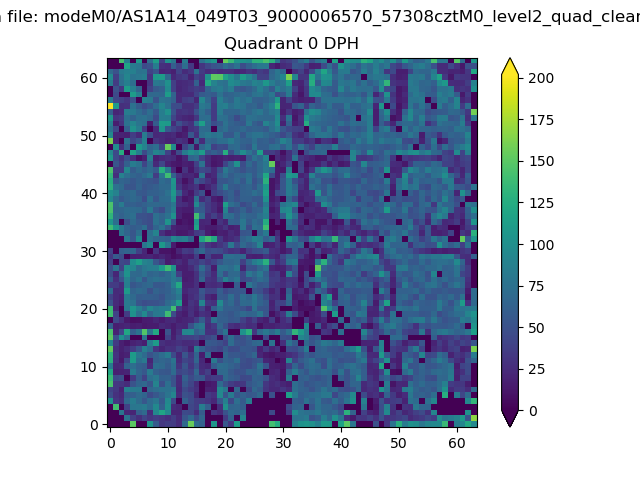 |
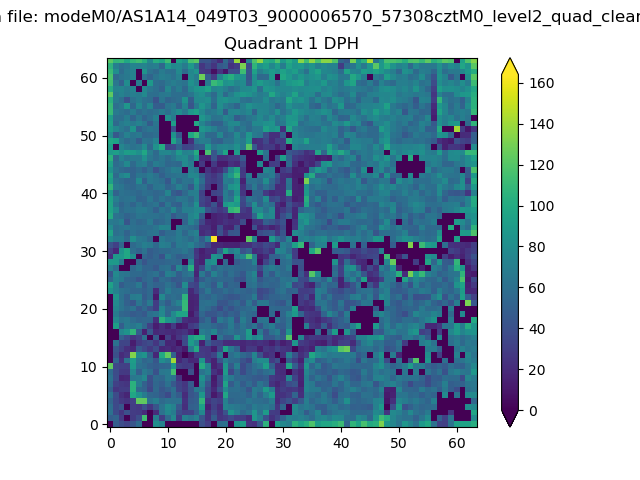 |
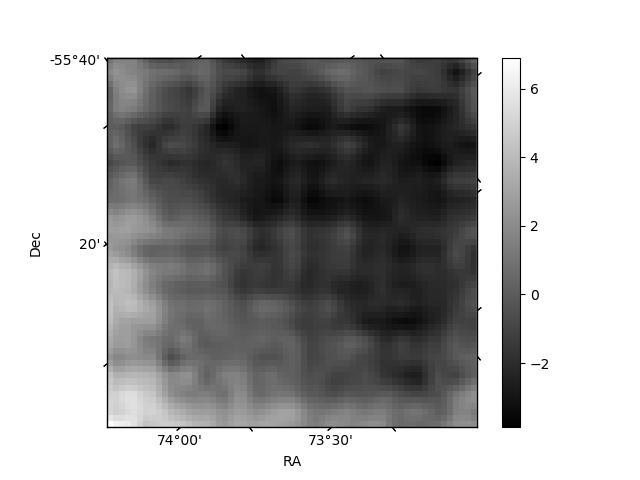
Quadrant B |
|---|---|---|---|
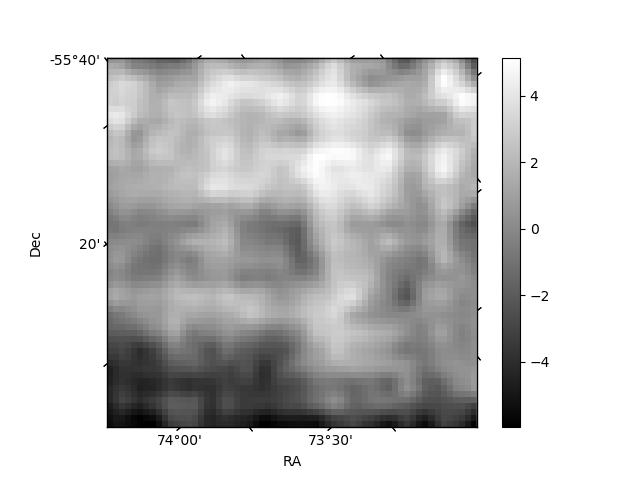
| Quadrant D | 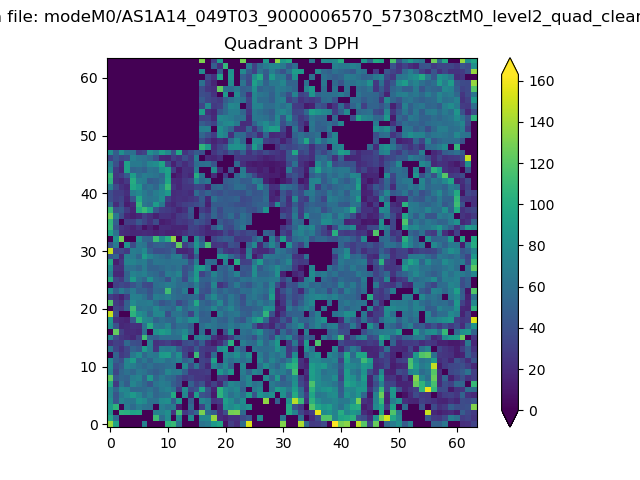 |
 |
Quadrant C |
| Plot type | Count rate plots | Images |
|---|---|---|
| Comparison with Poisson distribution Blue bars denote a histogram of data divided into 1 sec bins. Red curve is a Poisson curve with rate = median count rate of data. |
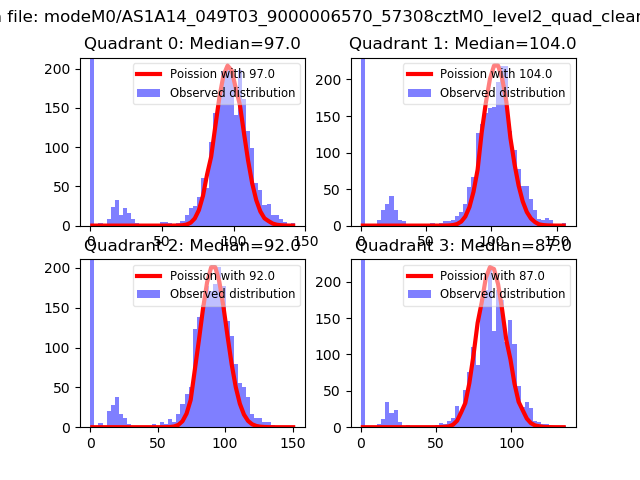 |
 |
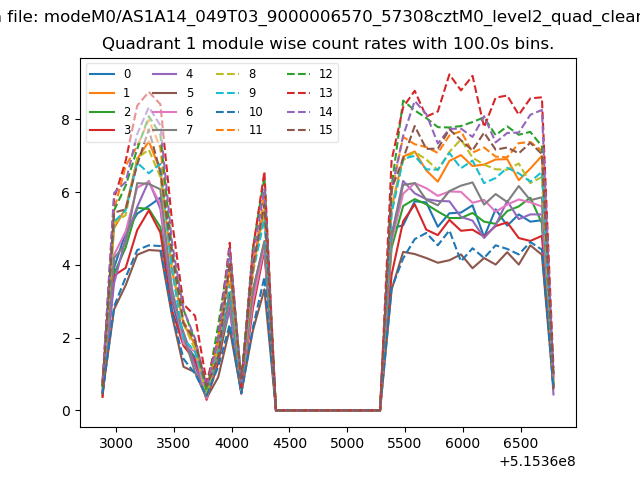
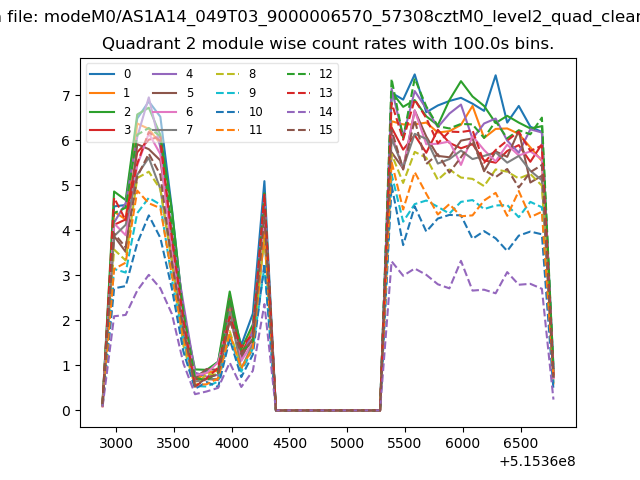
| Quadrant-wise count rates Data is divided into 100 sec bins |
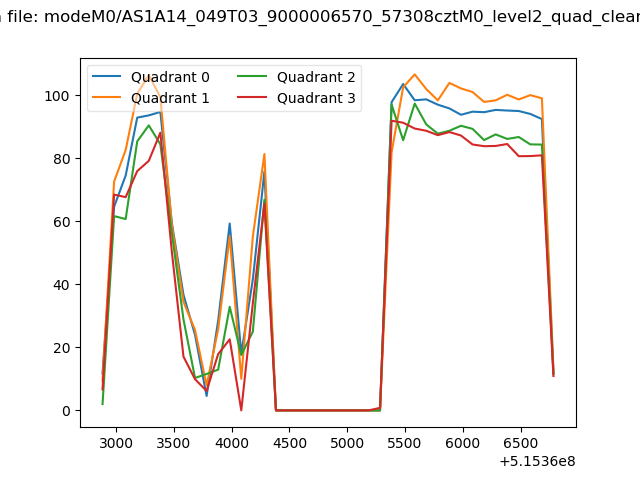 |
|
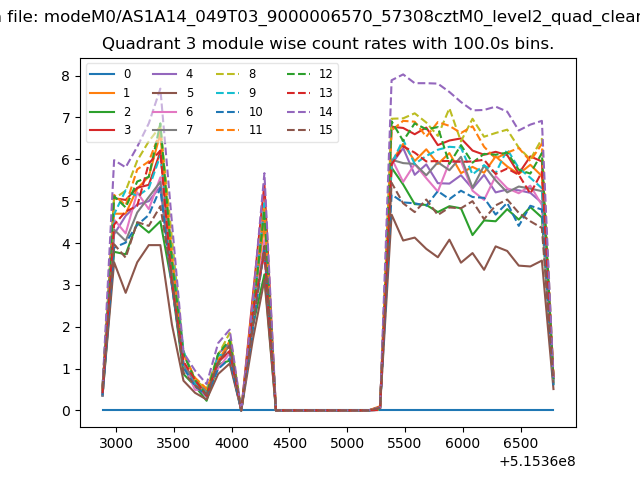
| Module-wise count rates for Quadrant A Data is divided into 100 sec bins |
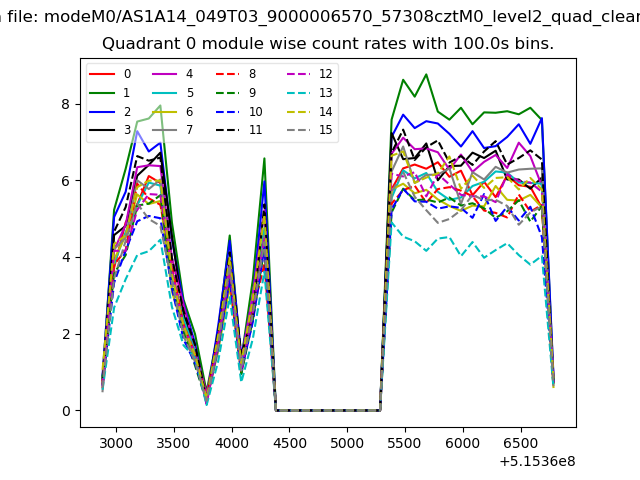 |
 |
| Module-wise count rates for Quadrant B Data is divided into 100 sec bins |
 |
 |
| Module-wise count rates for Quadrant C Data is divided into 100 sec bins |
 |
 |
| Module-wise count rates for Quadrant D Data is divided into 100 sec bins |
 |
 |
| Parameter | Plot |
|---|---|
| CZT HV Monitor |  |
| D_VDD | 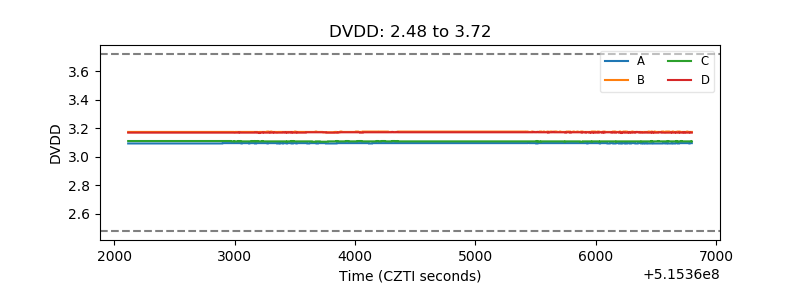 |
| Temperature 1 | 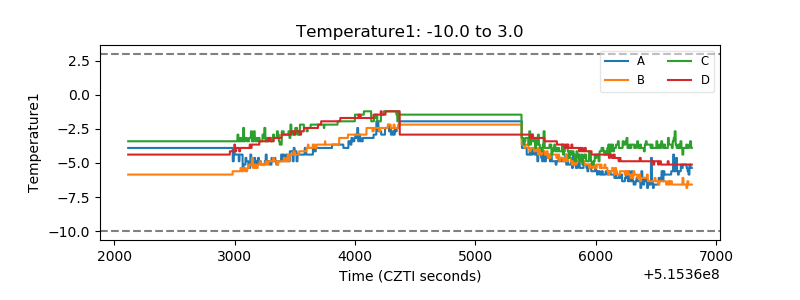 |
| Veto HV Monitor | 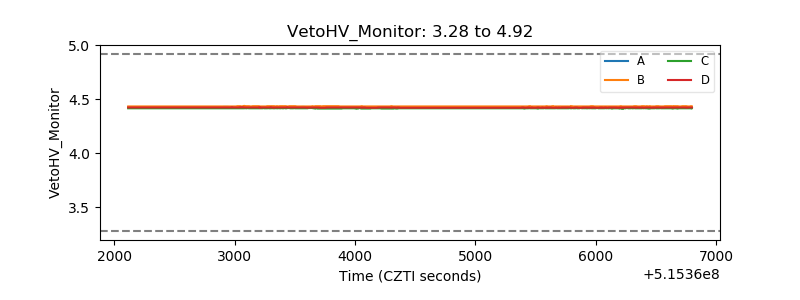 |
| Veto LLD | 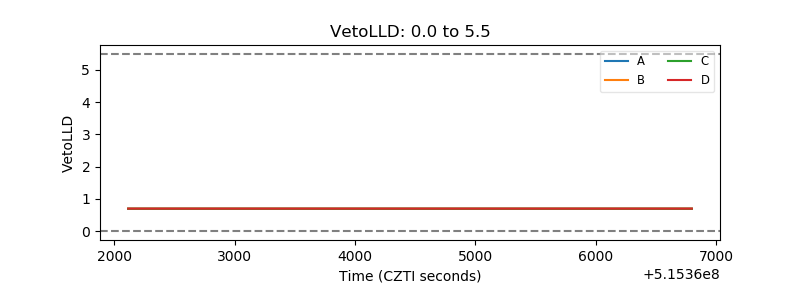 |
| Alpha Counter | 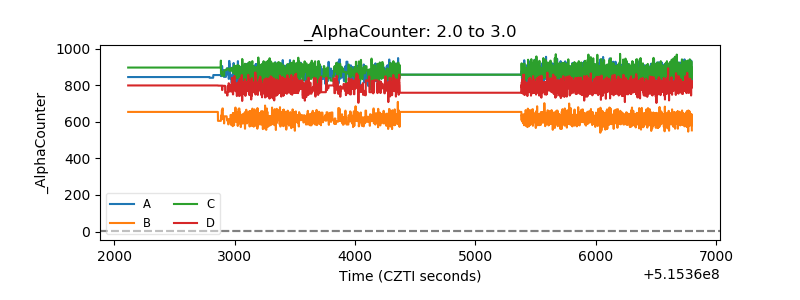 |
| _CPM_Rate | 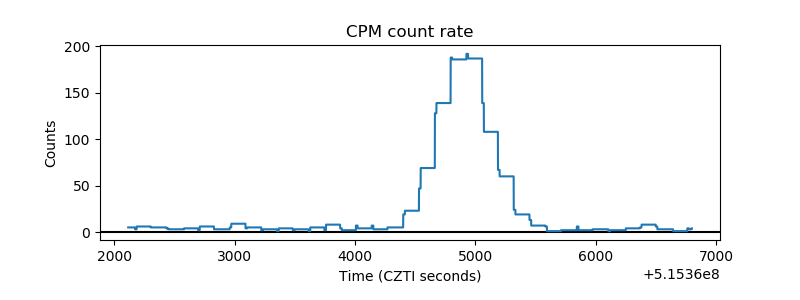 |
| CZT Counter | 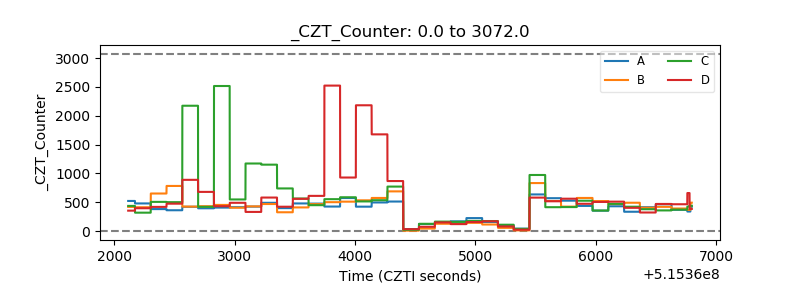 |
| +2.5 Volts monitor |  |
| +5 Volts monitor |  |
| _ROLL_ROT | 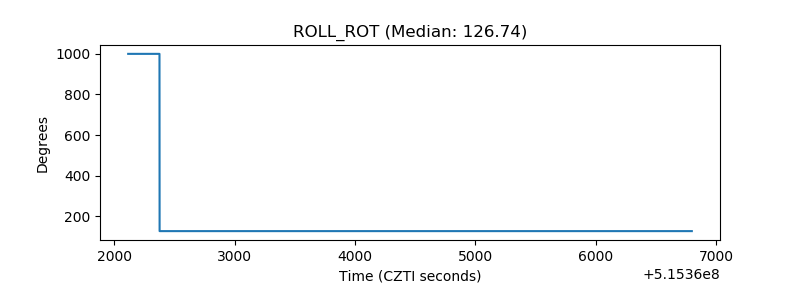 |
| _Roll_DEC | 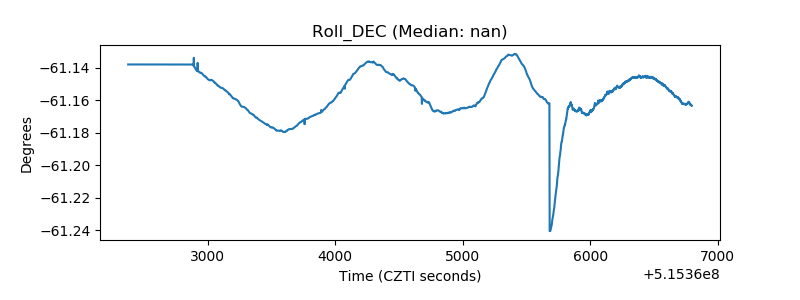 |
| _Roll_RA | 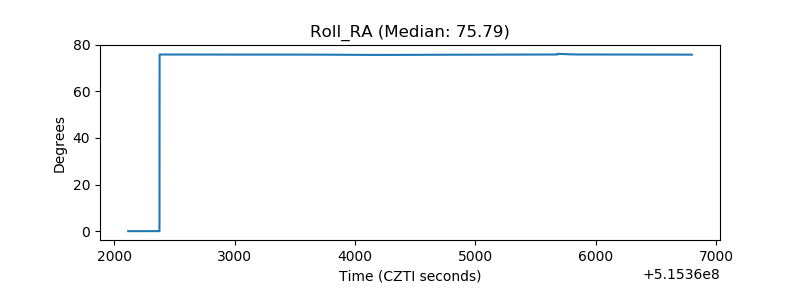 |
| Veto Counter | 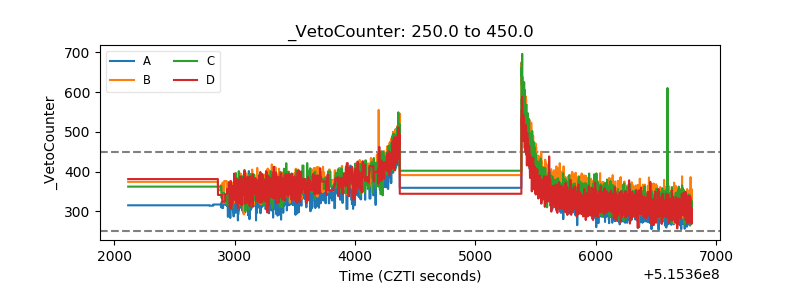 |