| Param | Original file | Final file |
|---|---|---|
| Filename | modeM0/AS1A14_049T03_9000006570_57309cztM0_level2.fits | modeM0/AS1A14_049T03_9000006570_57309cztM0_level2_quad_clean.evt |
| Size (bytes) | 447,952,320 | 101,957,760 |
| Size | 427.2 MB | 97.2 MB |
| Events in quadrant A | 3,762,621 | 670,718 |
| Events in quadrant B | 3,799,293 | 709,127 |
| Events in quadrant C | 4,328,573 | 624,845 |
| Events in quadrant D | 4,142,694 | 591,195 |
| Mode M0 | |||
|---|---|---|---|
| Quadrant | BADHDUFLAG | Total packets | Discarded packets |
| A | 0 | 16144 | 2 |
| B | 0 | 16154 | 2 |
| C | 0 | 17978 | 2 |
| D | 0 | 17353 | 2 |
| Mode M9 | |||
|---|---|---|---|
| Quadrant | BADHDUFLAG | Total packets | Discarded packets |
| A | 0 | 12 | 0 |
| B | 0 | 12 | 0 |
| C | 0 | 13 | 0 |
| D | 0 | 13 | 0 |
| Mode SS | |||
|---|---|---|---|
| Quadrant | BADHDUFLAG | Total packets | Discarded packets |
| A | 0 | 142 | 0 |
| B | 0 | 142 | 0 |
| C | 0 | 142 | 0 |
| D | 0 | 142 | 0 |
| Quadrant | Total seconds | Saturated seconds | Saturation percentage |
|---|---|---|---|
| A | 7056 | 106 | 1.502268% |
| B | 7056 | 169 | 2.395125% |
| C | 7056 | 208 | 2.947846% |
| D | 7056 | 154 | 2.182540% |
Noise dominated data is calculated using 1-second bins in cleaned event files. If a bin has >2000 counts, and if more than 50% of those come from <1% of pixels, then it is considered to be noise-dominated and hence unusable.
| Quadrant | # 1 sec bins | Bins with >0 counts | Bins with >2000 counts | High rate bins dominated by noise | Noise dominated (total time) | Noise dominated (detector-on time) | Marked lightcurve |
|---|---|---|---|---|---|---|---|
| A | 7686 | 7057 | 30 | 30 | 0.39% | 0.43% | 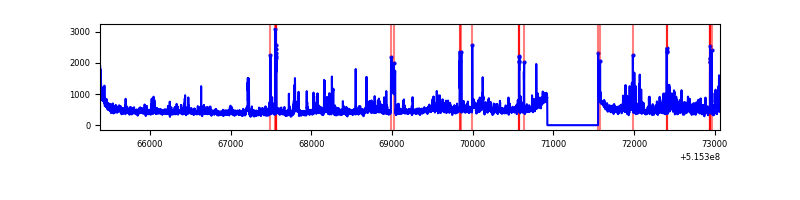 |
| B | 7686 | 7057 | 33 | 33 | 0.43% | 0.47% | 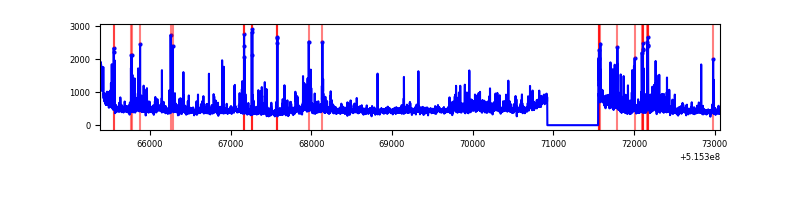 |
| C | 7686 | 7057 | 159 | 159 | 2.07% | 2.25% | 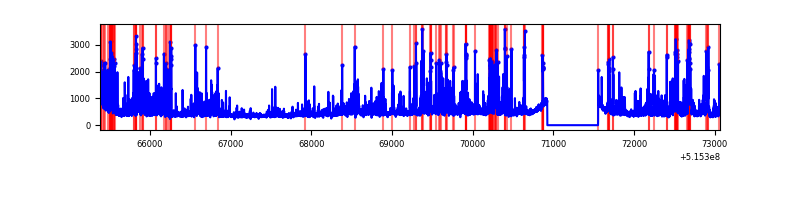 |
| D | 7686 | 7057 | 95 | 95 | 1.24% | 1.35% | 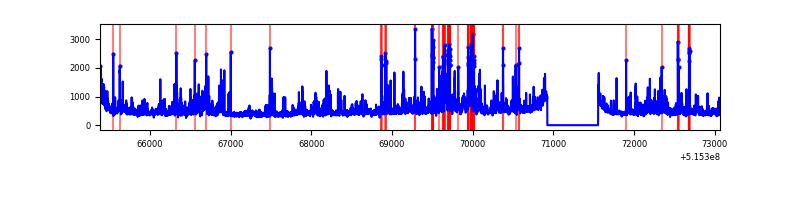 |
Top three noisy pixels from each quadrant. If the there are fewer than three noisy pixels in the level2.evt file, extra rows are filled as -1
| Pixel properties | Quadrant properties | ||||||
|---|---|---|---|---|---|---|---|
| Quadrant | DetID | PixID | Counts | Sigma | Mean | Median | Sigma |
| A | 0 | 12 | 337619 | 1788.48 | 765 | 746 | 188.4 |
| A | 3 | 14 | 242657 | 1284.32 | 765 | 746 | 188.4 |
| A | 8 | 4 | 164538 | 869.58 | 765 | 746 | 188.4 |
| B | 5 | 185 | 353296 | 2155.03 | 752 | 722 | 163.6 |
| B | 7 | 252 | 177687 | 1081.66 | 752 | 722 | 163.6 |
| B | 10 | 16 | 75602 | 457.69 | 752 | 722 | 163.6 |
| C | 15 | 224 | 1259476 | 6347.26 | 730 | 723 | 198.3 |
| C | 14 | 254 | 100914 | 505.21 | 730 | 723 | 198.3 |
| C | 12 | 250 | 32168 | 158.56 | 730 | 723 | 198.3 |
| D | 3 | 224 | 532635 | 2583.01 | 730 | 699 | 205.9 |
| D | 8 | 240 | 378825 | 1836.13 | 730 | 699 | 205.9 |
| D | 2 | 31 | 108297 | 522.48 | 730 | 699 | 205.9 |
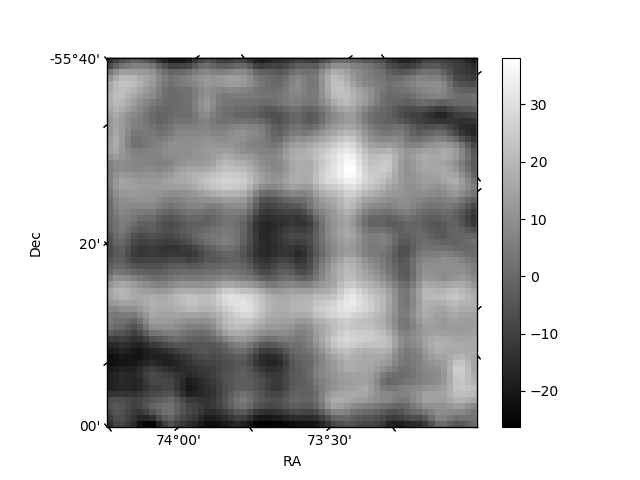
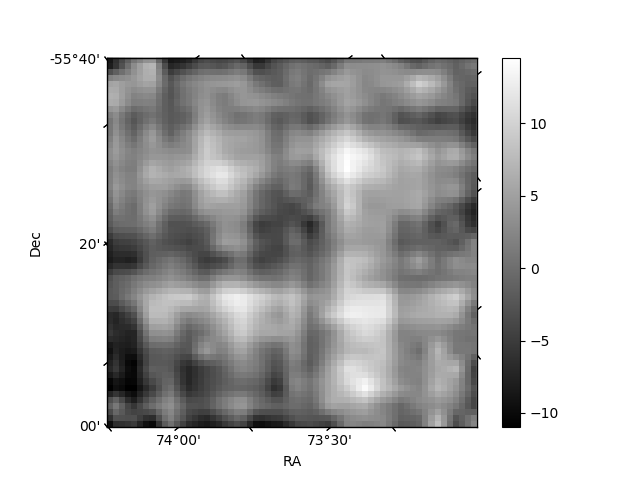
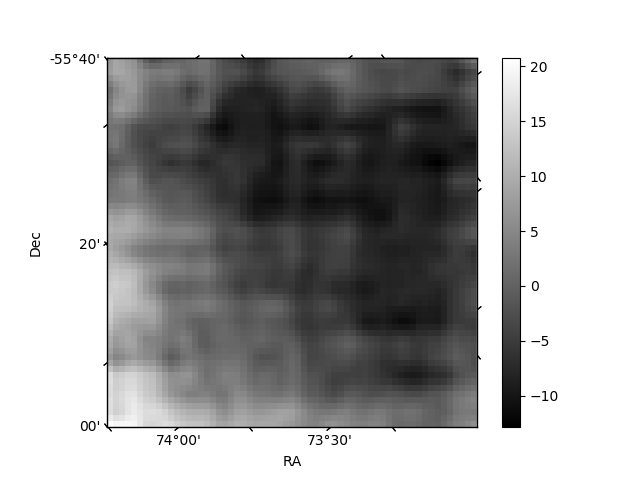
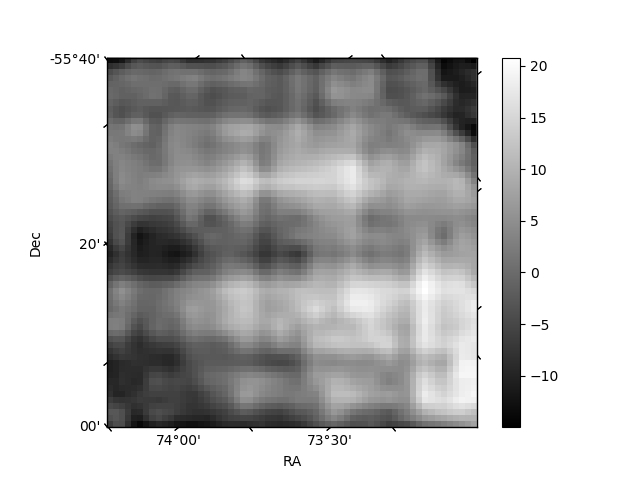
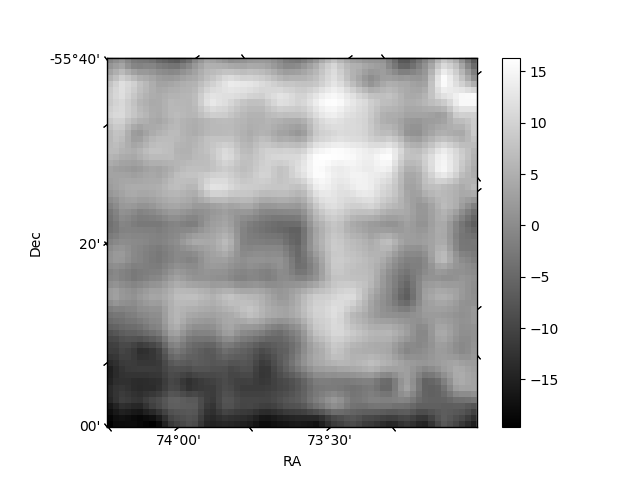
Histogram calculated using DETX and DETY for each event in the final _common_clean file
| Quadrant A | 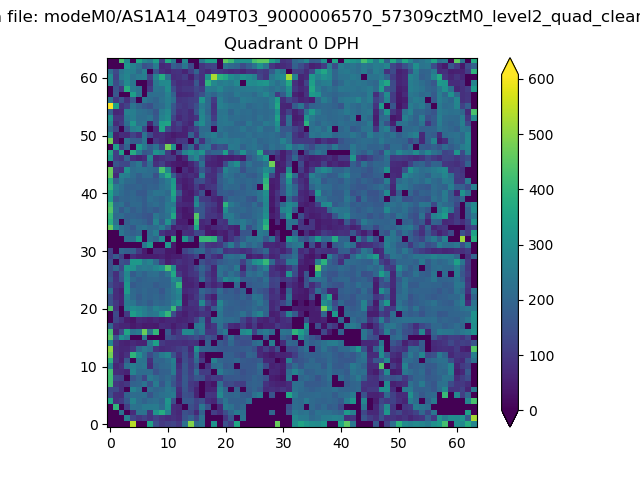 |
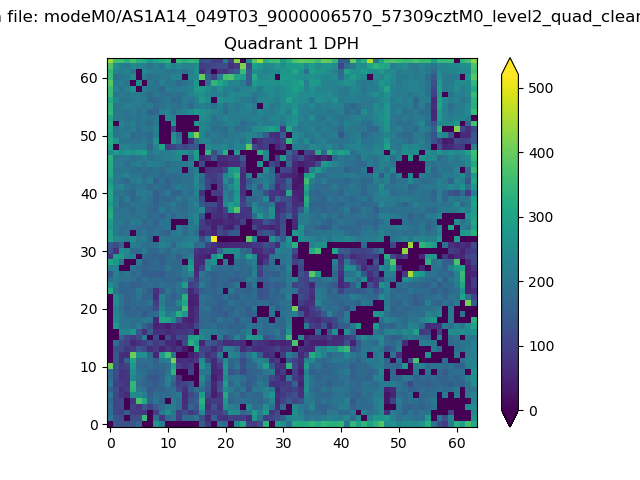 |
Quadrant B |
|---|---|---|---|
| Quadrant D | 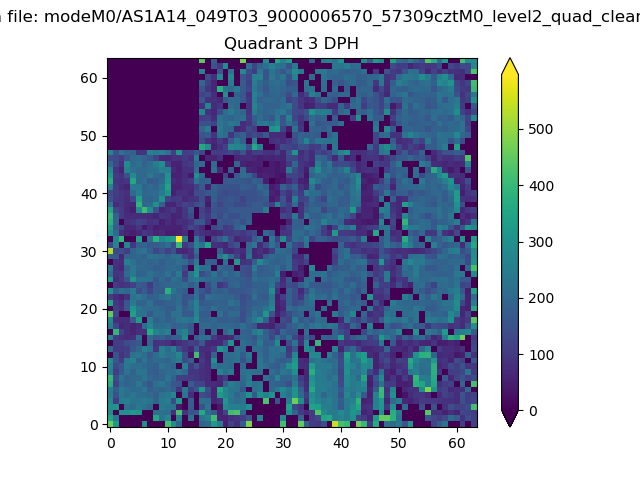 |
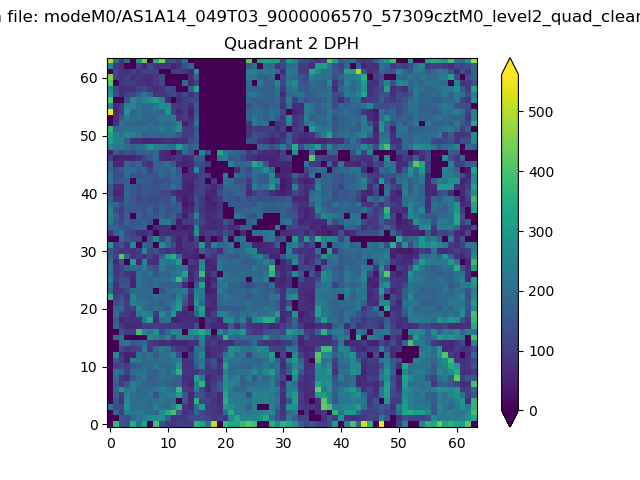 |
Quadrant C |
| Plot type | Count rate plots | Images |
|---|---|---|
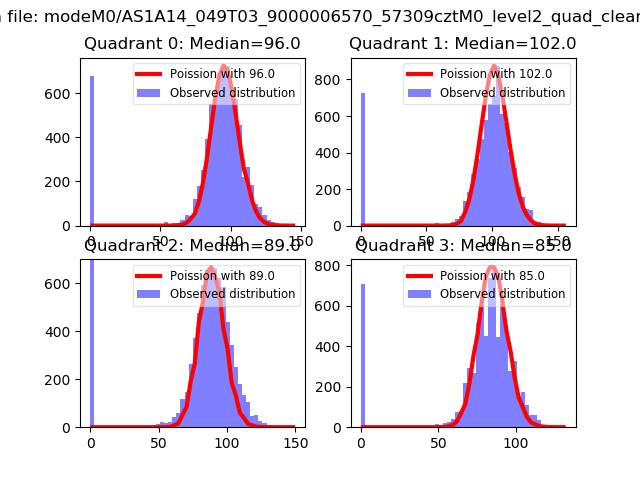
| Comparison with Poisson distribution Blue bars denote a histogram of data divided into 1 sec bins. Red curve is a Poisson curve with rate = median count rate of data. |
 |
 |
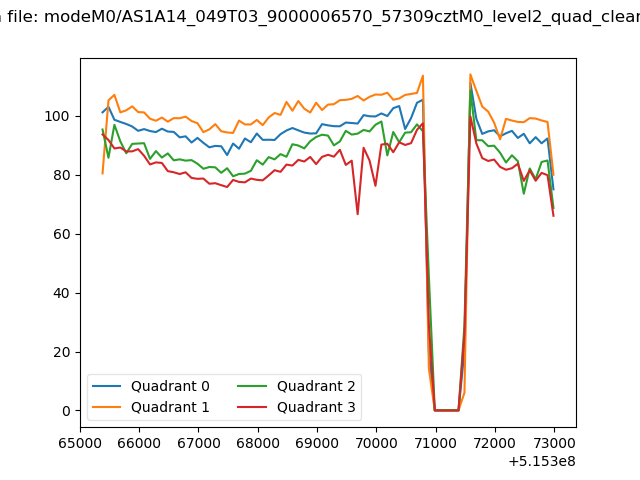
| Quadrant-wise count rates Data is divided into 100 sec bins |
 |
|
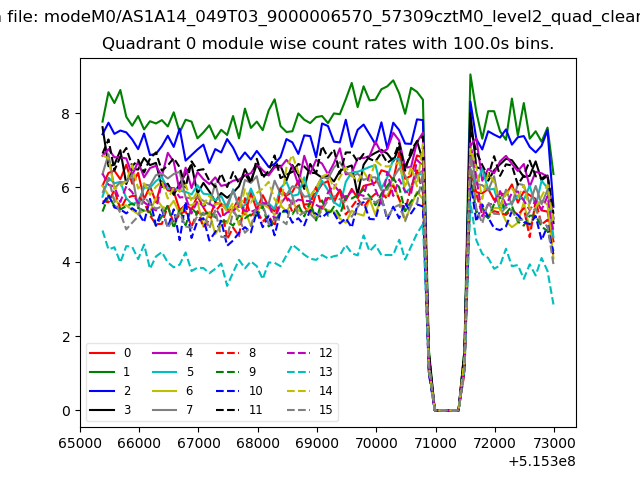
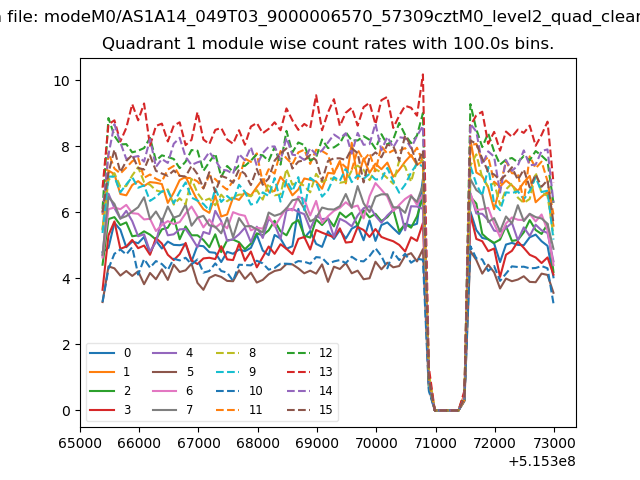
| Module-wise count rates for Quadrant A Data is divided into 100 sec bins |
 |
 |
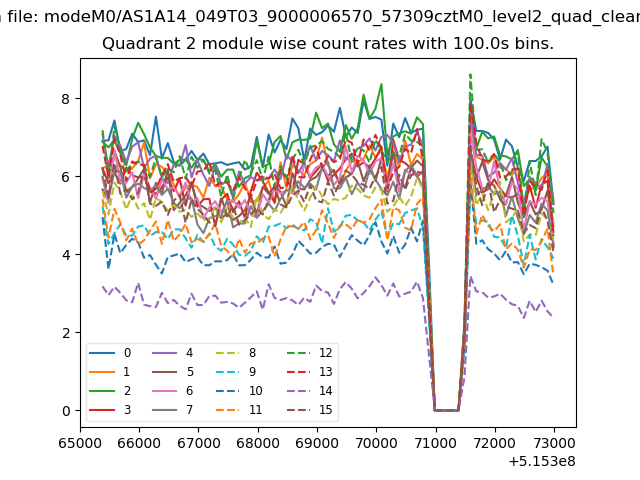
| Module-wise count rates for Quadrant B Data is divided into 100 sec bins |
 |
 |
| Module-wise count rates for Quadrant C Data is divided into 100 sec bins |
 |
 |
| Module-wise count rates for Quadrant D Data is divided into 100 sec bins |
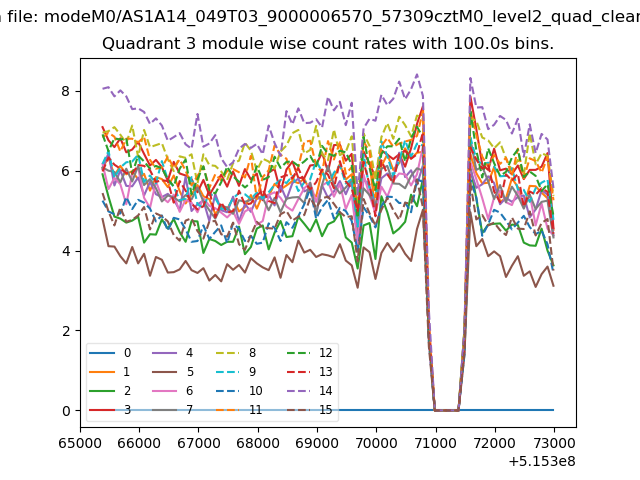 |
 |
| Parameter | Plot |
|---|---|
| CZT HV Monitor | 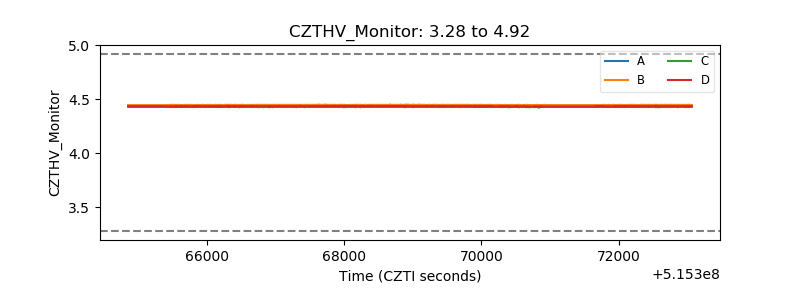 |
| D_VDD | 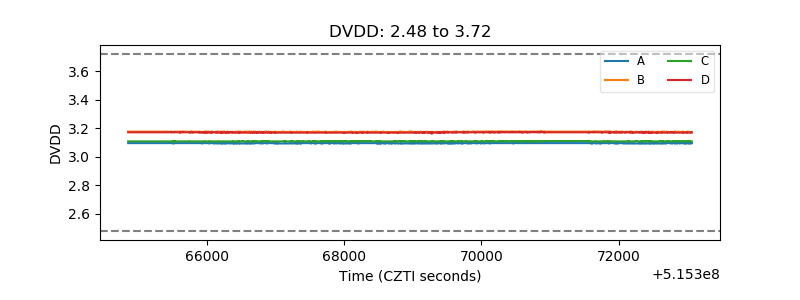 |
| Temperature 1 | 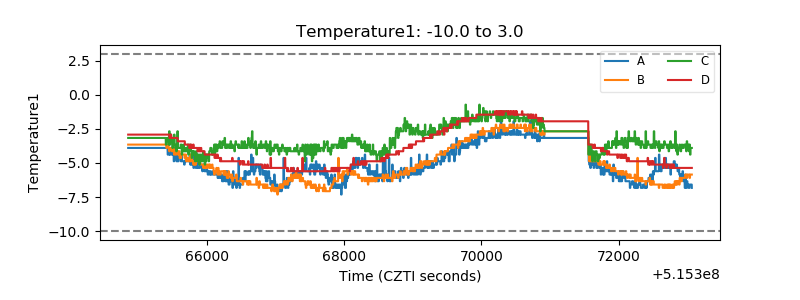 |
| Veto HV Monitor | 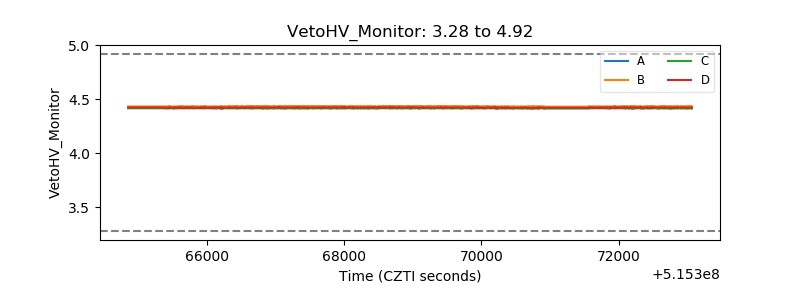 |
| Veto LLD | 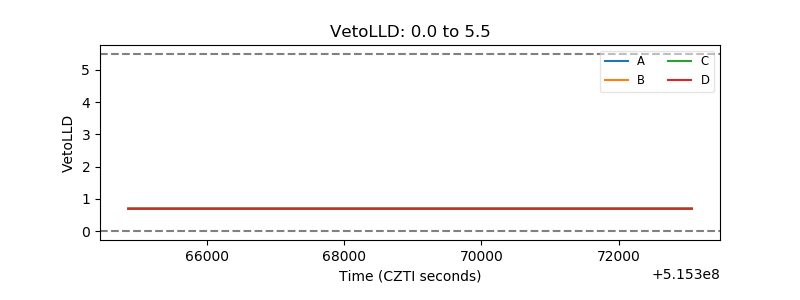 |
| Alpha Counter | 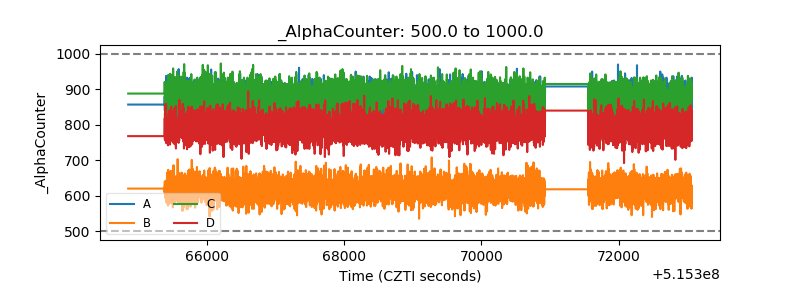 |
| _CPM_Rate | 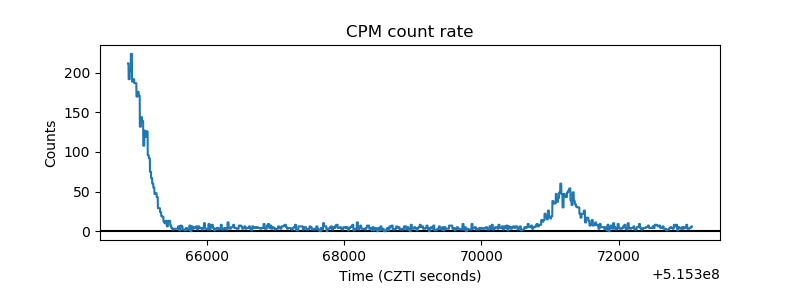 |
| CZT Counter | 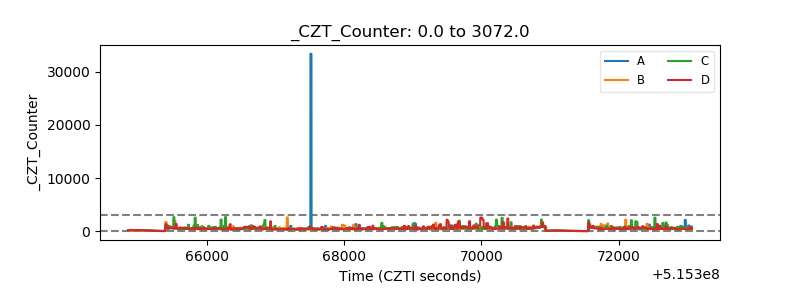 |
| +2.5 Volts monitor |  |
| +5 Volts monitor |  |
| _ROLL_ROT | 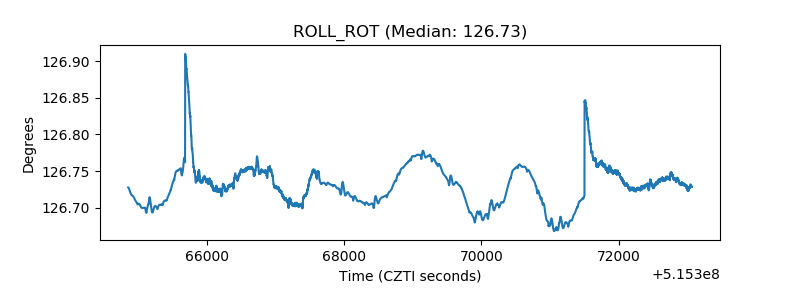 |
| _Roll_DEC | 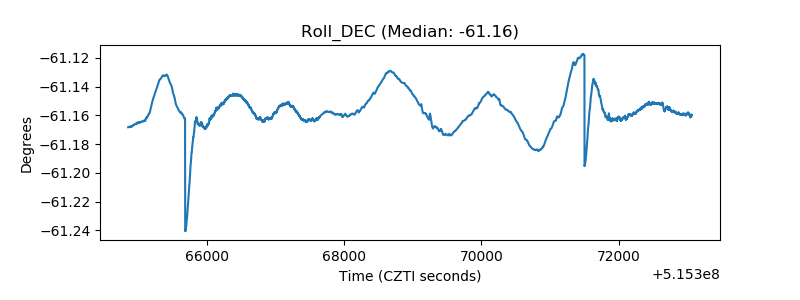 |
| _Roll_RA | 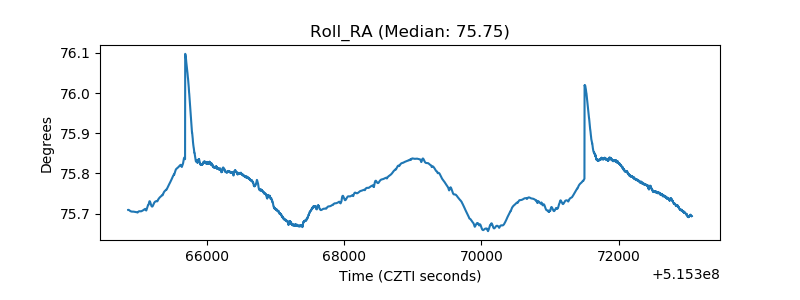 |
| Veto Counter | 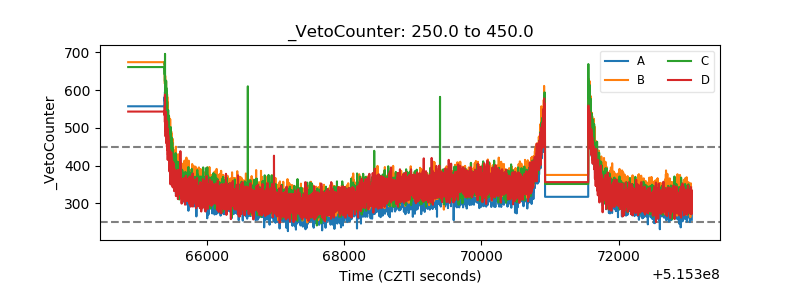 |