| Param | Original file | Final file |
|---|---|---|
| Filename | modeM0/AS1A14_049T03_9000006570_57310cztM0_level2.fits | modeM0/AS1A14_049T03_9000006570_57310cztM0_level2_quad_clean.evt |
| Size (bytes) | 1,488,634,560 | 344,053,440 |
| Size | 1.4 GB | 328.1 MB |
| Events in quadrant A | 11,989,143 | 2,278,209 |
| Events in quadrant B | 12,144,415 | 2,423,681 |
| Events in quadrant C | 15,410,974 | 2,094,249 |
| Events in quadrant D | 13,743,664 | 2,006,013 |
| Mode M0 | |||
|---|---|---|---|
| Quadrant | BADHDUFLAG | Total packets | Discarded packets |
| A | 0 | 51978 | 3 |
| B | 0 | 52634 | 3 |
| C | 0 | 62517 | 3 |
| D | 0 | 57425 | 7 |
| Mode M9 | |||
|---|---|---|---|
| Quadrant | BADHDUFLAG | Total packets | Discarded packets |
| A | 0 | 29 | 0 |
| B | 0 | 29 | 0 |
| C | 0 | 29 | 0 |
| D | 0 | 29 | 0 |
| Mode SS | |||
|---|---|---|---|
| Quadrant | BADHDUFLAG | Total packets | Discarded packets |
| A | 0 | 474 | 0 |
| B | 0 | 474 | 0 |
| C | 0 | 474 | 0 |
| D | 0 | 474 | 0 |
| Quadrant | Total seconds | Saturated seconds | Saturation percentage |
|---|---|---|---|
| A | 23476 | 246 | 1.047879% |
| B | 23477 | 482 | 2.053073% |
| C | 23477 | 883 | 3.761128% |
| D | 23475 | 474 | 2.019169% |
Noise dominated data is calculated using 1-second bins in cleaned event files. If a bin has >2000 counts, and if more than 50% of those come from <1% of pixels, then it is considered to be noise-dominated and hence unusable.
| Quadrant | # 1 sec bins | Bins with >0 counts | Bins with >2000 counts | High rate bins dominated by noise | Noise dominated (total time) | Noise dominated (detector-on time) | Marked lightcurve |
|---|---|---|---|---|---|---|---|
| A | 26296 | 23479 | 105 | 105 | 0.40% | 0.45% | 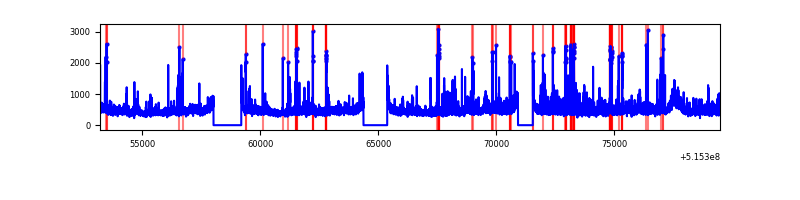 |
| B | 26297 | 23480 | 141 | 141 | 0.54% | 0.60% | 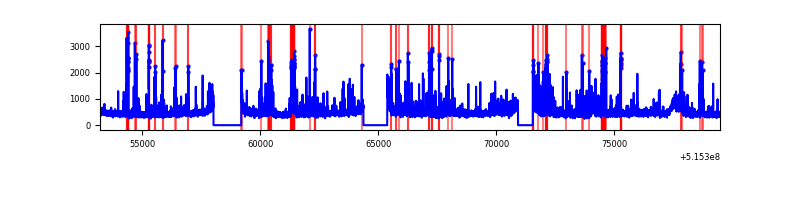 |
| C | 26297 | 23480 | 699 | 699 | 2.66% | 2.98% | 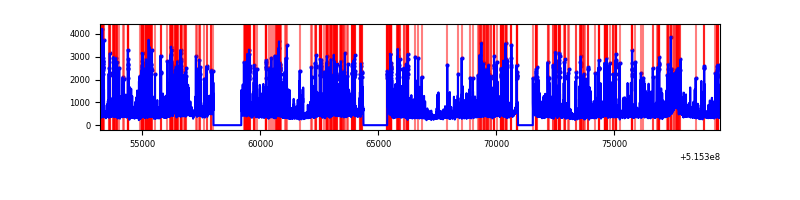 |
| D | 26296 | 23479 | 359 | 359 | 1.37% | 1.53% | 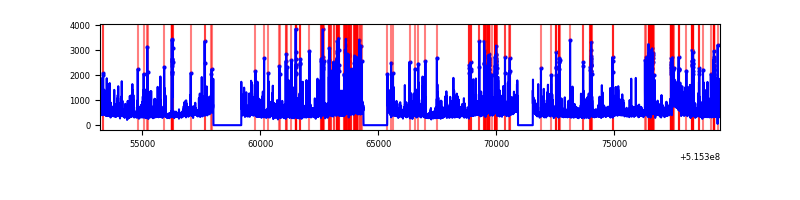 |
Top three noisy pixels from each quadrant. If the there are fewer than three noisy pixels in the level2.evt file, extra rows are filled as -1
| Pixel properties | Quadrant properties | ||||||
|---|---|---|---|---|---|---|---|
| Quadrant | DetID | PixID | Counts | Sigma | Mean | Median | Sigma |
| A | 0 | 12 | 966513 | 1543.91 | 2556 | 2490 | 624.4 |
| A | 3 | 14 | 569779 | 908.53 | 2556 | 2490 | 624.4 |
| A | 8 | 4 | 396433 | 630.91 | 2556 | 2490 | 624.4 |
| B | 5 | 185 | 793932 | 1465.88 | 2524 | 2421 | 540.0 |
| B | 7 | 252 | 479328 | 883.23 | 2524 | 2421 | 540.0 |
| B | 0 | 171 | 218119 | 399.47 | 2524 | 2421 | 540.0 |
| C | 15 | 224 | 4828762 | 7354.2 | 2439 | 2418 | 656.3 |
| C | 14 | 254 | 453802 | 687.8 | 2439 | 2418 | 656.3 |
| C | 6 | 223 | 244037 | 368.17 | 2439 | 2418 | 656.3 |
| D | 3 | 224 | 1688419 | 2470.14 | 2443 | 2334 | 682.6 |
| D | 8 | 240 | 1069325 | 1563.16 | 2443 | 2334 | 682.6 |
| D | 2 | 249 | 400831 | 583.8 | 2443 | 2334 | 682.6 |
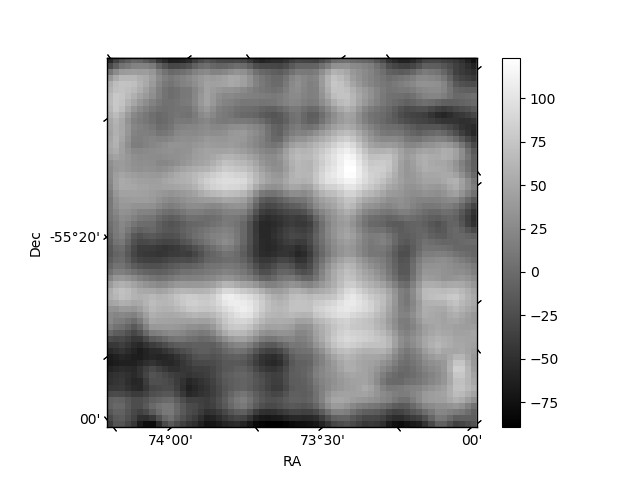
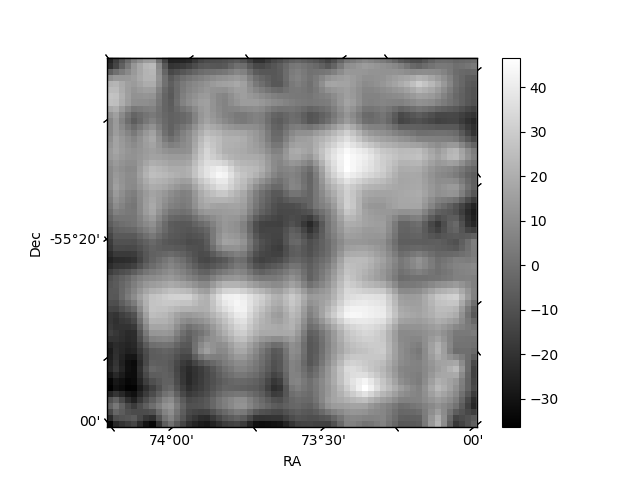
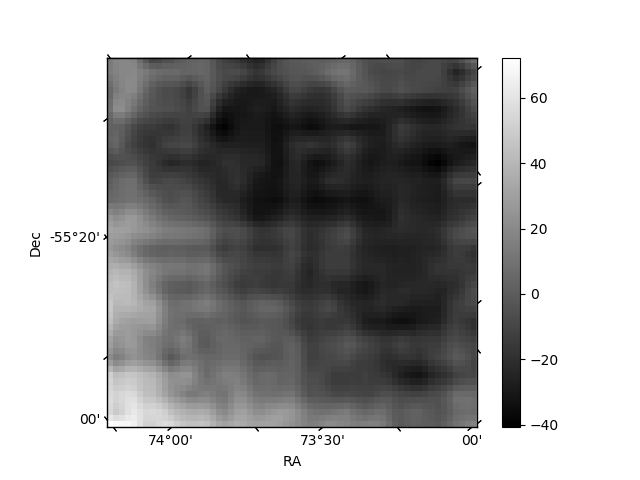
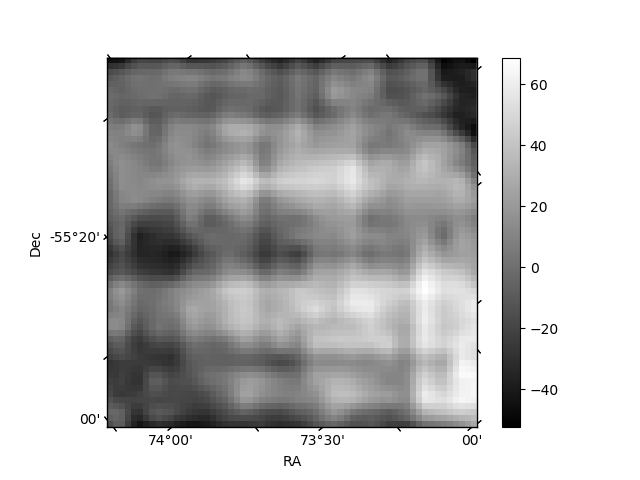
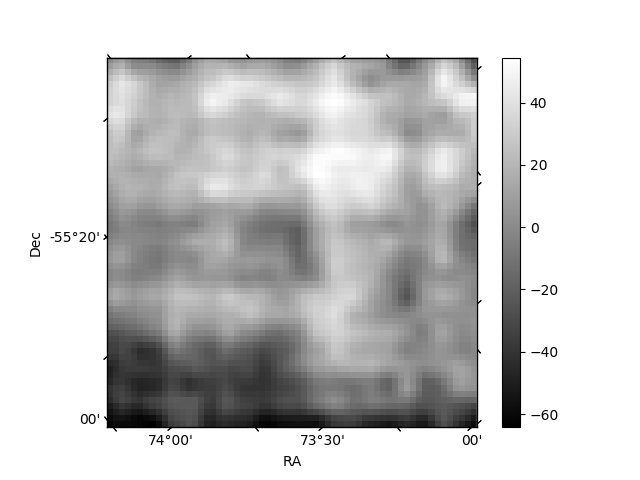
Histogram calculated using DETX and DETY for each event in the final _common_clean file
| Quadrant A | 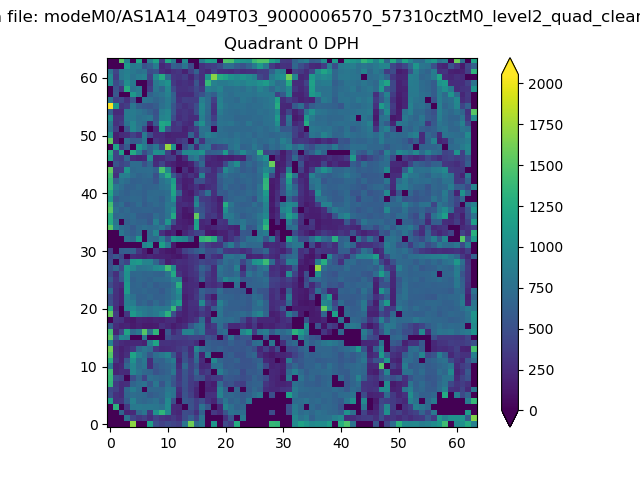 |
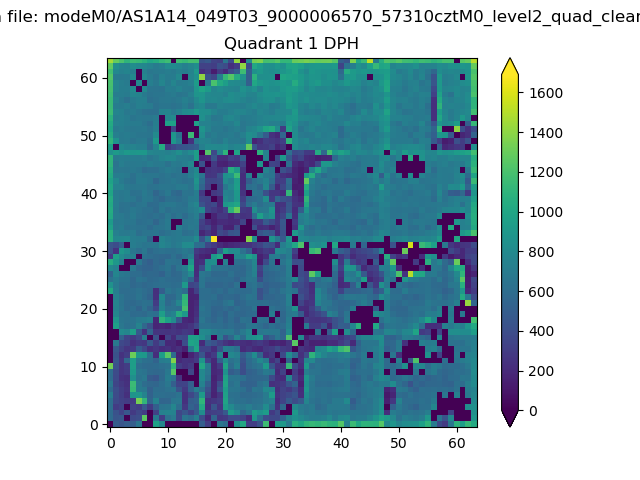 |
Quadrant B |
|---|---|---|---|
| Quadrant D | 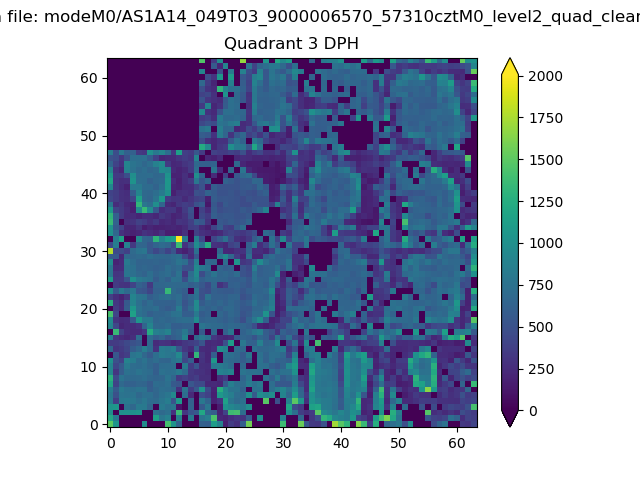 |
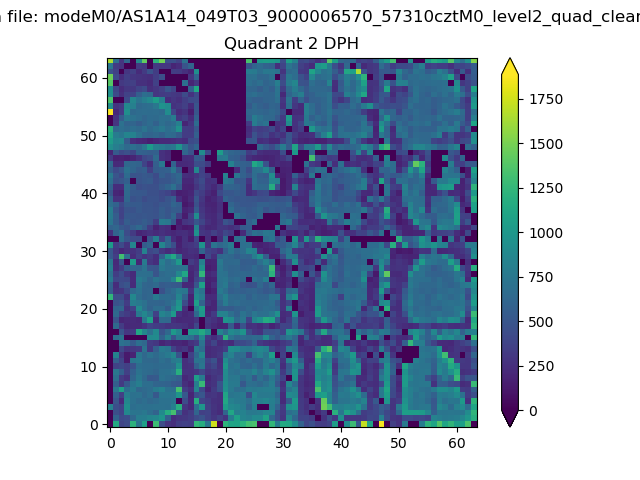 |
Quadrant C |
| Plot type | Count rate plots | Images |
|---|---|---|
| Comparison with Poisson distribution Blue bars denote a histogram of data divided into 1 sec bins. Red curve is a Poisson curve with rate = median count rate of data. |
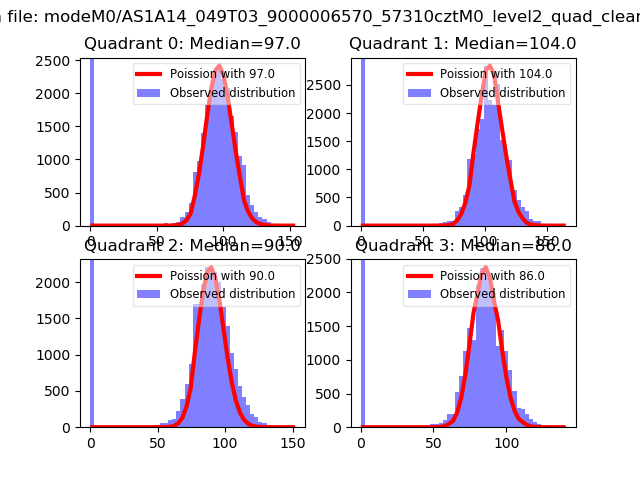 |
 |
| Quadrant-wise count rates Data is divided into 100 sec bins |
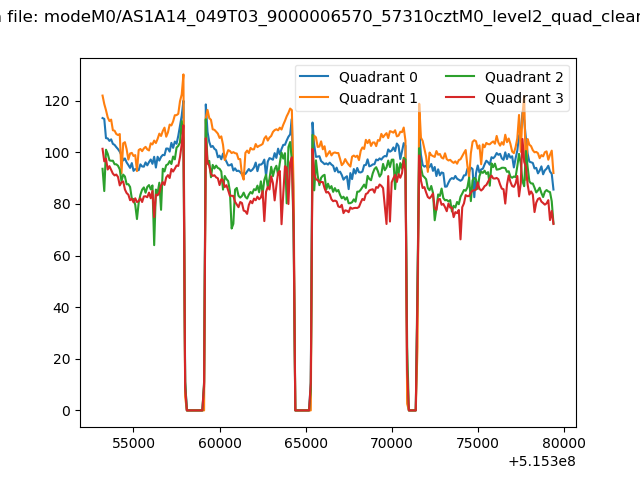 |
|
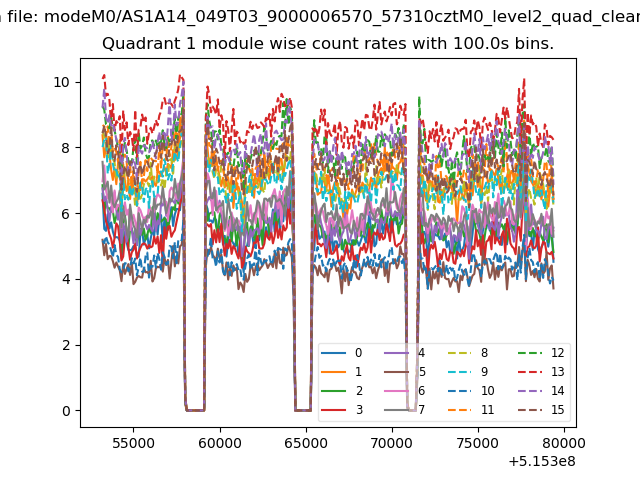
| Module-wise count rates for Quadrant A Data is divided into 100 sec bins |
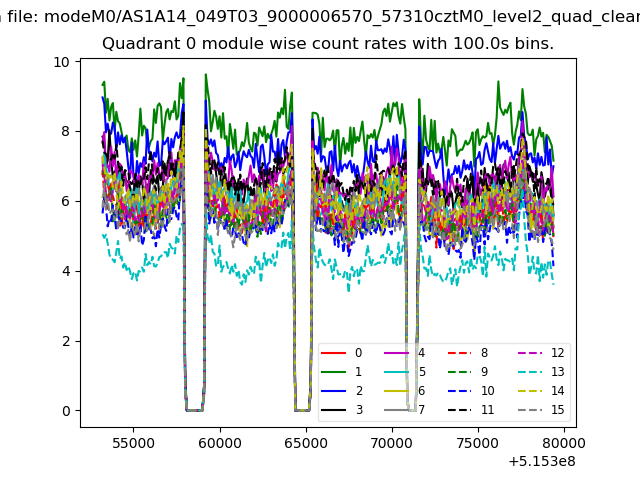 |
 |
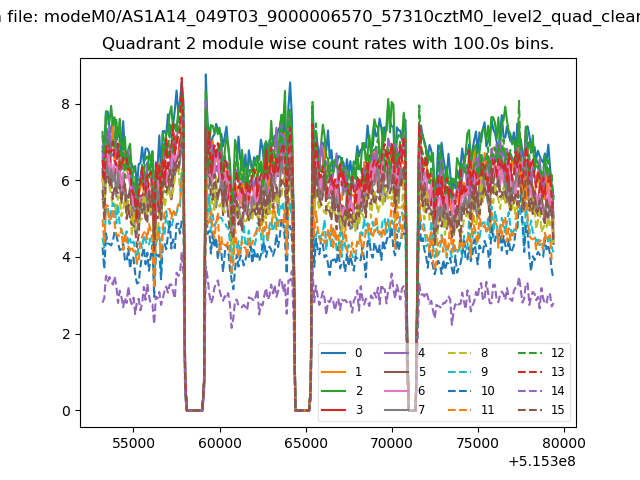
| Module-wise count rates for Quadrant B Data is divided into 100 sec bins |
 |
 |
| Module-wise count rates for Quadrant C Data is divided into 100 sec bins |
 |
 |
| Module-wise count rates for Quadrant D Data is divided into 100 sec bins |
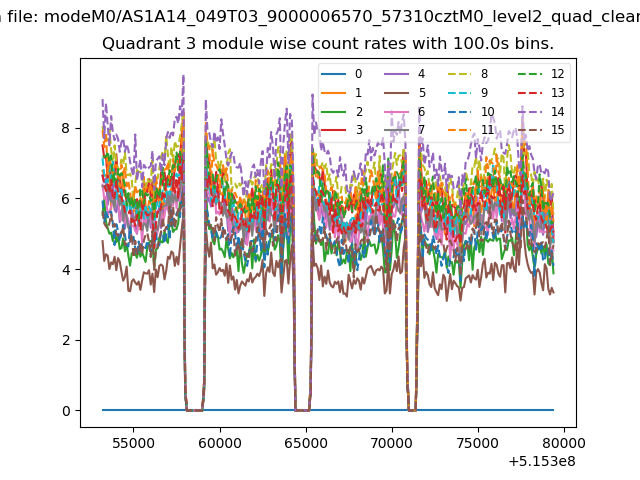 |
 |
| Parameter | Plot |
|---|---|
| CZT HV Monitor | 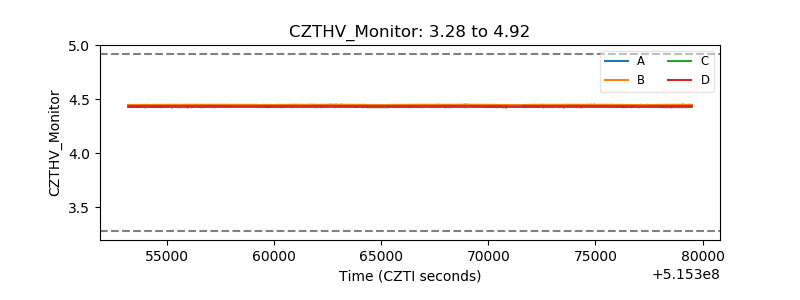 |
| D_VDD | 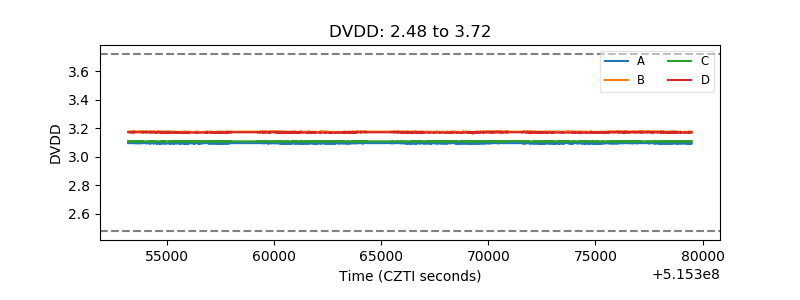 |
| Temperature 1 | 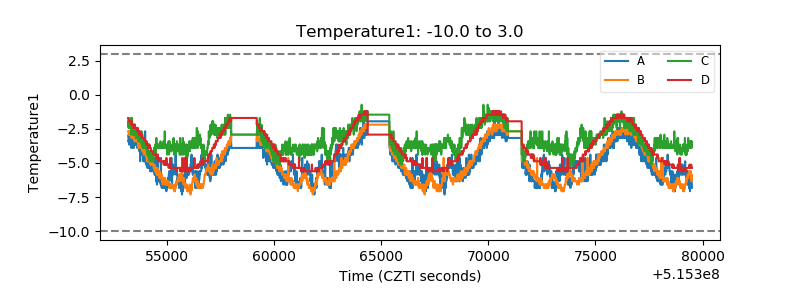 |
| Veto HV Monitor | 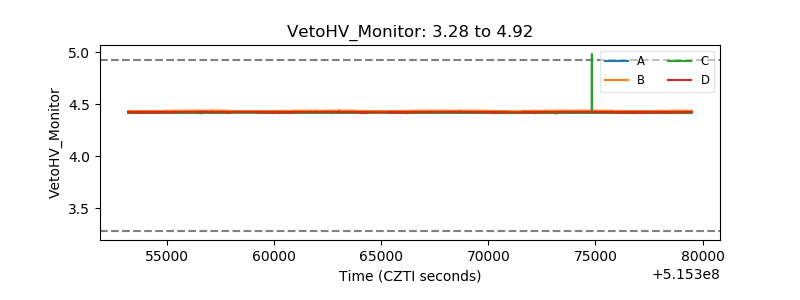 |
| Veto LLD | 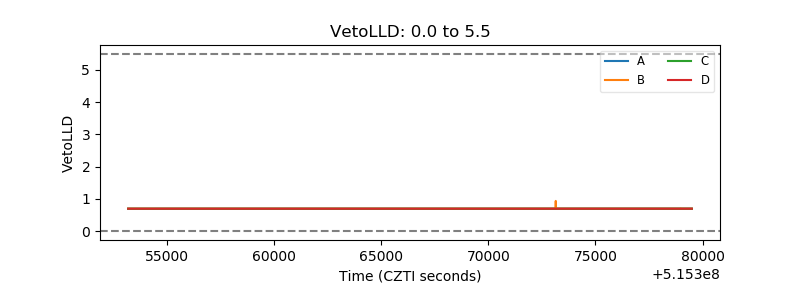 |
| Alpha Counter | 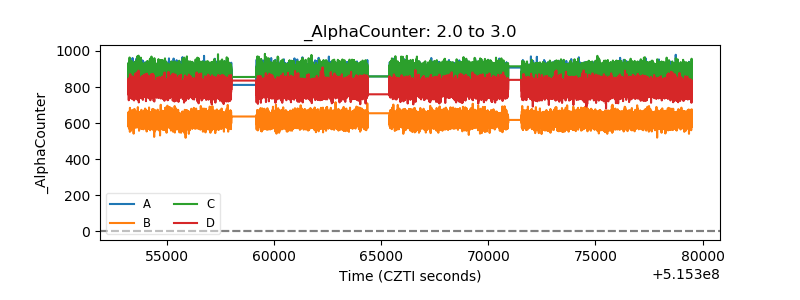 |
| _CPM_Rate | 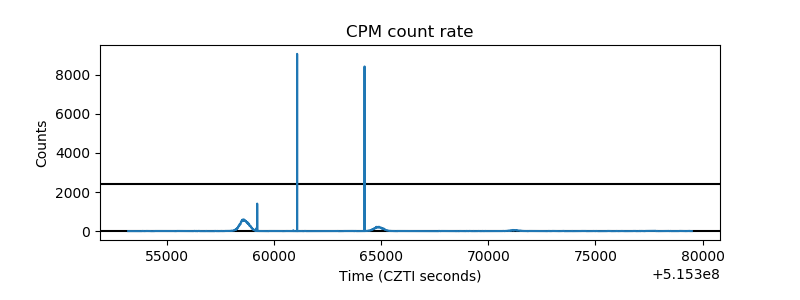 |
| CZT Counter | 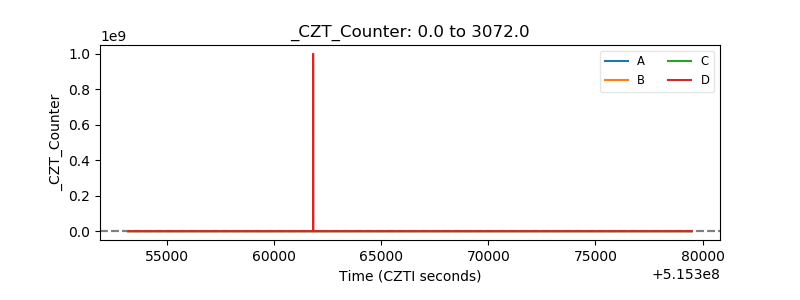 |
| +2.5 Volts monitor |  |
| +5 Volts monitor |  |
| _ROLL_ROT | 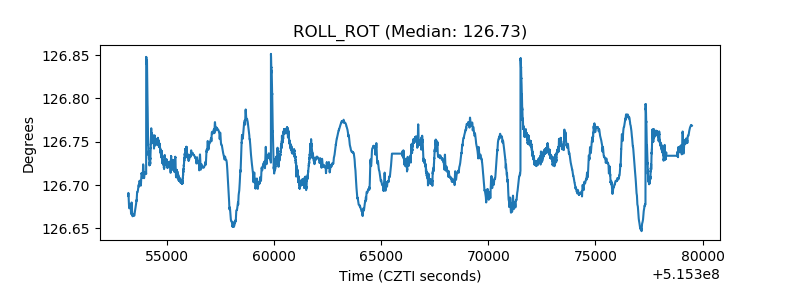 |
| _Roll_DEC | 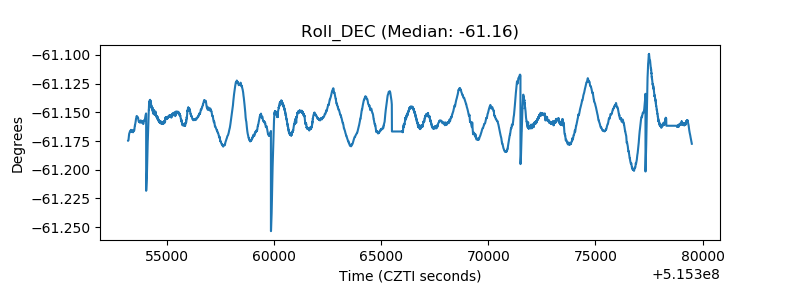 |
| _Roll_RA | 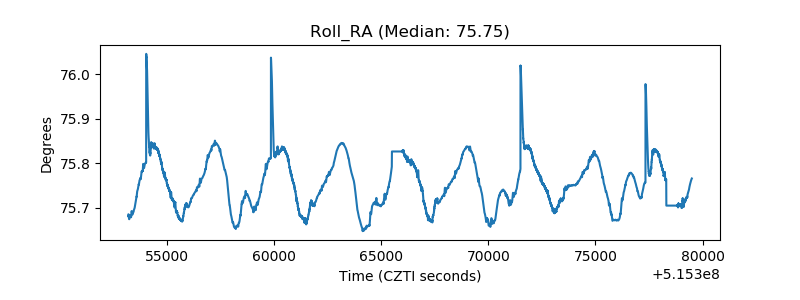 |
| Veto Counter | 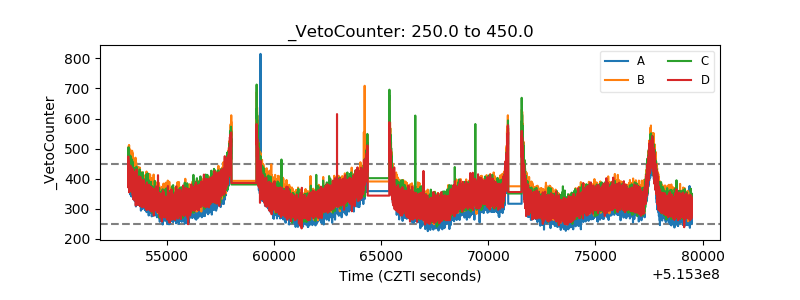 |