| Param | Original file | Final file |
|---|---|---|
| Filename | modeM0/AS1A14_049T03_9000006570_57311cztM0_level2.fits | modeM0/AS1A14_049T03_9000006570_57311cztM0_level2_quad_clean.evt |
| Size (bytes) | 492,229,440 | 102,435,840 |
| Size | 469.4 MB | 97.7 MB |
| Events in quadrant A | 4,766,256 | 651,185 |
| Events in quadrant B | 3,317,848 | 731,043 |
| Events in quadrant C | 4,991,016 | 621,701 |
| Events in quadrant D | 4,583,502 | 593,382 |
| Mode M0 | |||
|---|---|---|---|
| Quadrant | BADHDUFLAG | Total packets | Discarded packets |
| A | 0 | 19084 | 0 |
| B | 0 | 15137 | 0 |
| C | 0 | 19946 | 0 |
| D | 0 | 18721 | 0 |
| Mode SS | |||
|---|---|---|---|
| Quadrant | BADHDUFLAG | Total packets | Discarded packets |
| A | 0 | 146 | 0 |
| B | 0 | 146 | 0 |
| C | 0 | 146 | 0 |
| D | 0 | 146 | 0 |
| Quadrant | Total seconds | Saturated seconds | Saturation percentage |
|---|---|---|---|
| A | 7237 | 384 | 5.306066% |
| B | 7238 | 25 | 0.345399% |
| C | 7238 | 307 | 4.241503% |
| D | 7237 | 166 | 2.293768% |
Noise dominated data is calculated using 1-second bins in cleaned event files. If a bin has >2000 counts, and if more than 50% of those come from <1% of pixels, then it is considered to be noise-dominated and hence unusable.
| Quadrant | # 1 sec bins | Bins with >0 counts | Bins with >2000 counts | High rate bins dominated by noise | Noise dominated (total time) | Noise dominated (detector-on time) | Marked lightcurve |
|---|---|---|---|---|---|---|---|
| A | 7237 | 7237 | 309 | 309 | 4.27% | 4.27% | 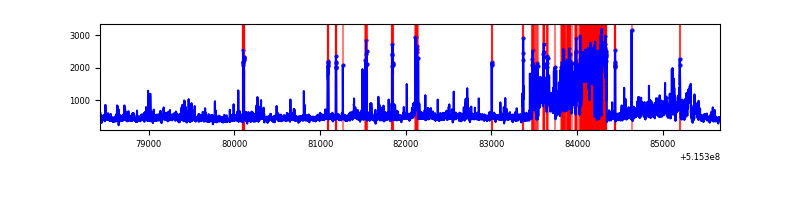 |
| B | 7238 | 7238 | 17 | 17 | 0.23% | 0.23% | 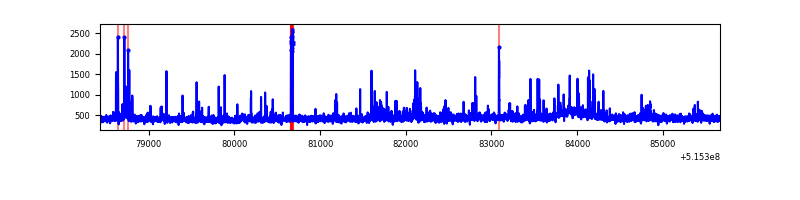 |
| C | 7238 | 7238 | 274 | 274 | 3.79% | 3.79% | 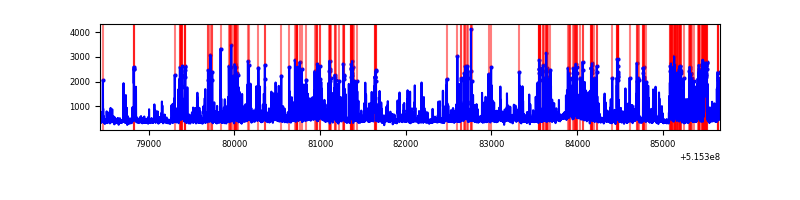 |
| D | 7237 | 7237 | 169 | 169 | 2.34% | 2.34% | 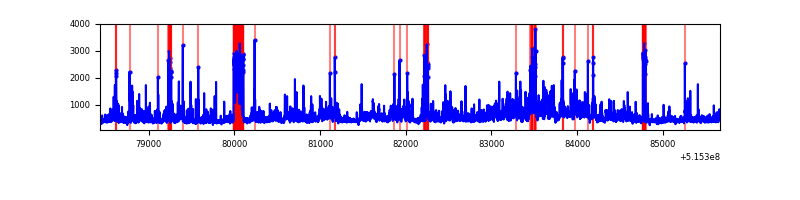 |
Top three noisy pixels from each quadrant. If the there are fewer than three noisy pixels in the level2.evt file, extra rows are filled as -1
| Pixel properties | Quadrant properties | ||||||
|---|---|---|---|---|---|---|---|
| Quadrant | DetID | PixID | Counts | Sigma | Mean | Median | Sigma |
| A | 3 | 14 | 1224580 | 6600.02 | 750 | 731 | 185.4 |
| A | 0 | 12 | 343192 | 1846.84 | 750 | 731 | 185.4 |
| A | 8 | 4 | 184576 | 991.45 | 750 | 731 | 185.4 |
| B | 5 | 185 | 98424 | 598.13 | 759 | 730 | 163.3 |
| B | 7 | 252 | 71760 | 434.88 | 759 | 730 | 163.3 |
| B | 10 | 16 | 56118 | 339.11 | 759 | 730 | 163.3 |
| C | 15 | 224 | 1890760 | 9473.56 | 731 | 725 | 199.5 |
| C | 14 | 254 | 111659 | 556.04 | 731 | 725 | 199.5 |
| C | 6 | 223 | 71243 | 353.46 | 731 | 725 | 199.5 |
| D | 3 | 224 | 934474 | 4545.3 | 728 | 694 | 205.4 |
| D | 2 | 31 | 245306 | 1190.68 | 728 | 694 | 205.4 |
| D | 8 | 240 | 236320 | 1146.94 | 728 | 694 | 205.4 |
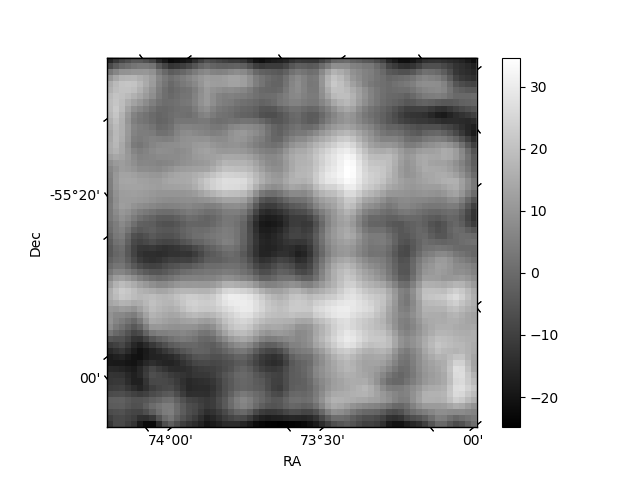
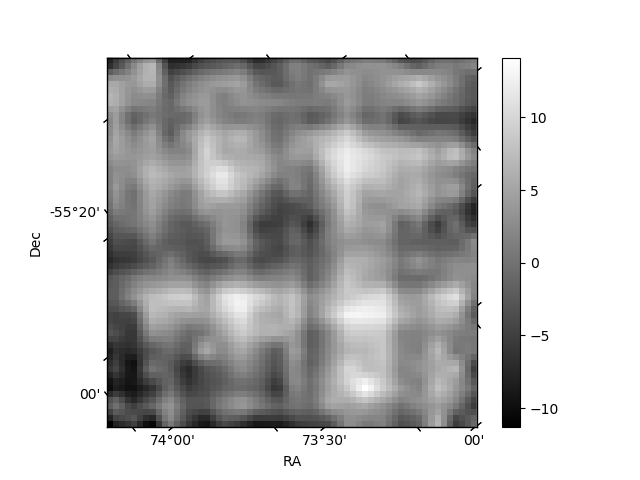
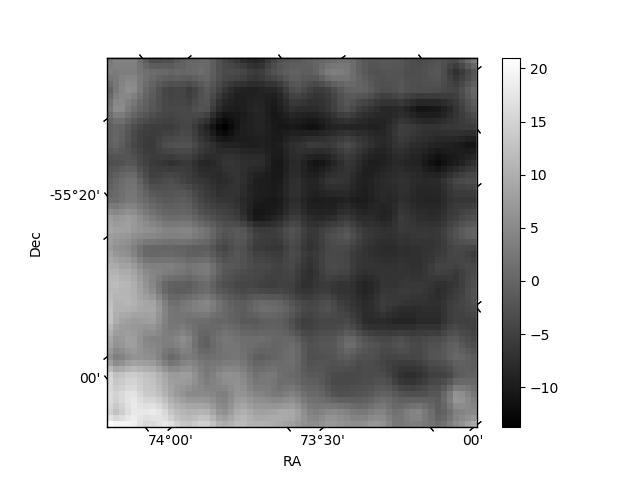
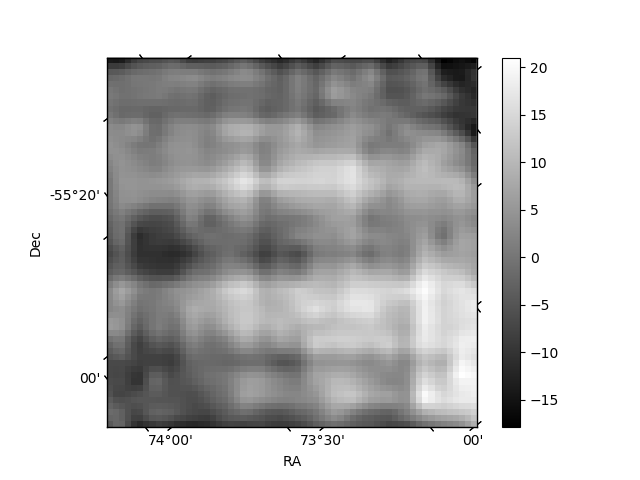
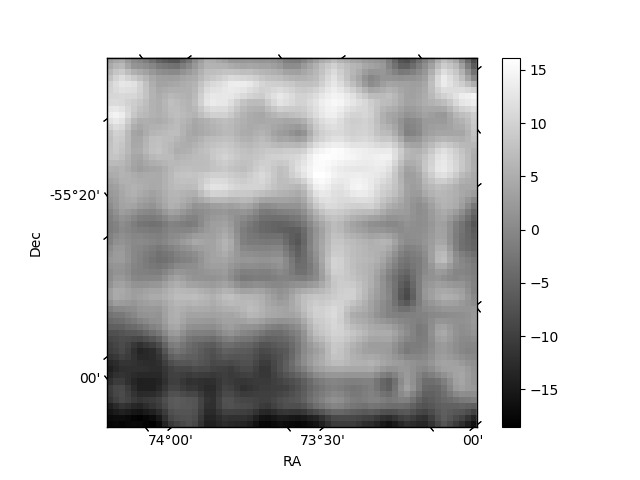
Histogram calculated using DETX and DETY for each event in the final _common_clean file
| Quadrant A | 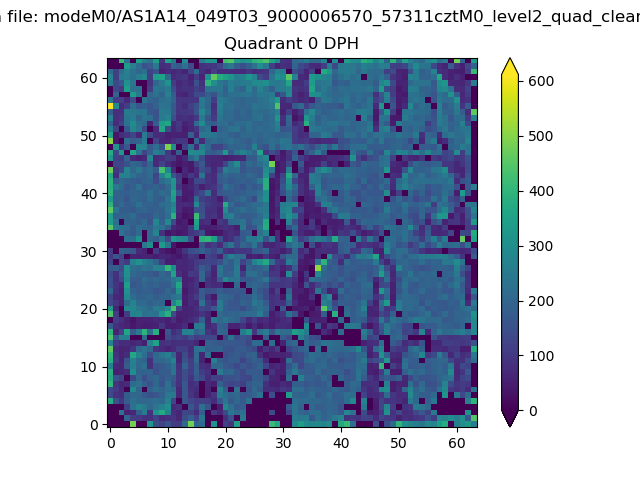 |
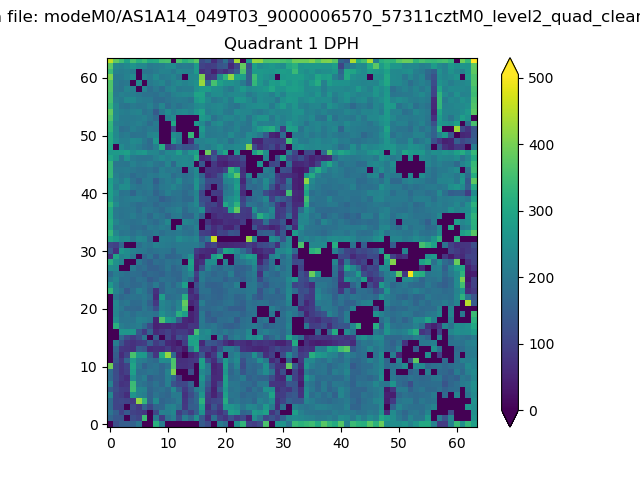 |
Quadrant B |
|---|---|---|---|
| Quadrant D | 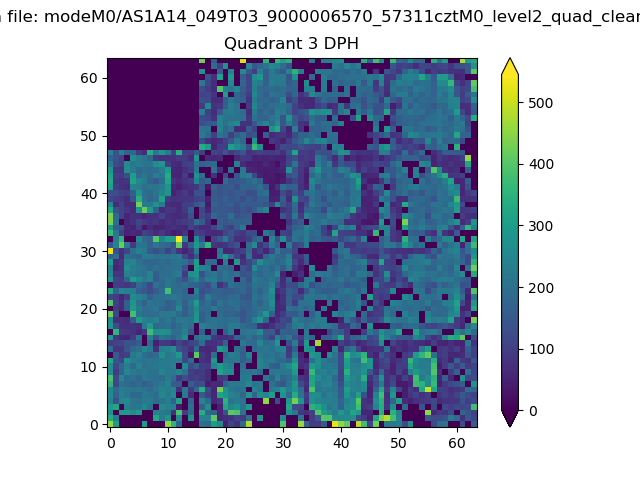 |
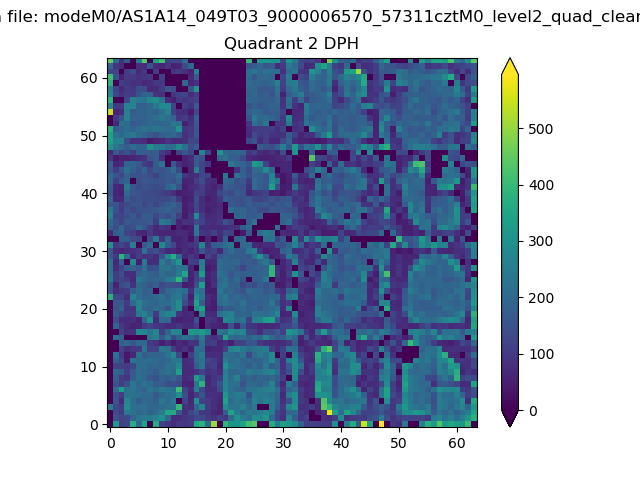 |
Quadrant C |
| Plot type | Count rate plots | Images |
|---|---|---|
| Comparison with Poisson distribution Blue bars denote a histogram of data divided into 1 sec bins. Red curve is a Poisson curve with rate = median count rate of data. |
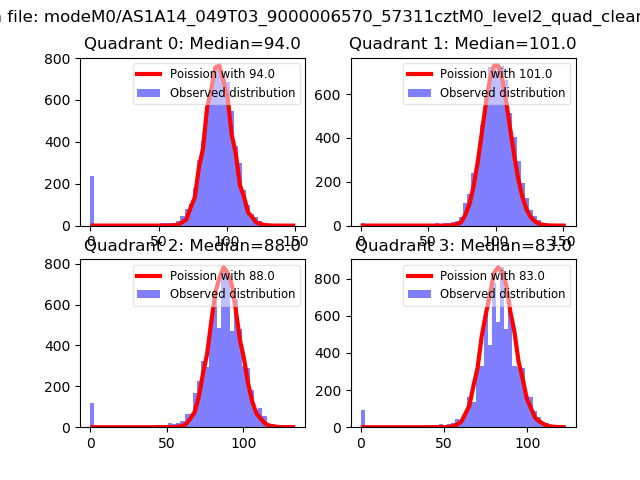 |
 |
| Quadrant-wise count rates Data is divided into 100 sec bins |
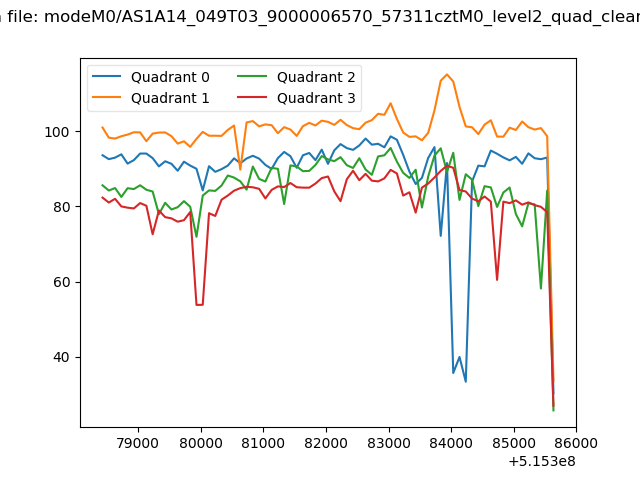 |
|
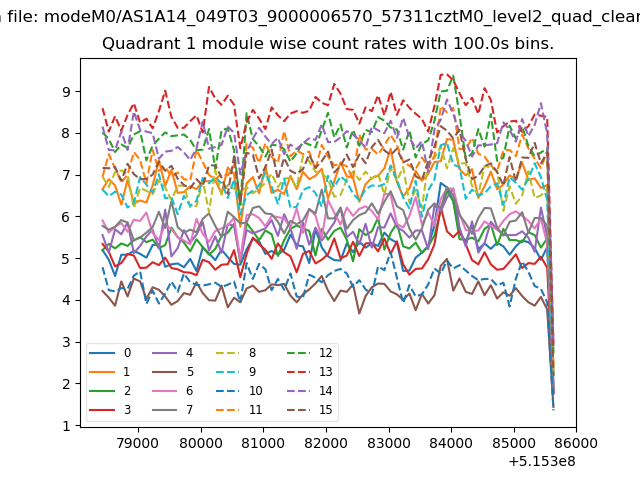
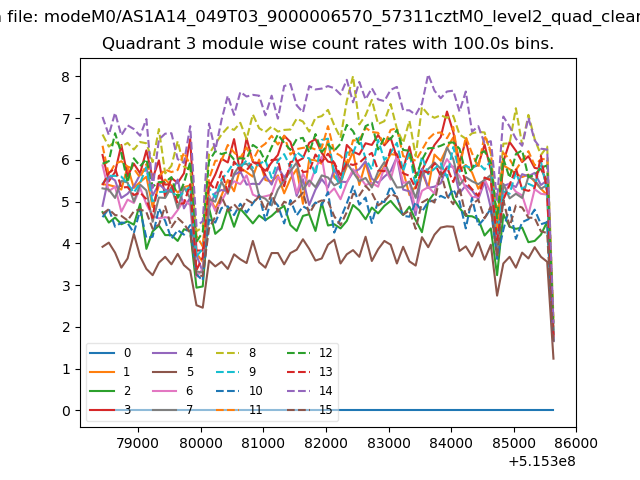
| Module-wise count rates for Quadrant A Data is divided into 100 sec bins |
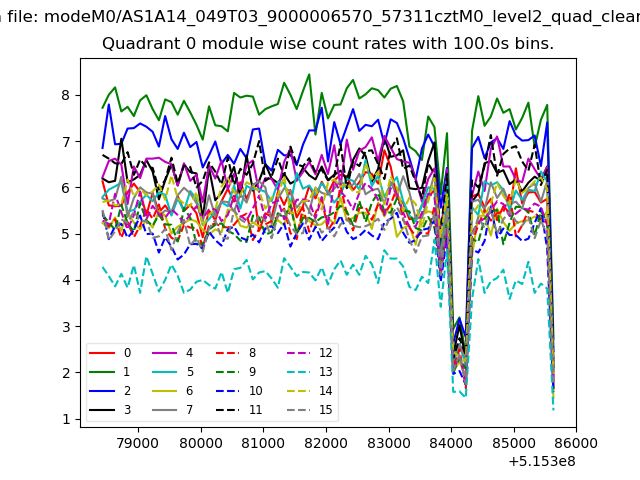 |
 |
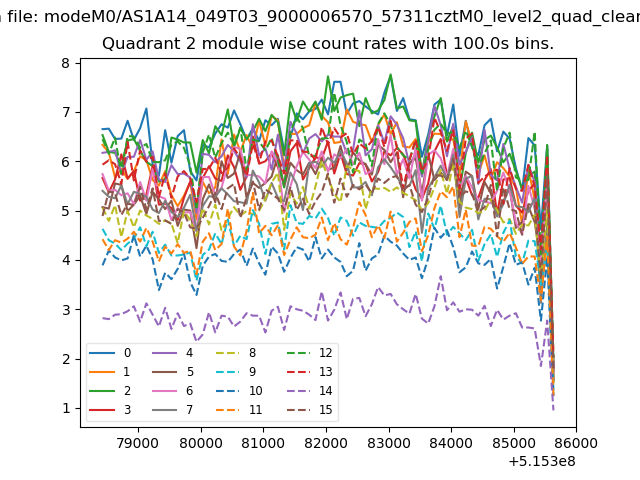
| Module-wise count rates for Quadrant B Data is divided into 100 sec bins |
 |
 |
| Module-wise count rates for Quadrant C Data is divided into 100 sec bins |
 |
 |
| Module-wise count rates for Quadrant D Data is divided into 100 sec bins |
 |
 |
| Parameter | Plot |
|---|---|
| CZT HV Monitor |  |
| D_VDD | 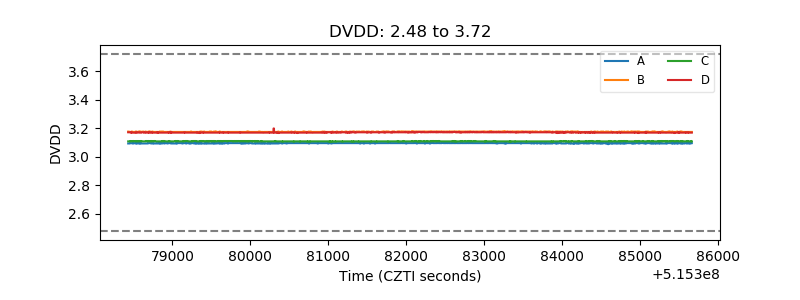 |
| Temperature 1 | 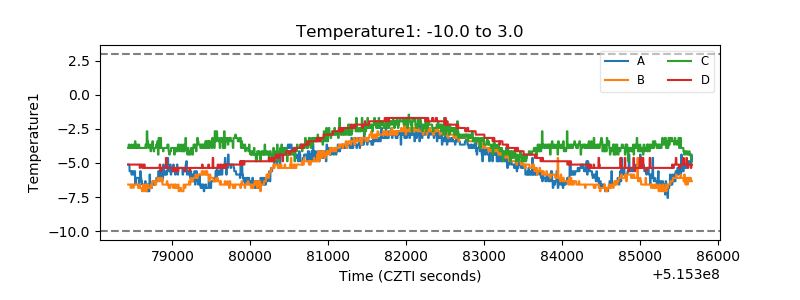 |
| Veto HV Monitor | 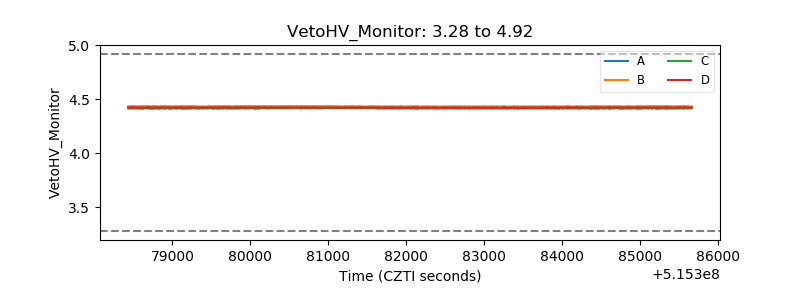 |
| Veto LLD | 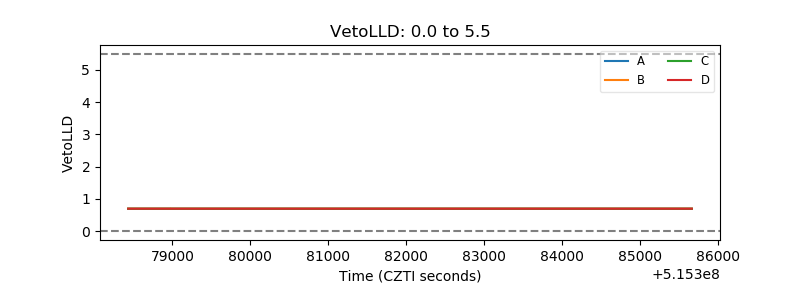 |
| Alpha Counter | 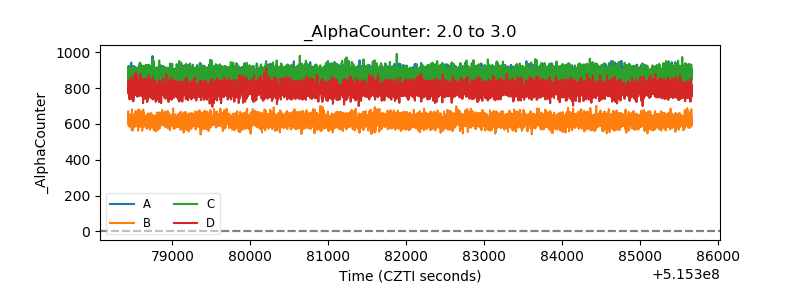 |
| _CPM_Rate | 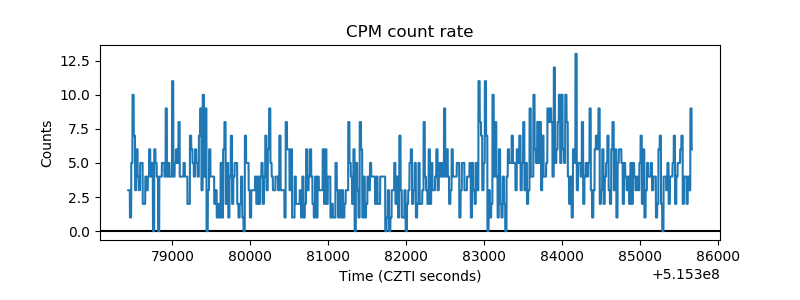 |
| CZT Counter | 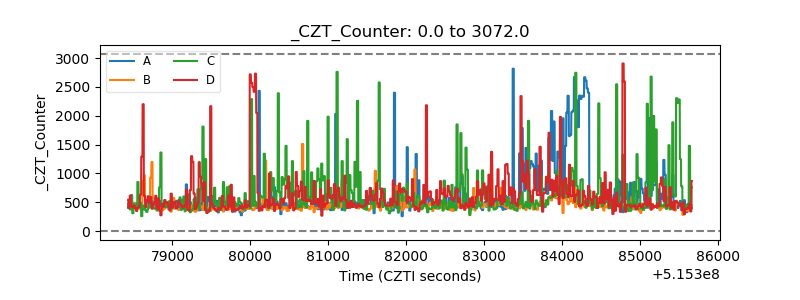 |
| +2.5 Volts monitor |  |
| +5 Volts monitor |  |
| _ROLL_ROT | 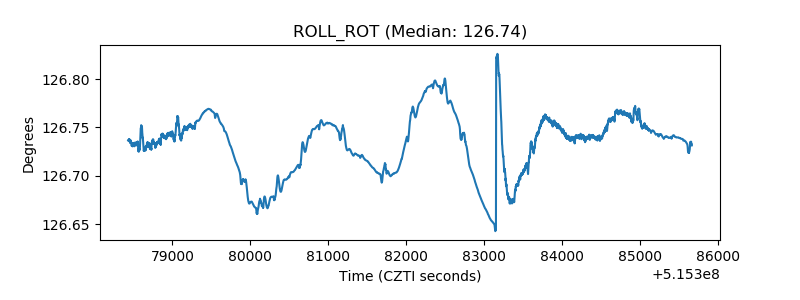 |
| _Roll_DEC | 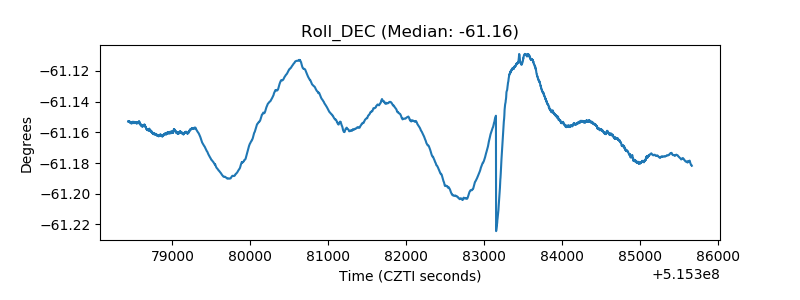 |
| _Roll_RA | 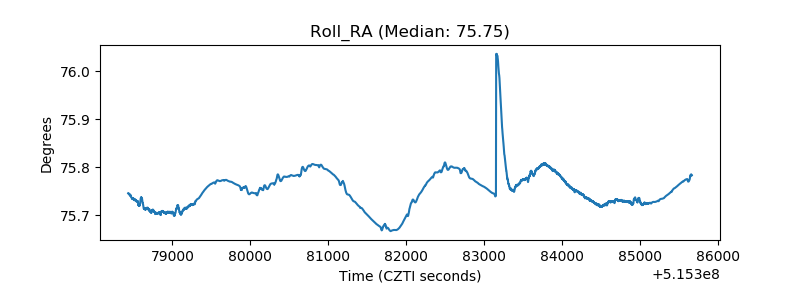 |
| Veto Counter | 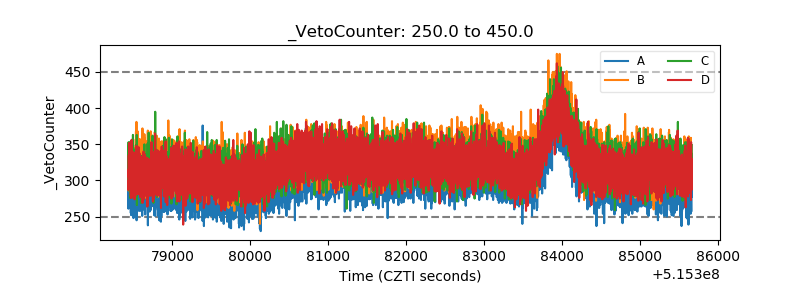 |