| Param | Original file | Final file |
|---|---|---|
| Filename | modeM0/AS1A14_049T03_9000006570_57312cztM0_level2.fits | modeM0/AS1A14_049T03_9000006570_57312cztM0_level2_quad_clean.evt |
| Size (bytes) | 602,236,800 | 101,615,040 |
| Size | 574.3 MB | 96.9 MB |
| Events in quadrant A | 5,796,833 | 678,318 |
| Events in quadrant B | 3,438,917 | 744,232 |
| Events in quadrant C | 7,863,456 | 532,393 |
| Events in quadrant D | 4,624,602 | 610,595 |
| Mode M0 | |||
|---|---|---|---|
| Quadrant | BADHDUFLAG | Total packets | Discarded packets |
| A | 0 | 22274 | 0 |
| B | 0 | 15574 | 0 |
| C | 0 | 28491 | 0 |
| D | 0 | 18811 | 0 |
| Mode SS | |||
|---|---|---|---|
| Quadrant | BADHDUFLAG | Total packets | Discarded packets |
| A | 0 | 148 | 0 |
| B | 0 | 148 | 0 |
| C | 0 | 148 | 0 |
| D | 0 | 148 | 0 |
| Quadrant | Total seconds | Saturated seconds | Saturation percentage |
|---|---|---|---|
| A | 7339 | 253 | 3.447336% |
| B | 7339 | 57 | 0.776673% |
| C | 7339 | 1485 | 20.234364% |
| D | 7340 | 138 | 1.880109% |
Noise dominated data is calculated using 1-second bins in cleaned event files. If a bin has >2000 counts, and if more than 50% of those come from <1% of pixels, then it is considered to be noise-dominated and hence unusable.
| Quadrant | # 1 sec bins | Bins with >0 counts | Bins with >2000 counts | High rate bins dominated by noise | Noise dominated (total time) | Noise dominated (detector-on time) | Marked lightcurve |
|---|---|---|---|---|---|---|---|
| A | 7339 | 7339 | 154 | 154 | 2.10% | 2.10% | 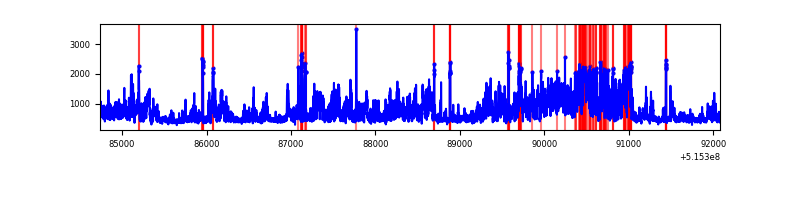 |
| B | 7339 | 7339 | 24 | 24 | 0.33% | 0.33% | 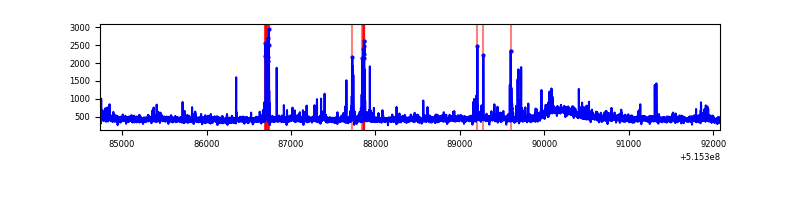 |
| C | 7339 | 7339 | 1386 | 1386 | 18.89% | 18.89% | 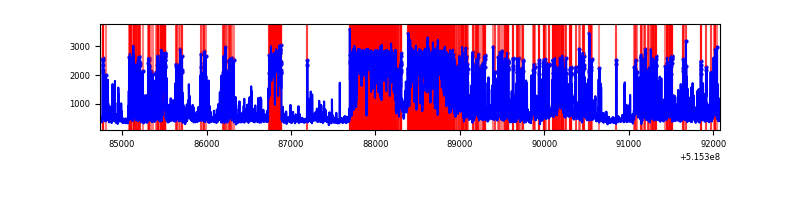 |
| D | 7340 | 7340 | 128 | 128 | 1.74% | 1.74% | 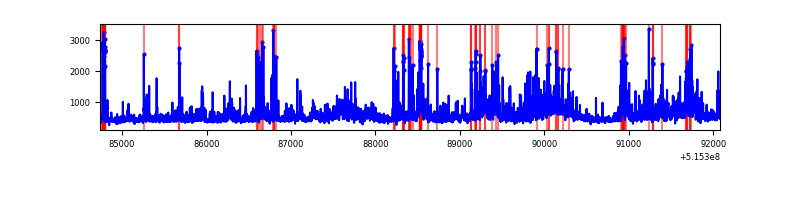 |
Top three noisy pixels from each quadrant. If the there are fewer than three noisy pixels in the level2.evt file, extra rows are filled as -1
| Pixel properties | Quadrant properties | ||||||
|---|---|---|---|---|---|---|---|
| Quadrant | DetID | PixID | Counts | Sigma | Mean | Median | Sigma |
| A | 0 | 12 | 2441490 | 12615.22 | 779 | 759 | 193.5 |
| A | 3 | 14 | 125600 | 645.26 | 779 | 759 | 193.5 |
| A | 8 | 4 | 119019 | 611.24 | 779 | 759 | 193.5 |
| B | 5 | 185 | 245303 | 1446.96 | 781 | 749 | 169.0 |
| B | 7 | 252 | 42315 | 245.93 | 781 | 749 | 169.0 |
| B | 12 | 111 | 21111 | 120.48 | 781 | 749 | 169.0 |
| C | 15 | 224 | 4531773 | 24197.48 | 694 | 689 | 187.3 |
| C | 6 | 223 | 494637 | 2637.84 | 694 | 689 | 187.3 |
| C | 14 | 254 | 63446 | 335.14 | 694 | 689 | 187.3 |
| D | 3 | 224 | 878769 | 4134.01 | 756 | 721 | 212.4 |
| D | 8 | 240 | 438097 | 2059.24 | 756 | 721 | 212.4 |
| D | 2 | 249 | 187600 | 879.86 | 756 | 721 | 212.4 |
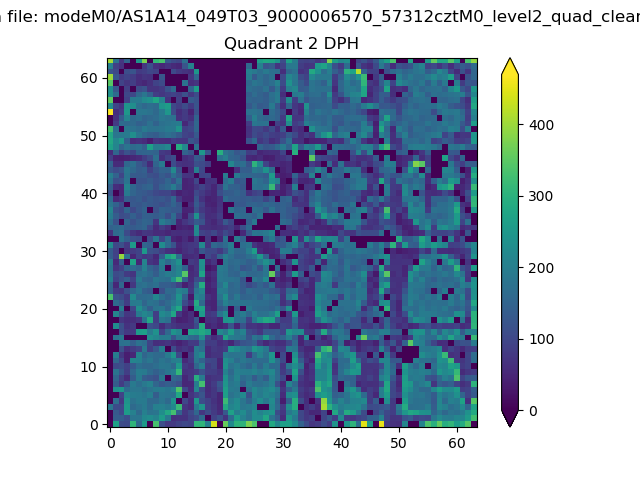
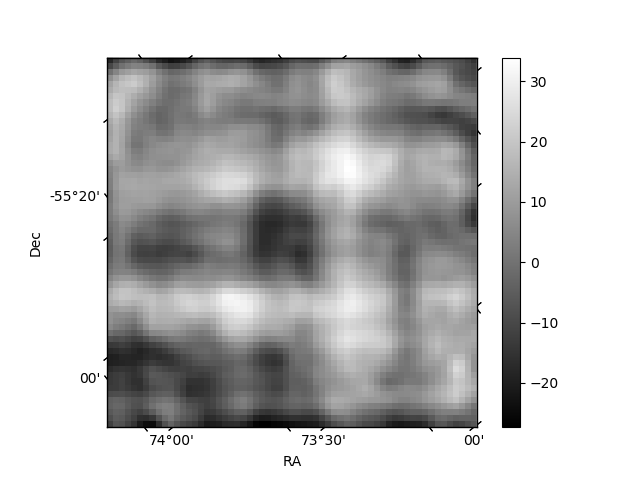
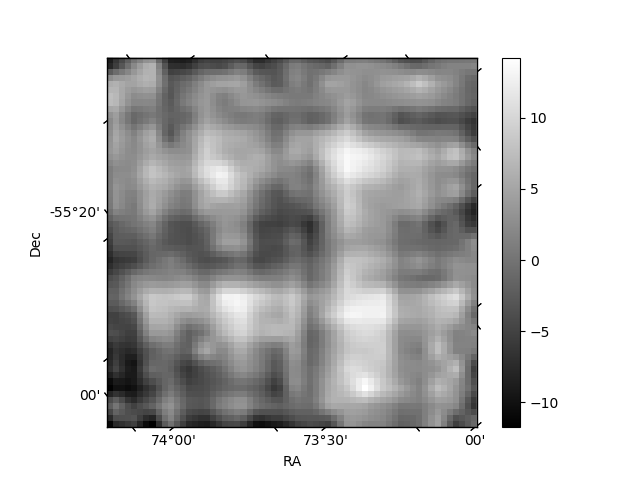
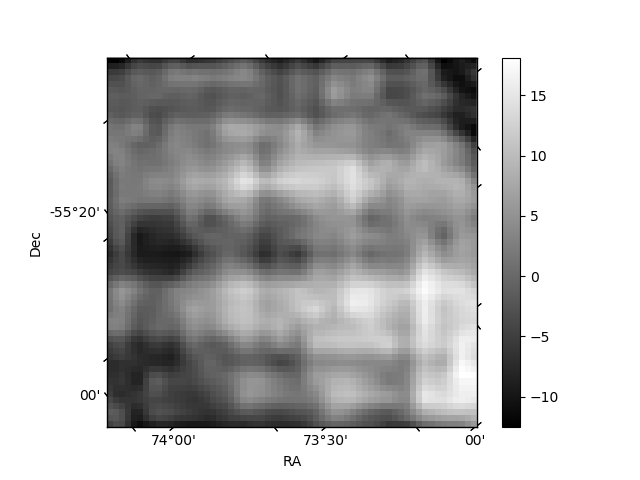
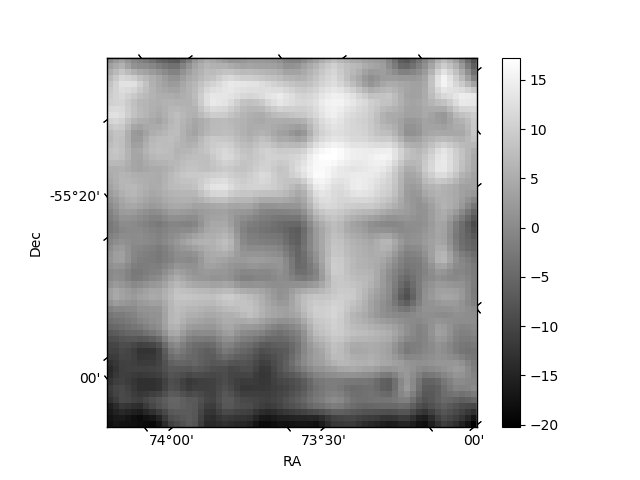
Histogram calculated using DETX and DETY for each event in the final _common_clean file
| Quadrant A | 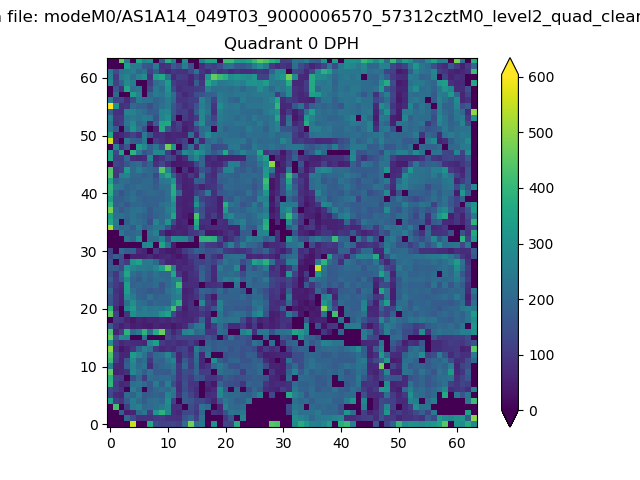 |
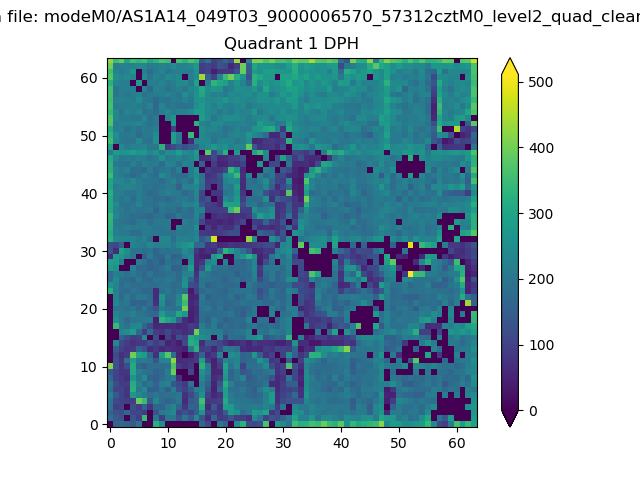 |
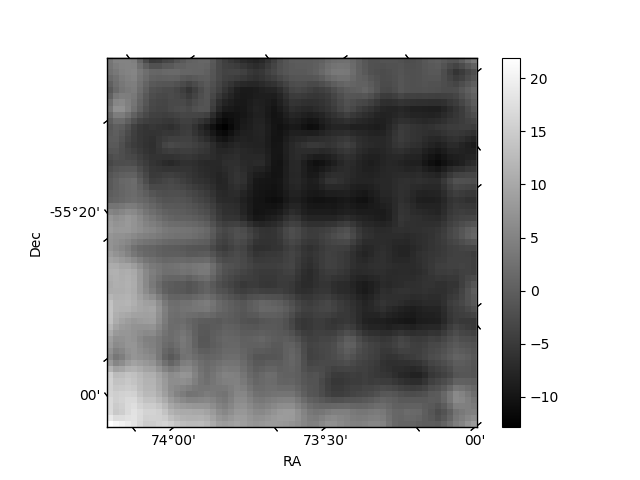
Quadrant B |
|---|---|---|---|
| Quadrant D | 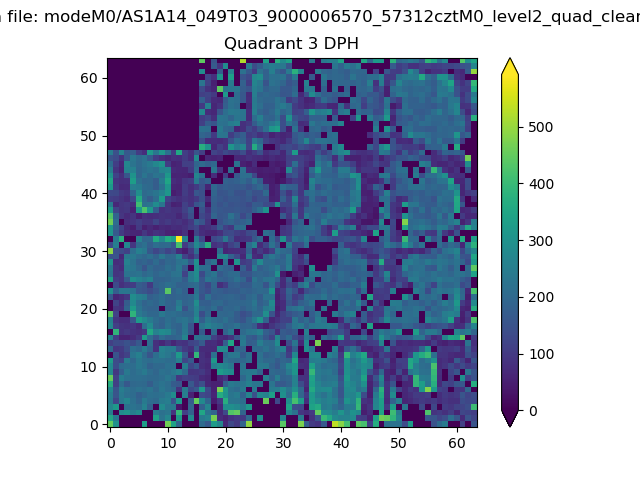 |
 |
Quadrant C |
| Plot type | Count rate plots | Images |
|---|---|---|
| Comparison with Poisson distribution Blue bars denote a histogram of data divided into 1 sec bins. Red curve is a Poisson curve with rate = median count rate of data. |
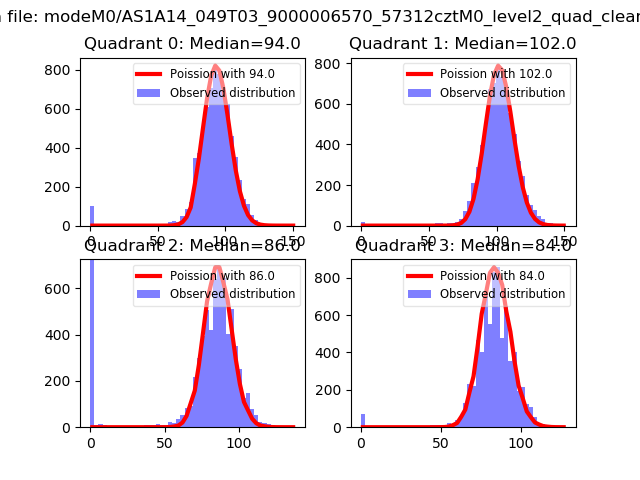 |
 |
| Quadrant-wise count rates Data is divided into 100 sec bins |
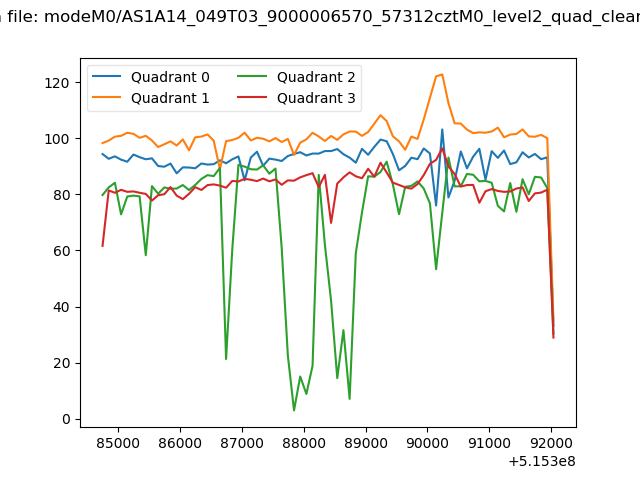 |
|
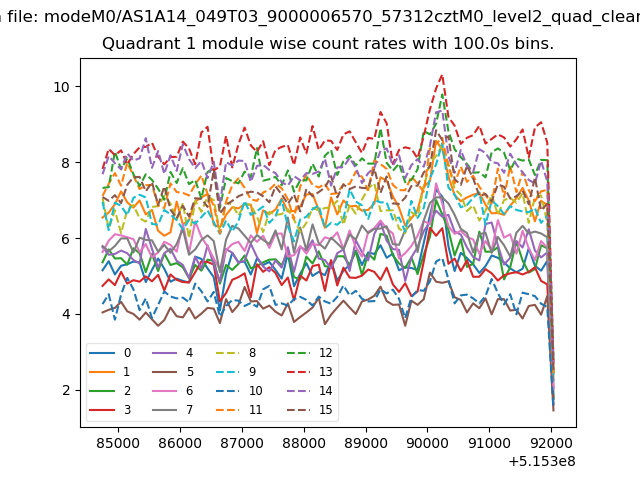
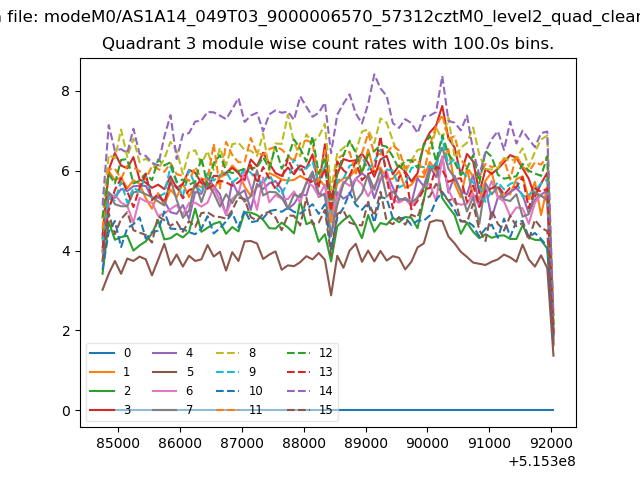
| Module-wise count rates for Quadrant A Data is divided into 100 sec bins |
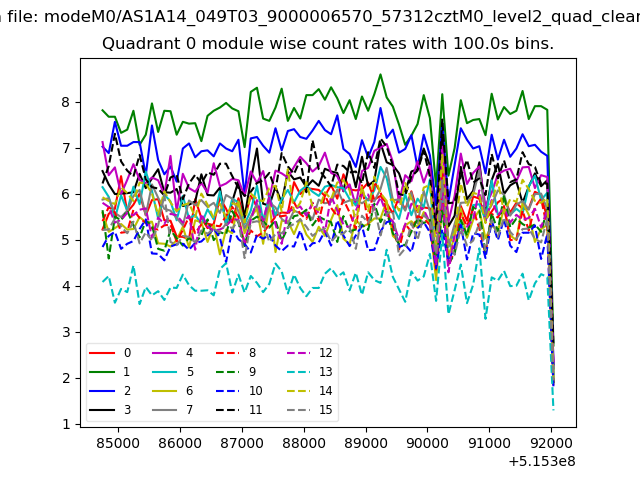 |
 |
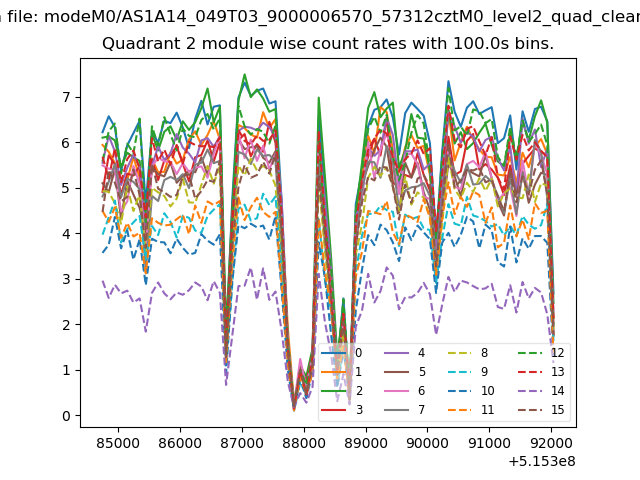
| Module-wise count rates for Quadrant B Data is divided into 100 sec bins |
 |
 |
| Module-wise count rates for Quadrant C Data is divided into 100 sec bins |
 |
 |
| Module-wise count rates for Quadrant D Data is divided into 100 sec bins |
 |
 |
| Parameter | Plot |
|---|---|
| CZT HV Monitor | 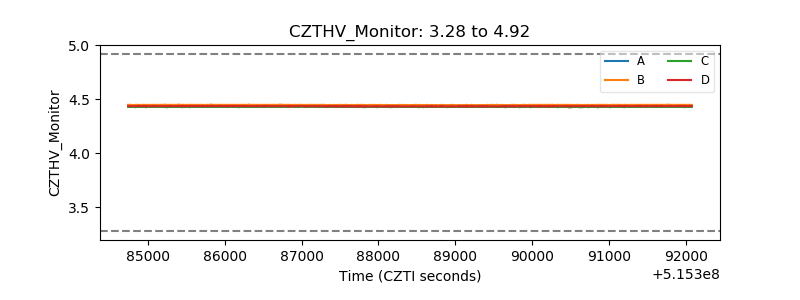 |
| D_VDD | 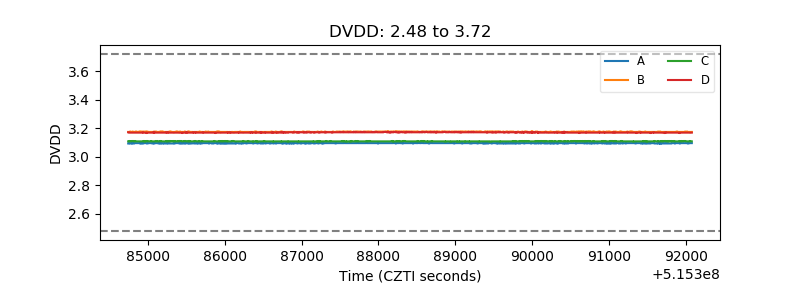 |
| Temperature 1 | 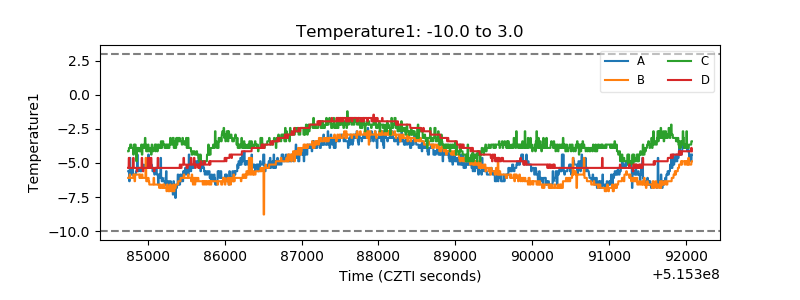 |
| Veto HV Monitor | 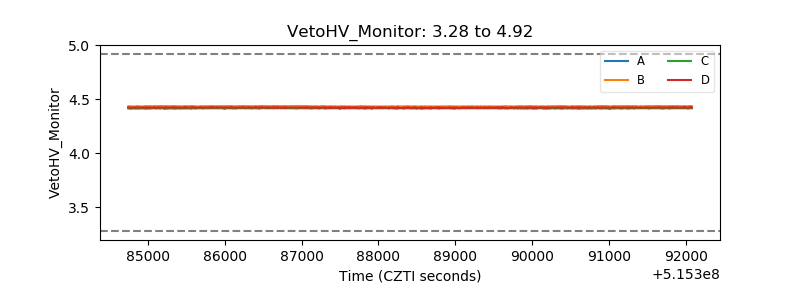 |
| Veto LLD | 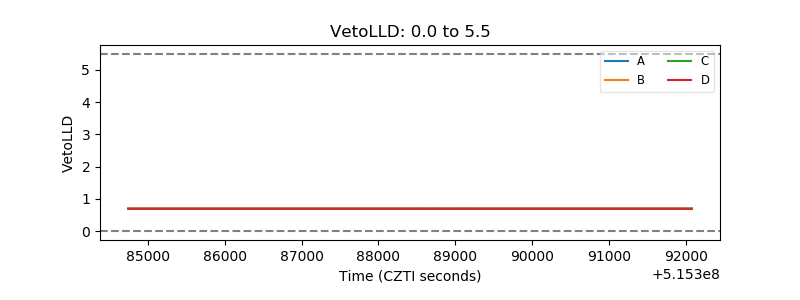 |
| Alpha Counter | 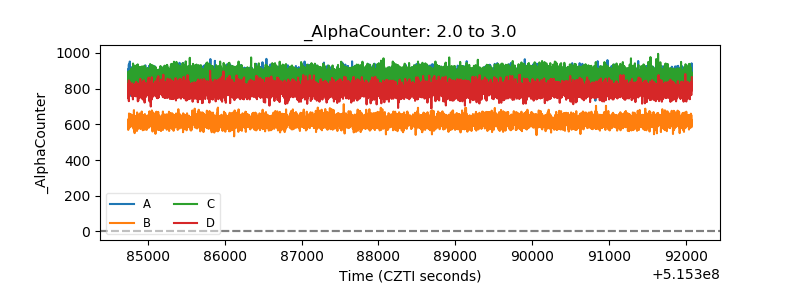 |
| _CPM_Rate | 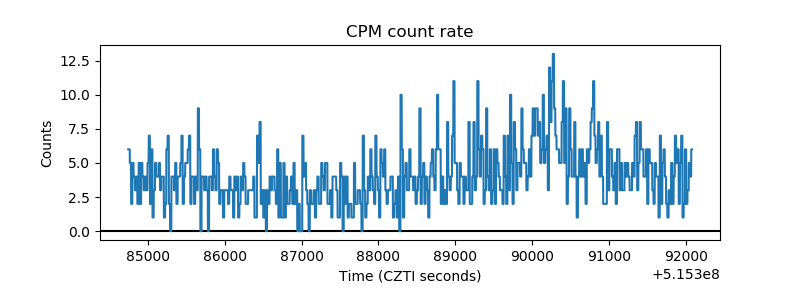 |
| CZT Counter | 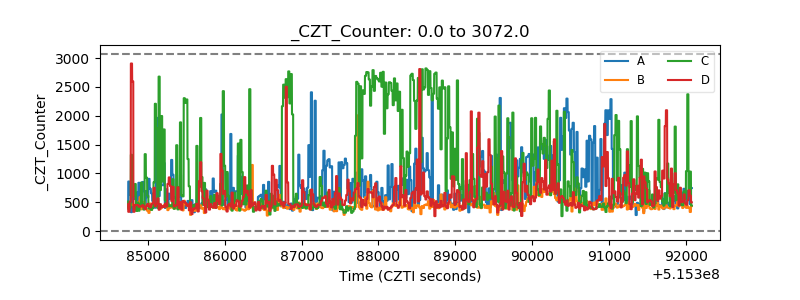 |
| +2.5 Volts monitor |  |
| +5 Volts monitor |  |
| _ROLL_ROT | 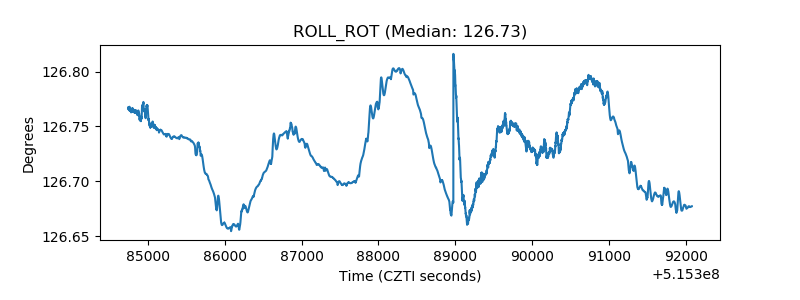 |
| _Roll_DEC | 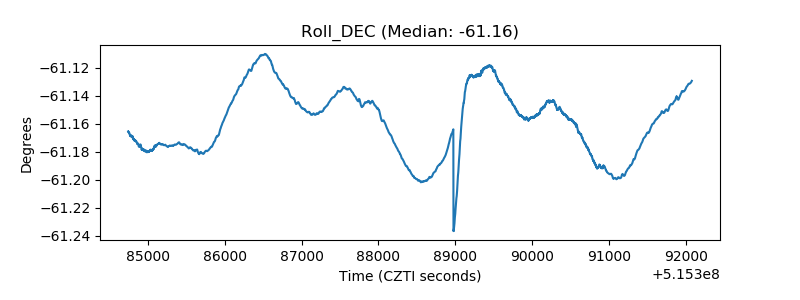 |
| _Roll_RA | 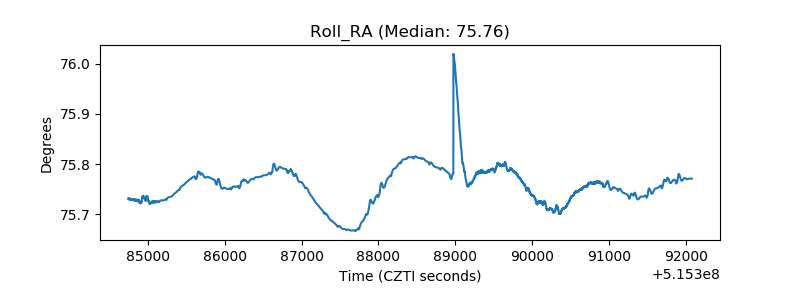 |
| Veto Counter | 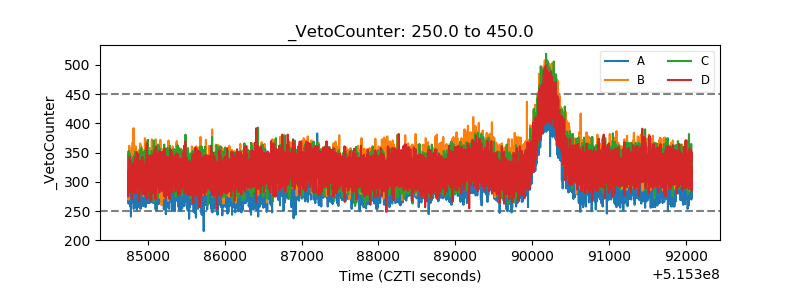 |