| Param | Original file | Final file |
|---|---|---|
| Filename | modeM0/AS1A14_049T03_9000006570_57315cztM0_level2.fits | modeM0/AS1A14_049T03_9000006570_57315cztM0_level2_quad_clean.evt |
| Size (bytes) | 1,377,846,720 | 263,658,240 |
| Size | 1.3 GB | 251.4 MB |
| Events in quadrant A | 12,143,789 | 1,734,113 |
| Events in quadrant B | 9,591,015 | 1,858,955 |
| Events in quadrant C | 14,340,175 | 1,556,555 |
| Events in quadrant D | 13,466,037 | 1,530,204 |
| Mode M0 | |||
|---|---|---|---|
| Quadrant | BADHDUFLAG | Total packets | Discarded packets |
| A | 0 | 49342 | 3 |
| B | 0 | 41729 | 3 |
| C | 0 | 56018 | 3 |
| D | 0 | 53001 | 3 |
| Mode M9 | |||
|---|---|---|---|
| Quadrant | BADHDUFLAG | Total packets | Discarded packets |
| A | 0 | 14 | 0 |
| B | 0 | 14 | 0 |
| C | 0 | 14 | 0 |
| D | 0 | 14 | 0 |
| Mode SS | |||
|---|---|---|---|
| Quadrant | BADHDUFLAG | Total packets | Discarded packets |
| A | 0 | 382 | 0 |
| B | 0 | 382 | 0 |
| C | 0 | 382 | 0 |
| D | 0 | 382 | 0 |
| Quadrant | Total seconds | Saturated seconds | Saturation percentage |
|---|---|---|---|
| A | 18913 | 595 | 3.145984% |
| B | 18914 | 552 | 2.918473% |
| C | 18914 | 1575 | 8.327165% |
| D | 18914 | 828 | 4.377710% |
Noise dominated data is calculated using 1-second bins in cleaned event files. If a bin has >2000 counts, and if more than 50% of those come from <1% of pixels, then it is considered to be noise-dominated and hence unusable.
| Quadrant | # 1 sec bins | Bins with >0 counts | Bins with >2000 counts | High rate bins dominated by noise | Noise dominated (total time) | Noise dominated (detector-on time) | Marked lightcurve |
|---|---|---|---|---|---|---|---|
| A | 20228 | 18913 | 277 | 277 | 1.37% | 1.46% | 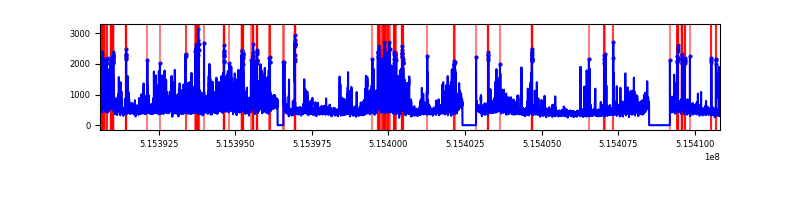 |
| B | 20229 | 18914 | 91 | 91 | 0.45% | 0.48% | 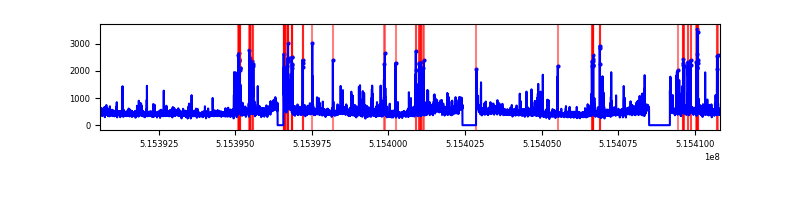 |
| C | 20229 | 18914 | 1181 | 1181 | 5.84% | 6.24% | 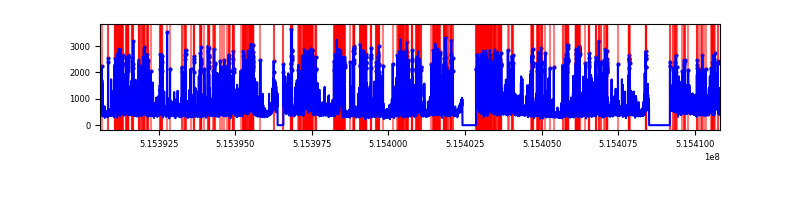 |
| D | 20229 | 18914 | 531 | 531 | 2.62% | 2.81% | 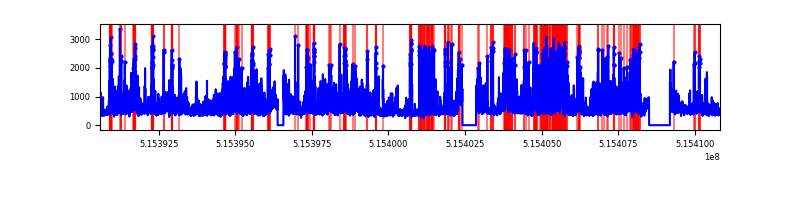 |
Top three noisy pixels from each quadrant. If the there are fewer than three noisy pixels in the level2.evt file, extra rows are filled as -1
| Pixel properties | Quadrant properties | ||||||
|---|---|---|---|---|---|---|---|
| Quadrant | DetID | PixID | Counts | Sigma | Mean | Median | Sigma |
| A | 0 | 12 | 3518494 | 6980.86 | 2044 | 1992 | 503.7 |
| A | 3 | 14 | 232521 | 457.64 | 2044 | 1992 | 503.7 |
| A | 10 | 251 | 176544 | 346.52 | 2044 | 1992 | 503.7 |
| B | 5 | 185 | 770106 | 1796.94 | 2011 | 1934 | 427.5 |
| B | 7 | 252 | 270930 | 629.25 | 2011 | 1934 | 427.5 |
| B | 10 | 16 | 267559 | 621.36 | 2011 | 1934 | 427.5 |
| C | 15 | 224 | 5267554 | 10094.9 | 1930 | 1910 | 521.6 |
| C | 14 | 254 | 458733 | 875.79 | 1930 | 1910 | 521.6 |
| C | 12 | 252 | 346799 | 661.19 | 1930 | 1910 | 521.6 |
| D | 3 | 224 | 3069569 | 5566.45 | 1969 | 1875 | 551.1 |
| D | 2 | 249 | 1272653 | 2305.88 | 1969 | 1875 | 551.1 |
| D | 8 | 240 | 875897 | 1585.95 | 1969 | 1875 | 551.1 |
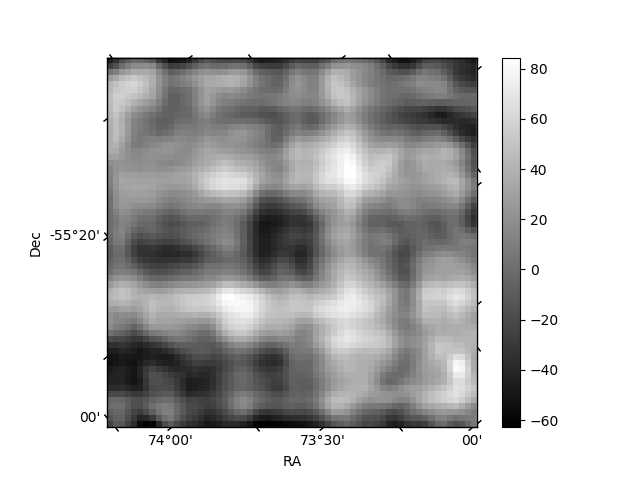
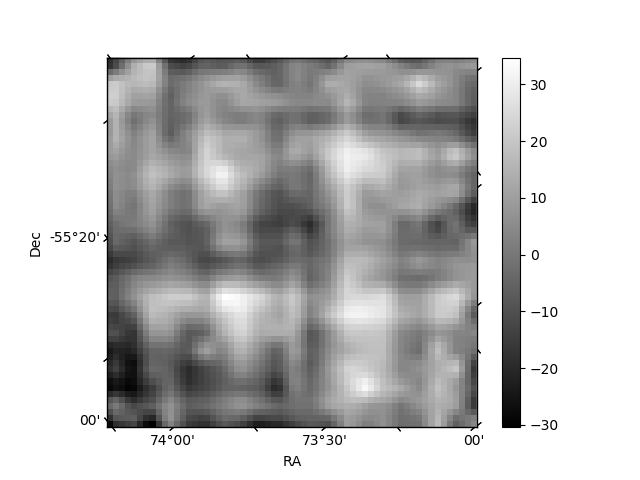
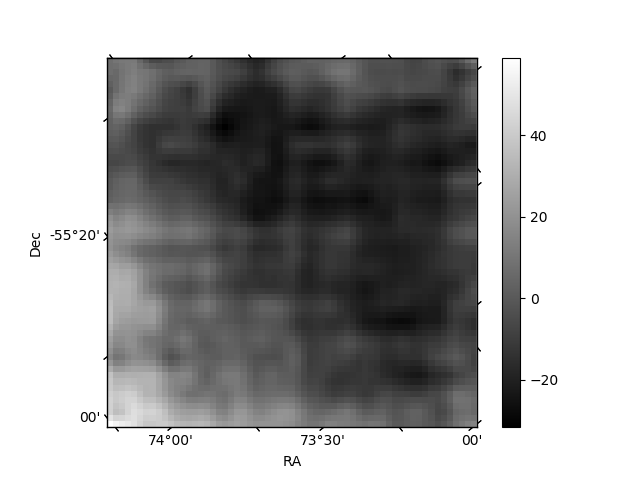
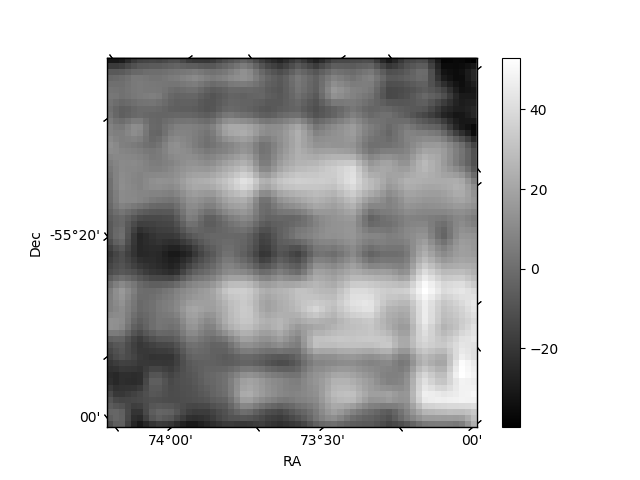
Histogram calculated using DETX and DETY for each event in the final _common_clean file
| Quadrant A | 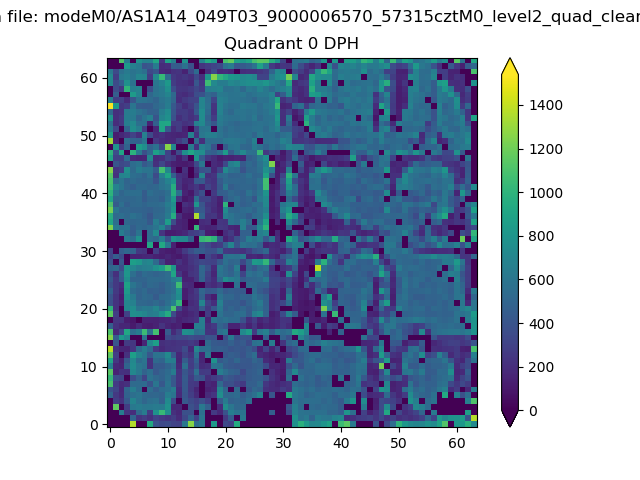 |
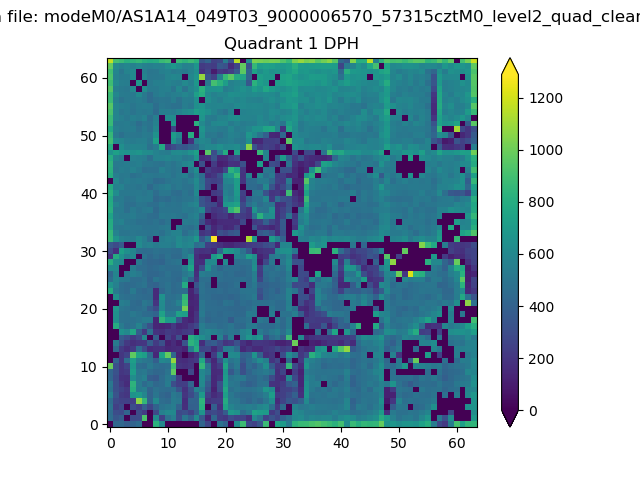 |
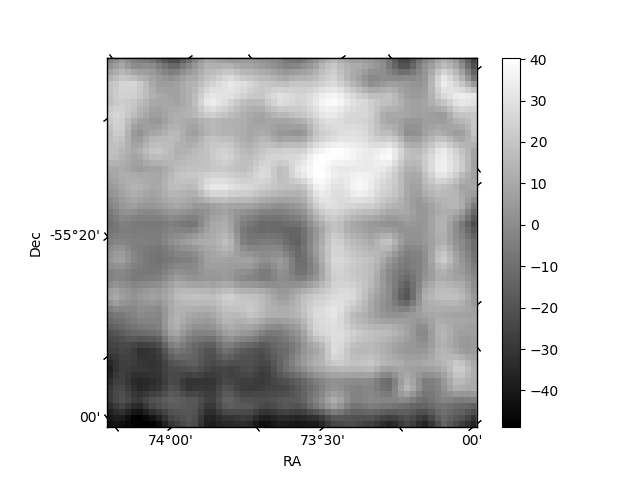
Quadrant B |
|---|---|---|---|
| Quadrant D | 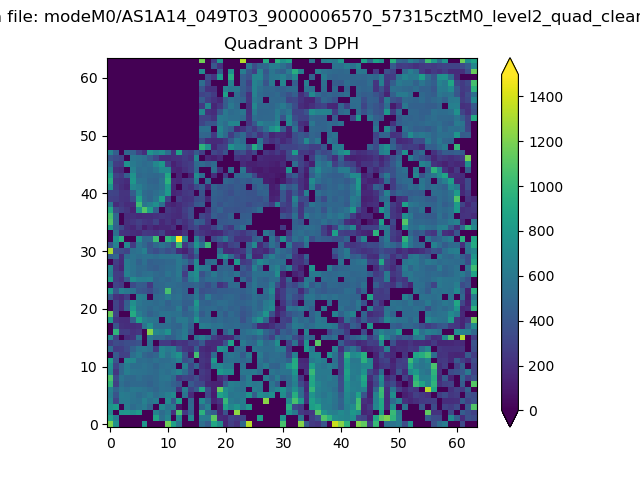 |
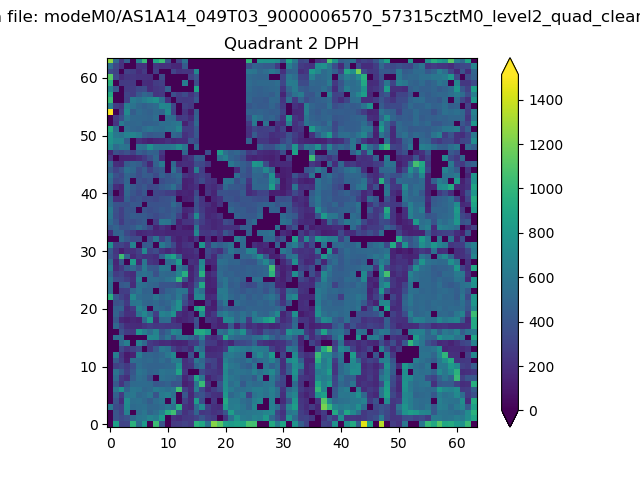 |
Quadrant C |
| Plot type | Count rate plots | Images |
|---|---|---|
| Comparison with Poisson distribution Blue bars denote a histogram of data divided into 1 sec bins. Red curve is a Poisson curve with rate = median count rate of data. |
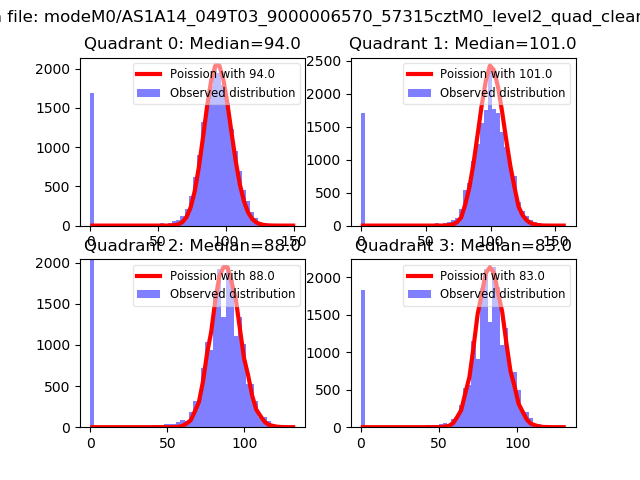 |
 |
| Quadrant-wise count rates Data is divided into 100 sec bins |
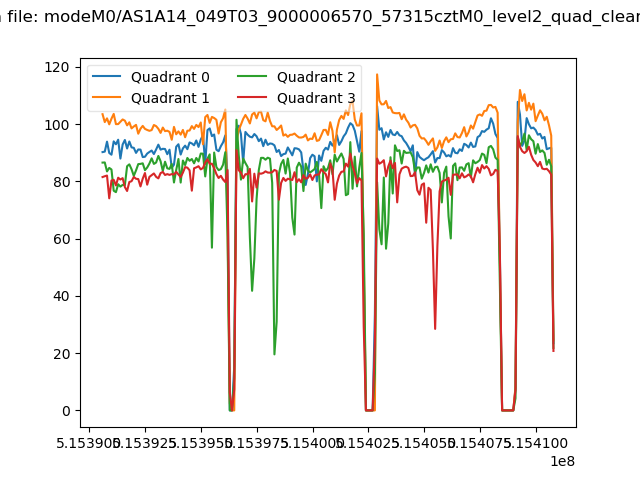 |
|
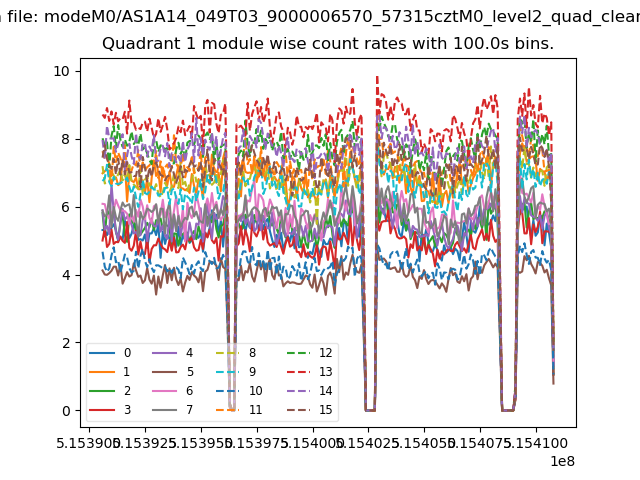
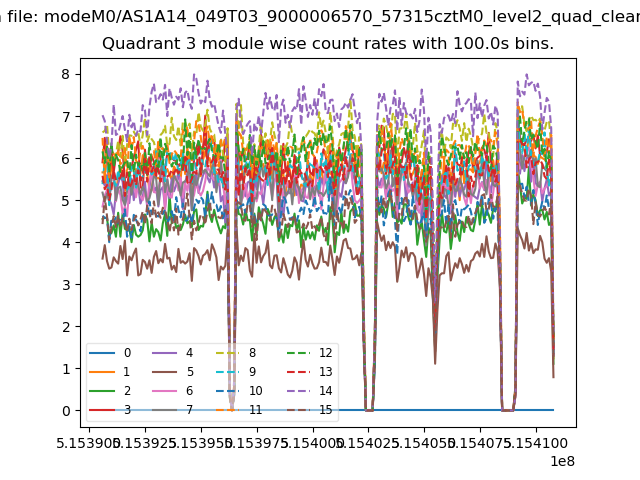
| Module-wise count rates for Quadrant A Data is divided into 100 sec bins |
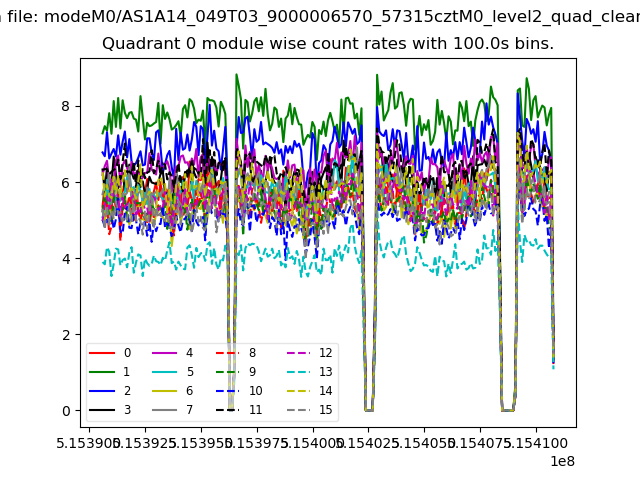 |
 |
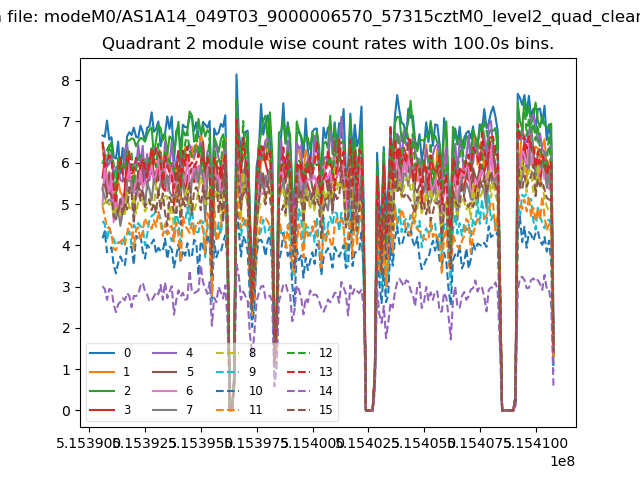
| Module-wise count rates for Quadrant B Data is divided into 100 sec bins |
 |
 |
| Module-wise count rates for Quadrant C Data is divided into 100 sec bins |
 |
 |
| Module-wise count rates for Quadrant D Data is divided into 100 sec bins |
 |
 |
| Parameter | Plot |
|---|---|
| CZT HV Monitor | 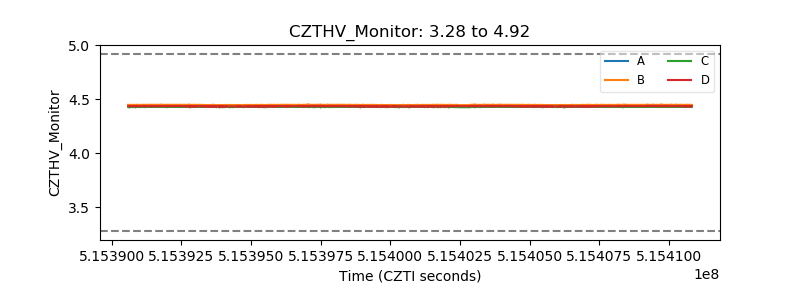 |
| D_VDD | 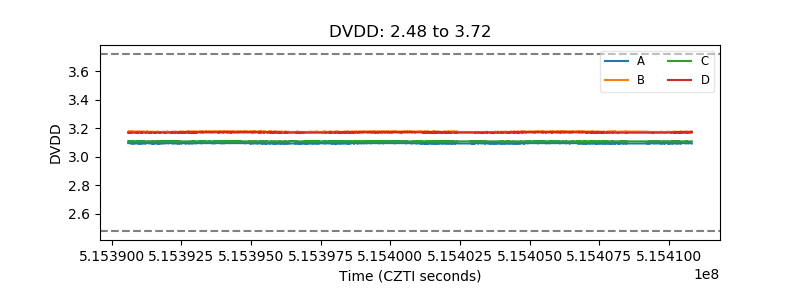 |
| Temperature 1 | 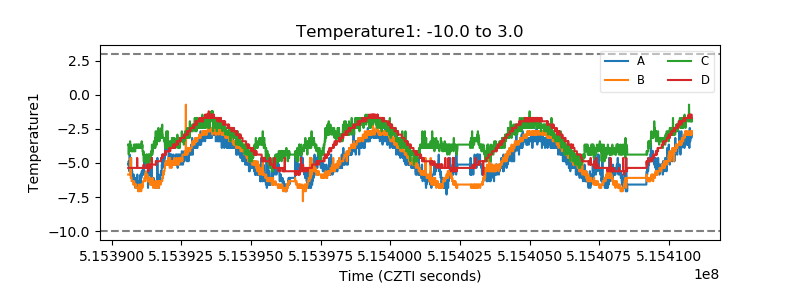 |
| Veto HV Monitor | 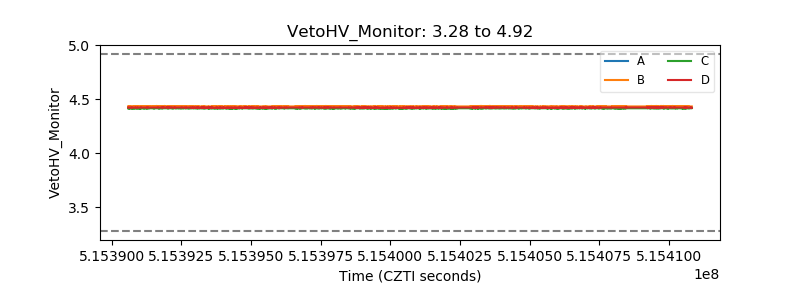 |
| Veto LLD | 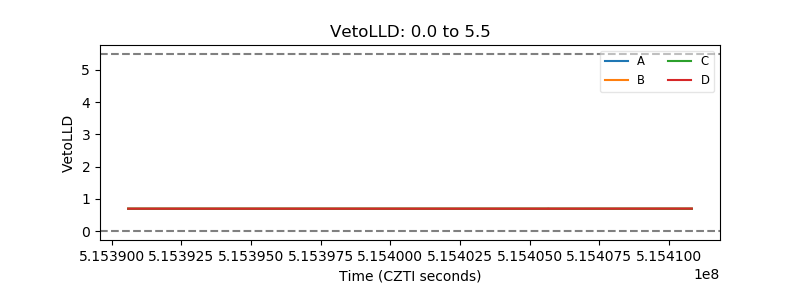 |
| Alpha Counter | 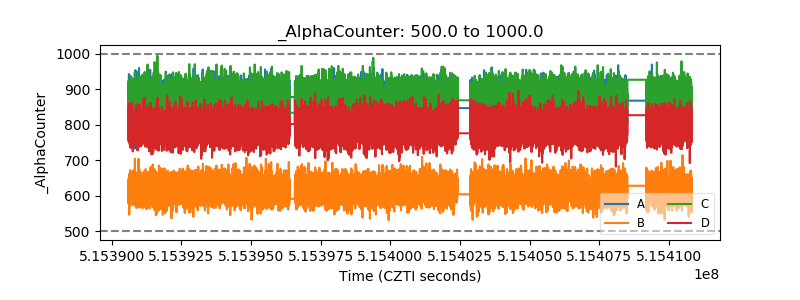 |
| _CPM_Rate | 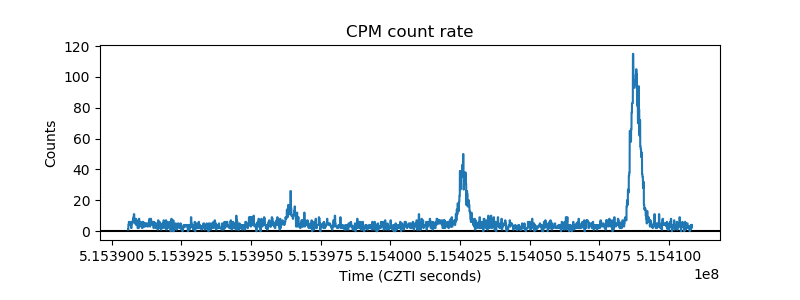 |
| CZT Counter | 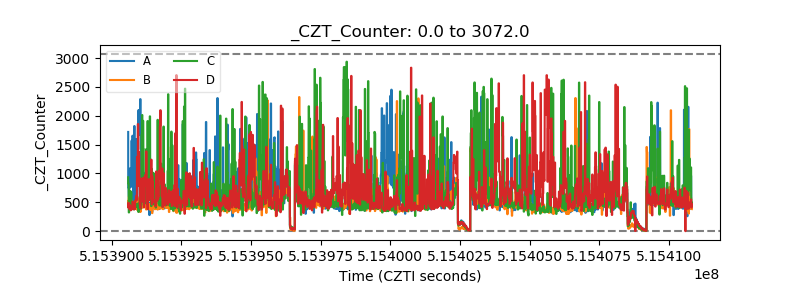 |
| +2.5 Volts monitor | 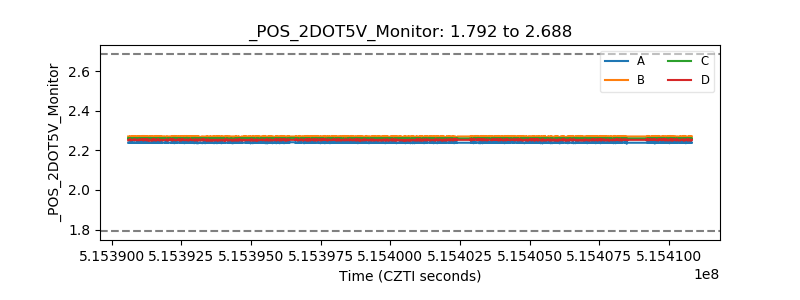 |
| +5 Volts monitor | 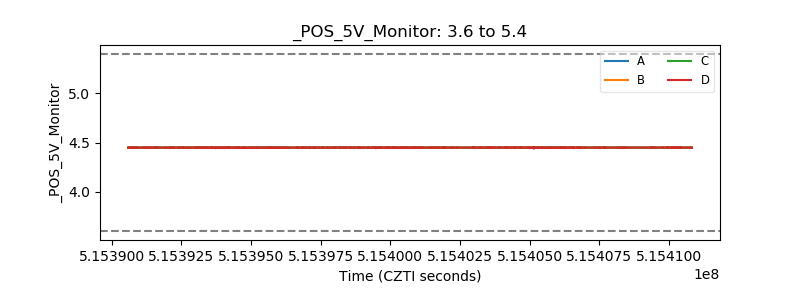 |
| _ROLL_ROT | 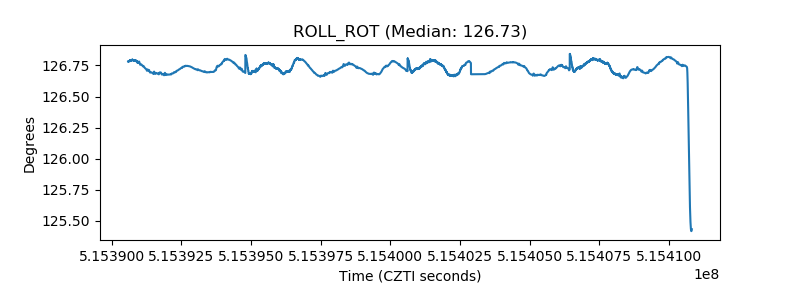 |
| _Roll_DEC | 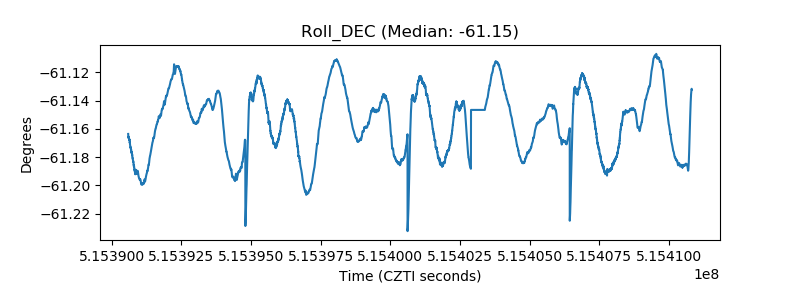 |
| _Roll_RA | 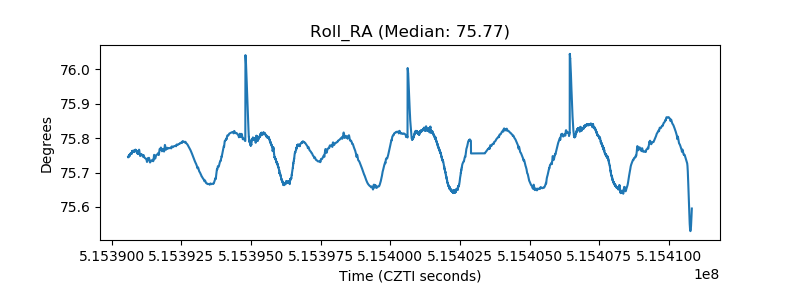 |
| Veto Counter | 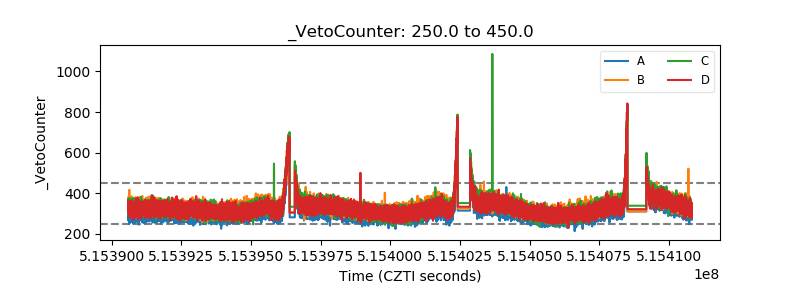 |