| Param | Original file | Final file |
|---|---|---|
| Filename | modeM0/AS1A14_049T03_9000006570_57316cztM0_level2.fits | modeM0/AS1A14_049T03_9000006570_57316cztM0_level2_quad_clean.evt |
| Size (bytes) | 451,330,560 | 97,384,320 |
| Size | 430.4 MB | 92.9 MB |
| Events in quadrant A | 3,177,055 | 639,055 |
| Events in quadrant B | 3,400,075 | 681,880 |
| Events in quadrant C | 5,098,987 | 593,876 |
| Events in quadrant D | 4,507,178 | 564,172 |
| Mode M0 | |||
|---|---|---|---|
| Quadrant | BADHDUFLAG | Total packets | Discarded packets |
| A | 0 | 14260 | 1 |
| B | 0 | 14762 | 1 |
| C | 0 | 19941 | 1 |
| D | 0 | 18018 | 1 |
| Mode M9 | |||
|---|---|---|---|
| Quadrant | BADHDUFLAG | Total packets | Discarded packets |
| A | 0 | 8 | 0 |
| B | 0 | 8 | 0 |
| C | 0 | 8 | 0 |
| D | 0 | 8 | 0 |
| Mode SS | |||
|---|---|---|---|
| Quadrant | BADHDUFLAG | Total packets | Discarded packets |
| A | 0 | 138 | 0 |
| B | 0 | 138 | 0 |
| C | 0 | 138 | 0 |
| D | 0 | 138 | 0 |
| Quadrant | Total seconds | Saturated seconds | Saturation percentage |
|---|---|---|---|
| A | 6733 | 103 | 1.529779% |
| B | 6734 | 144 | 2.138402% |
| C | 6734 | 370 | 5.494505% |
| D | 6734 | 340 | 5.049005% |
Noise dominated data is calculated using 1-second bins in cleaned event files. If a bin has >2000 counts, and if more than 50% of those come from <1% of pixels, then it is considered to be noise-dominated and hence unusable.
| Quadrant | # 1 sec bins | Bins with >0 counts | Bins with >2000 counts | High rate bins dominated by noise | Noise dominated (total time) | Noise dominated (detector-on time) | Marked lightcurve |
|---|---|---|---|---|---|---|---|
| A | 7578 | 6733 | 38 | 38 | 0.50% | 0.56% | 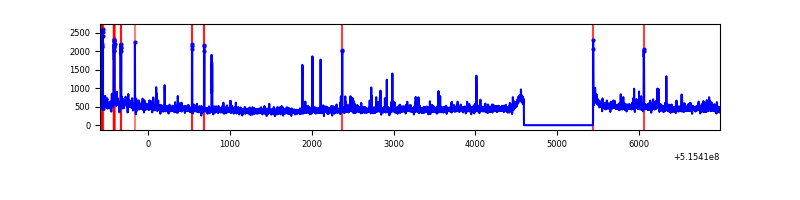 |
| B | 7579 | 6734 | 45 | 45 | 0.59% | 0.67% | 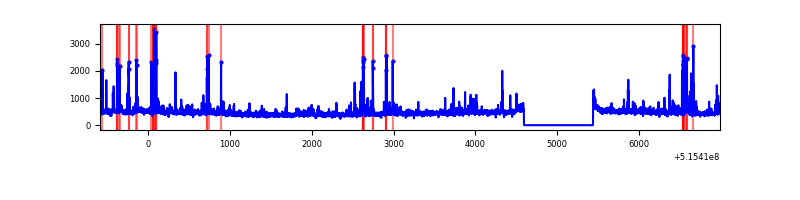 |
| C | 7579 | 6734 | 314 | 314 | 4.14% | 4.66% | 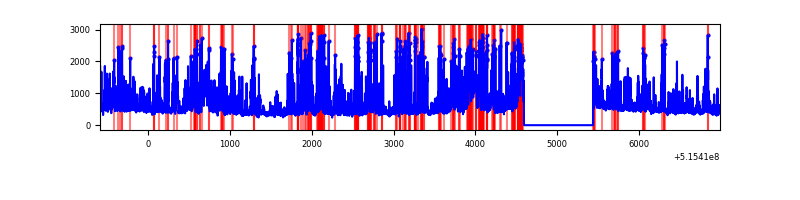 |
| D | 7579 | 6734 | 287 | 287 | 3.79% | 4.26% | 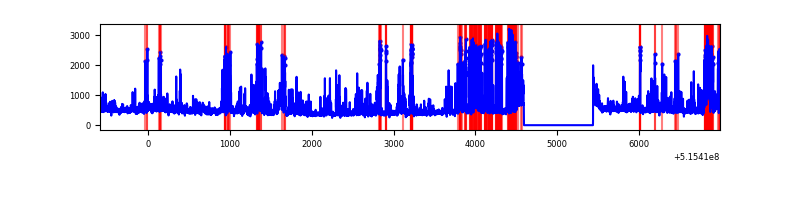 |
Top three noisy pixels from each quadrant. If the there are fewer than three noisy pixels in the level2.evt file, extra rows are filled as -1
| Pixel properties | Quadrant properties | ||||||
|---|---|---|---|---|---|---|---|
| Quadrant | DetID | PixID | Counts | Sigma | Mean | Median | Sigma |
| A | 0 | 12 | 193884 | 1059.62 | 739 | 720 | 182.3 |
| A | 3 | 14 | 99892 | 544.02 | 739 | 720 | 182.3 |
| A | 13 | 254 | 10053 | 51.2 | 739 | 720 | 182.3 |
| B | 5 | 185 | 211783 | 1353.63 | 721 | 694 | 155.9 |
| B | 10 | 16 | 123058 | 784.67 | 721 | 694 | 155.9 |
| B | 7 | 252 | 78933 | 501.72 | 721 | 694 | 155.9 |
| C | 15 | 224 | 1933919 | 10160.38 | 697 | 689 | 190.3 |
| C | 12 | 250 | 157974 | 826.63 | 697 | 689 | 190.3 |
| C | 6 | 223 | 94373 | 492.37 | 697 | 689 | 190.3 |
| D | 3 | 224 | 715027 | 3557.49 | 710 | 679 | 200.8 |
| D | 2 | 249 | 657017 | 3268.6 | 710 | 679 | 200.8 |
| D | 3 | 12 | 133528 | 661.59 | 710 | 679 | 200.8 |
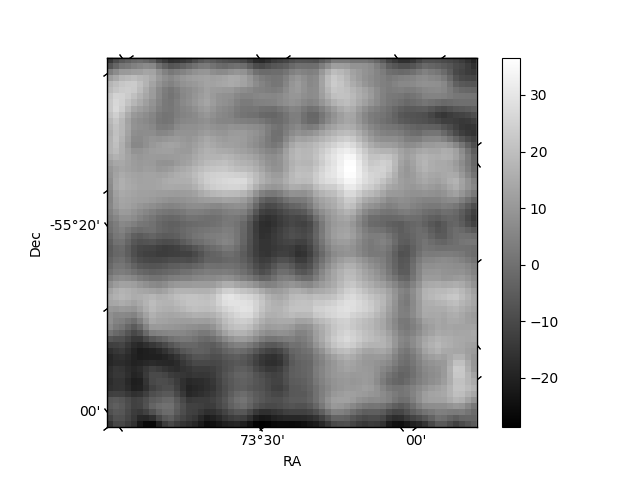
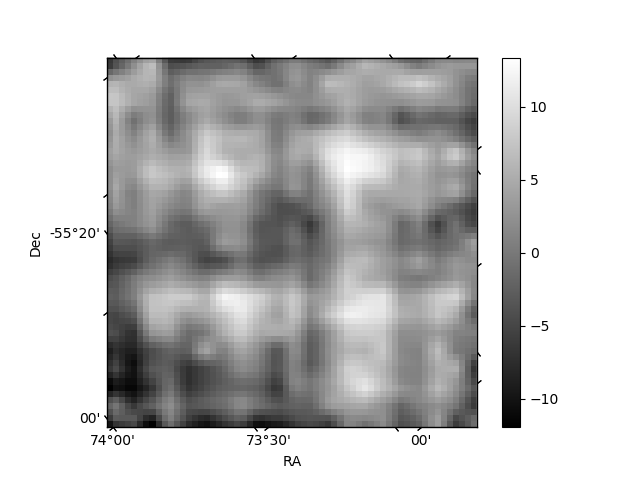
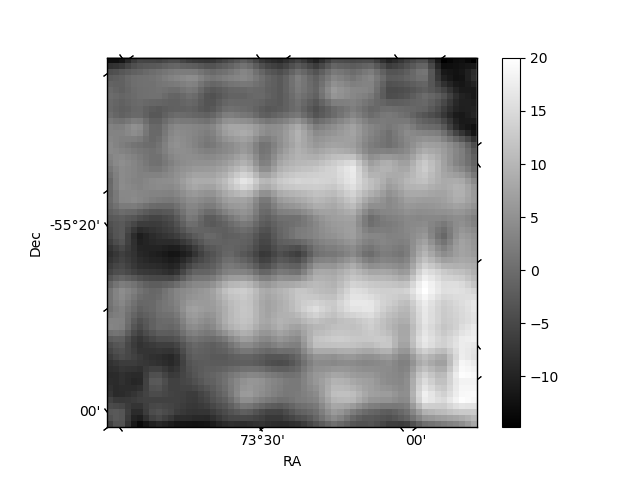
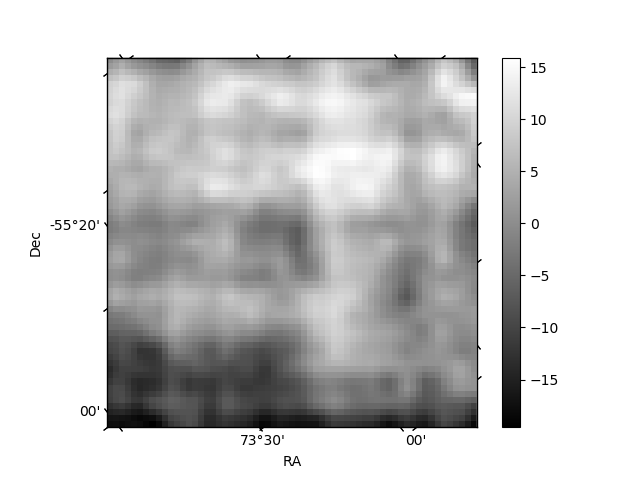
Histogram calculated using DETX and DETY for each event in the final _common_clean file
| Quadrant A | 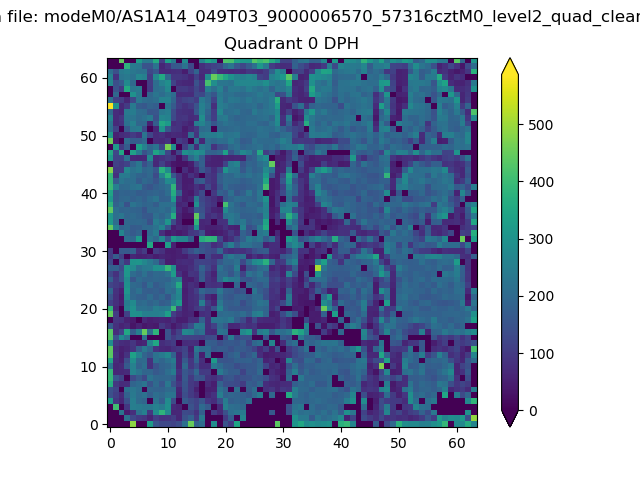 |
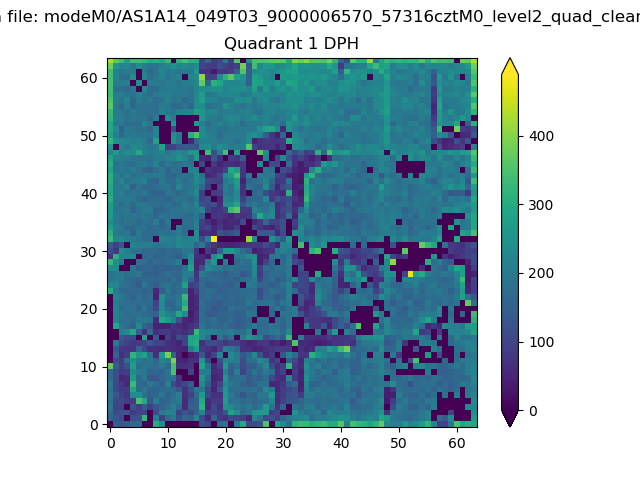 |
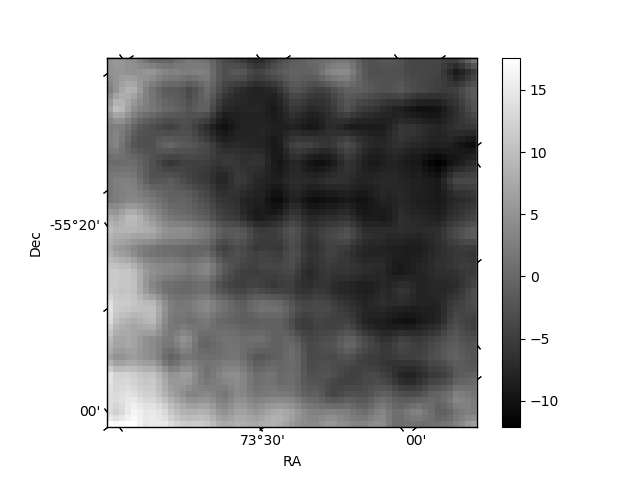
Quadrant B |
|---|---|---|---|
| Quadrant D | 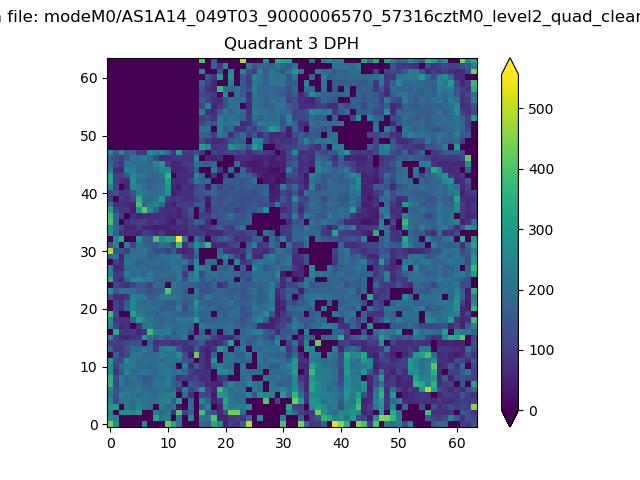 |
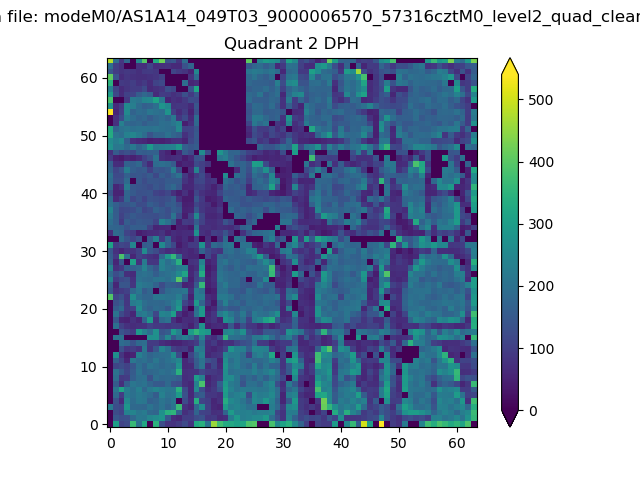 |
Quadrant C |
| Plot type | Count rate plots | Images |
|---|---|---|
| Comparison with Poisson distribution Blue bars denote a histogram of data divided into 1 sec bins. Red curve is a Poisson curve with rate = median count rate of data. |
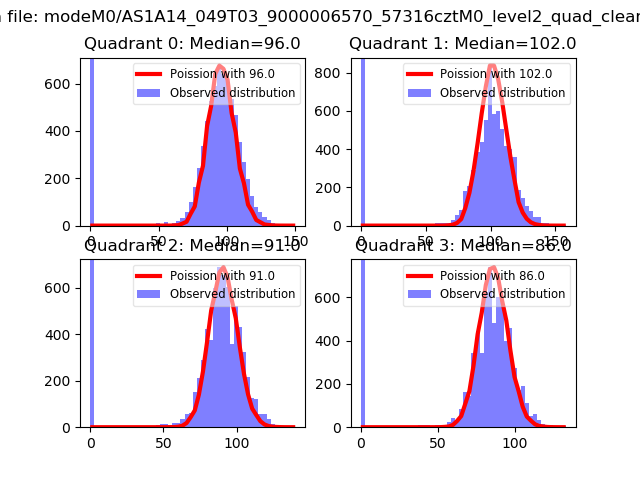 |
 |
| Quadrant-wise count rates Data is divided into 100 sec bins |
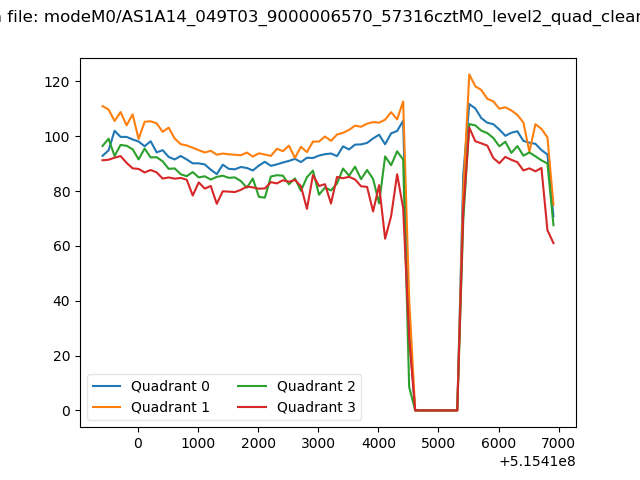 |
|
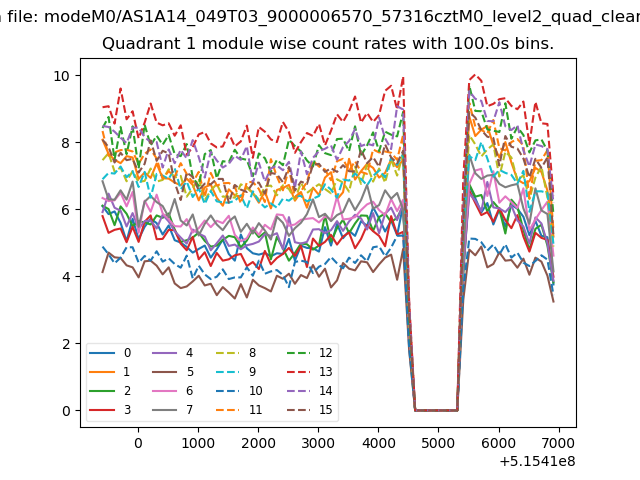
| Module-wise count rates for Quadrant A Data is divided into 100 sec bins |
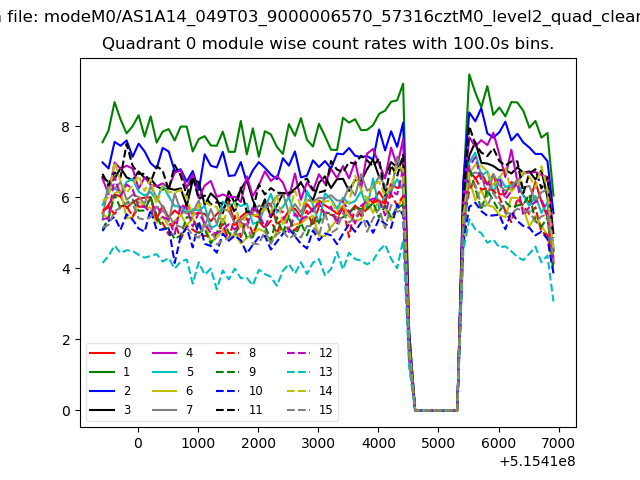 |
 |
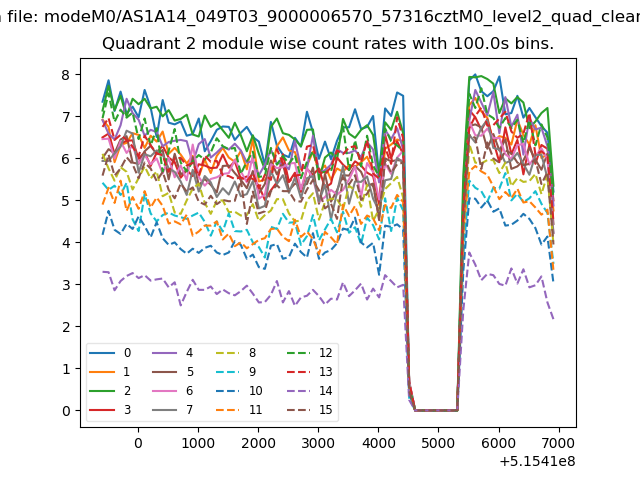
| Module-wise count rates for Quadrant B Data is divided into 100 sec bins |
 |
 |
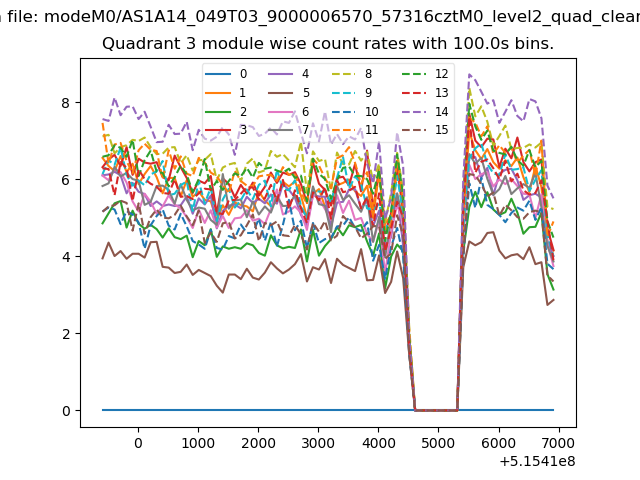
| Module-wise count rates for Quadrant C Data is divided into 100 sec bins |
 |
 |
| Module-wise count rates for Quadrant D Data is divided into 100 sec bins |
 |
 |
| Parameter | Plot |
|---|---|
| CZT HV Monitor | 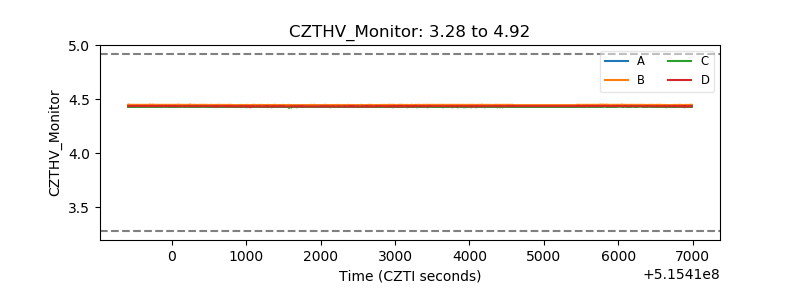 |
| D_VDD | 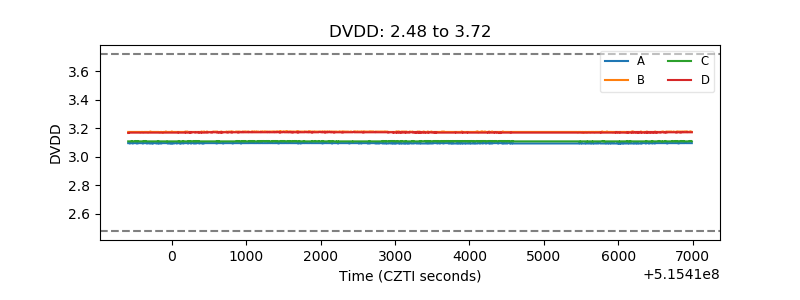 |
| Temperature 1 | 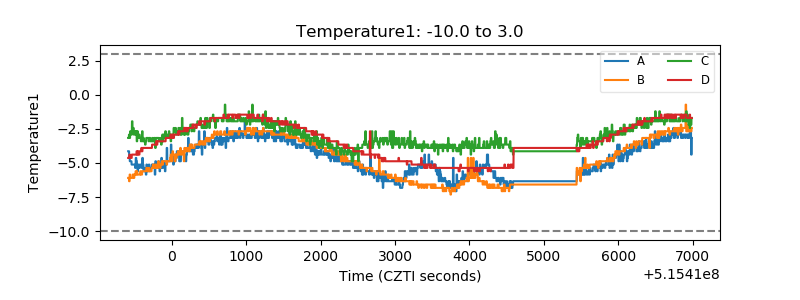 |
| Veto HV Monitor | 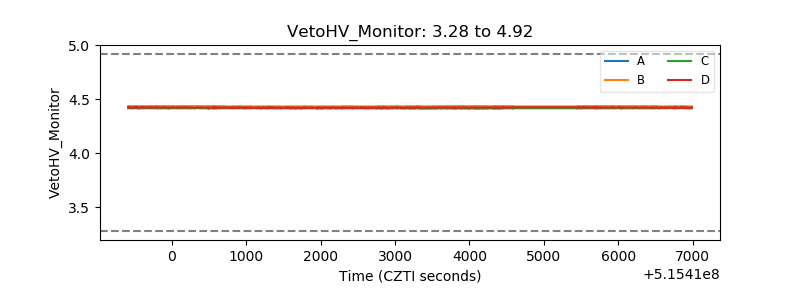 |
| Veto LLD | 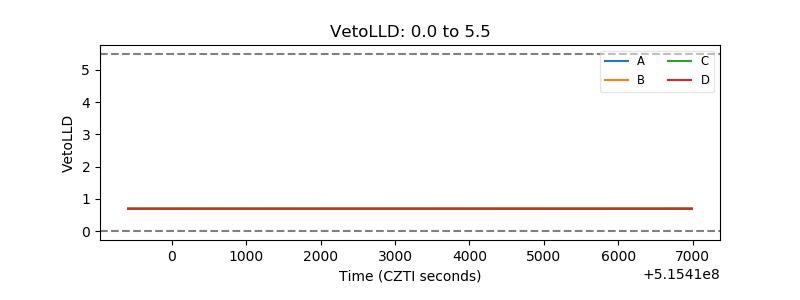 |
| Alpha Counter | 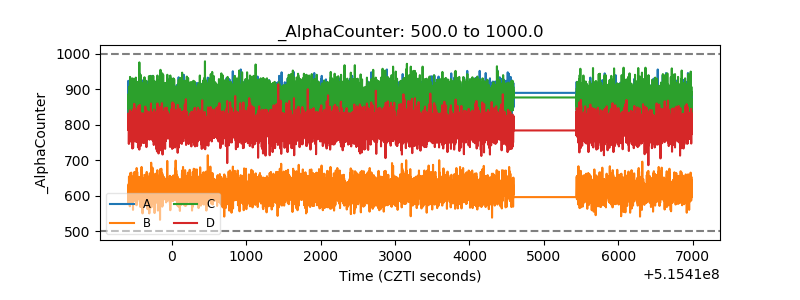 |
| _CPM_Rate | 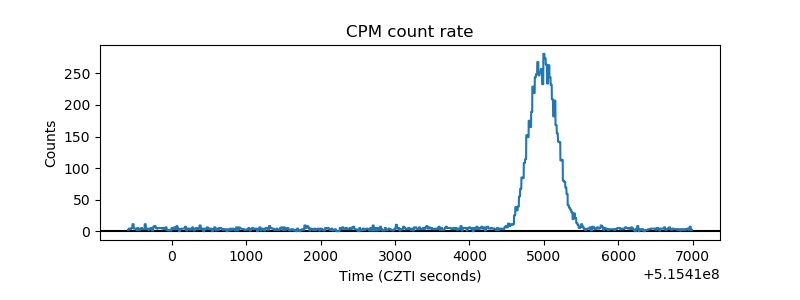 |
| CZT Counter | 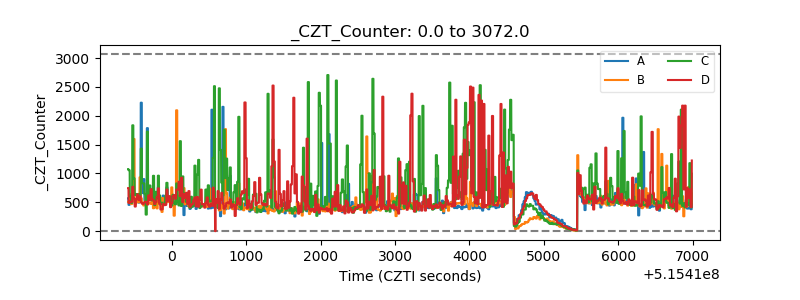 |
| +2.5 Volts monitor | 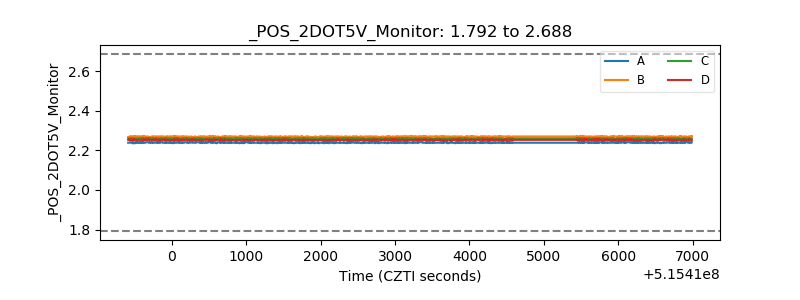 |
| +5 Volts monitor | 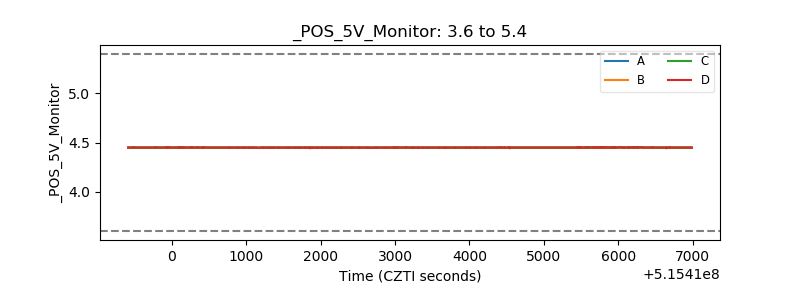 |
| _ROLL_ROT | 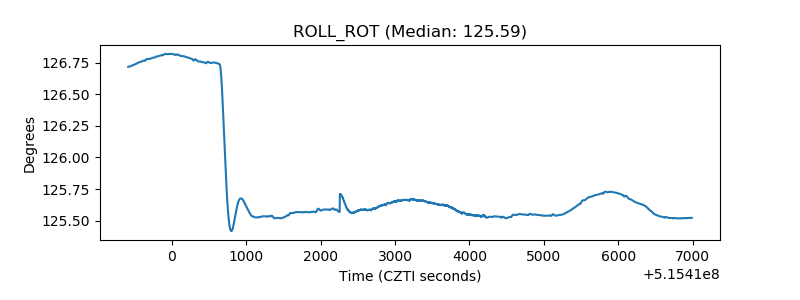 |
| _Roll_DEC | 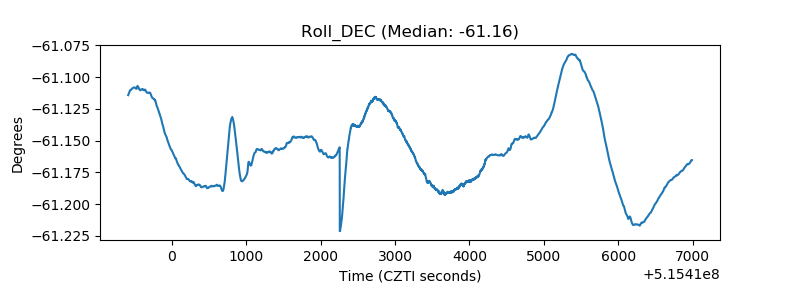 |
| _Roll_RA | 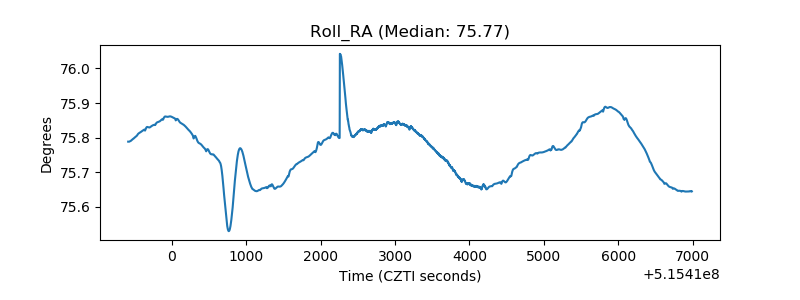 |
| Veto Counter | 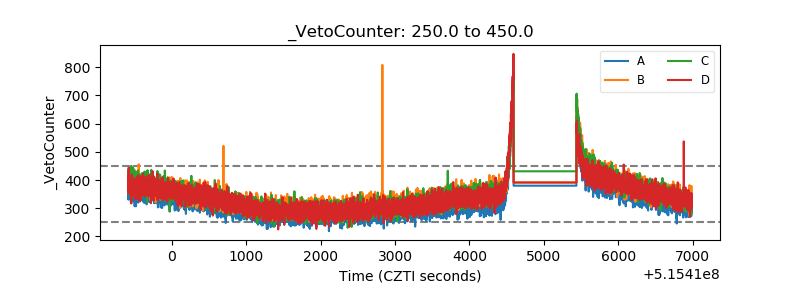 |