| Param | Original file | Final file |
|---|---|---|
| Filename | modeM0/AS1A14_049T03_9000006570_57318cztM0_level2.fits | modeM0/AS1A14_049T03_9000006570_57318cztM0_level2_quad_clean.evt |
| Size (bytes) | 415,175,040 | 88,349,760 |
| Size | 395.9 MB | 84.3 MB |
| Events in quadrant A | 3,420,803 | 578,538 |
| Events in quadrant B | 3,105,656 | 618,260 |
| Events in quadrant C | 4,062,583 | 536,575 |
| Events in quadrant D | 4,308,482 | 519,178 |
| Mode M0 | |||
|---|---|---|---|
| Quadrant | BADHDUFLAG | Total packets | Discarded packets |
| A | 0 | 14479 | 3 |
| B | 0 | 13453 | 1 |
| C | 0 | 16465 | 1 |
| D | 0 | 16975 | 1 |
| Mode M9 | |||
|---|---|---|---|
| Quadrant | BADHDUFLAG | Total packets | Discarded packets |
| A | 0 | 10 | 0 |
| B | 0 | 10 | 0 |
| C | 0 | 10 | 0 |
| D | 0 | 10 | 0 |
| Mode SS | |||
|---|---|---|---|
| Quadrant | BADHDUFLAG | Total packets | Discarded packets |
| A | 0 | 122 | 0 |
| B | 0 | 122 | 0 |
| C | 0 | 122 | 0 |
| D | 0 | 122 | 0 |
| Quadrant | Total seconds | Saturated seconds | Saturation percentage |
|---|---|---|---|
| A | 6055 | 131 | 2.163501% |
| B | 6055 | 131 | 2.163501% |
| C | 6055 | 300 | 4.954583% |
| D | 6056 | 214 | 3.533686% |
Noise dominated data is calculated using 1-second bins in cleaned event files. If a bin has >2000 counts, and if more than 50% of those come from <1% of pixels, then it is considered to be noise-dominated and hence unusable.
| Quadrant | # 1 sec bins | Bins with >0 counts | Bins with >2000 counts | High rate bins dominated by noise | Noise dominated (total time) | Noise dominated (detector-on time) | Marked lightcurve |
|---|---|---|---|---|---|---|---|
| A | 7045 | 6055 | 49 | 49 | 0.70% | 0.81% | 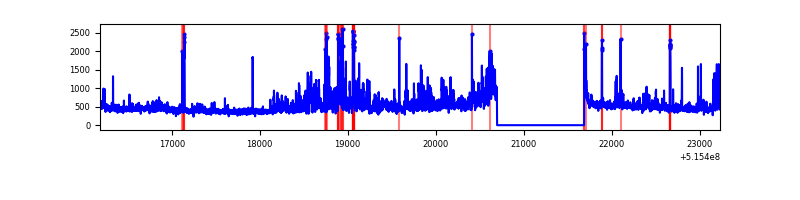 |
| B | 7045 | 6055 | 47 | 47 | 0.67% | 0.78% | 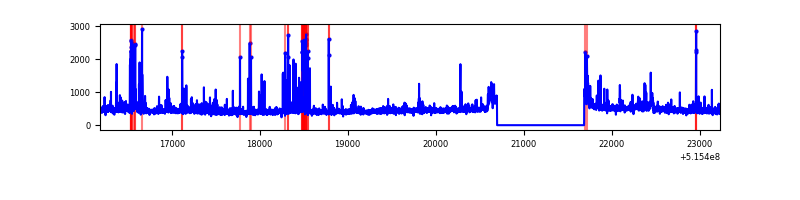 |
| C | 7045 | 6056 | 250 | 250 | 3.55% | 4.13% | 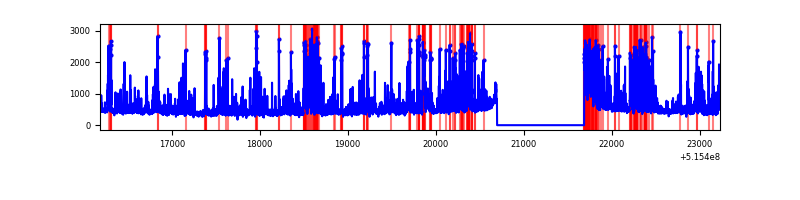 |
| D | 7046 | 6056 | 174 | 174 | 2.47% | 2.87% | 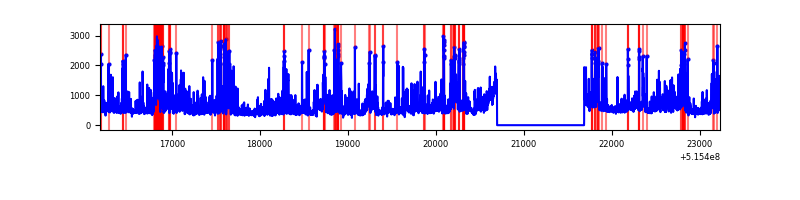 |
Top three noisy pixels from each quadrant. If the there are fewer than three noisy pixels in the level2.evt file, extra rows are filled as -1
| Pixel properties | Quadrant properties | ||||||
|---|---|---|---|---|---|---|---|
| Quadrant | DetID | PixID | Counts | Sigma | Mean | Median | Sigma |
| A | 0 | 12 | 743723 | 4611.4 | 656 | 640 | 161.1 |
| A | 3 | 14 | 57759 | 354.47 | 656 | 640 | 161.1 |
| A | 10 | 251 | 30606 | 185.96 | 656 | 640 | 161.1 |
| B | 7 | 252 | 134551 | 970.14 | 642 | 620 | 138.1 |
| B | 5 | 185 | 129798 | 935.71 | 642 | 620 | 138.1 |
| B | 0 | 171 | 64722 | 464.33 | 642 | 620 | 138.1 |
| C | 15 | 224 | 1410229 | 8308.61 | 621 | 615 | 169.7 |
| C | 14 | 254 | 76794 | 449.02 | 621 | 615 | 169.7 |
| C | 14 | 96 | 68473 | 399.97 | 621 | 615 | 169.7 |
| D | 3 | 224 | 1072585 | 5983.47 | 629 | 600 | 179.2 |
| D | 2 | 249 | 500788 | 2791.88 | 629 | 600 | 179.2 |
| D | 3 | 12 | 71149 | 393.78 | 629 | 600 | 179.2 |
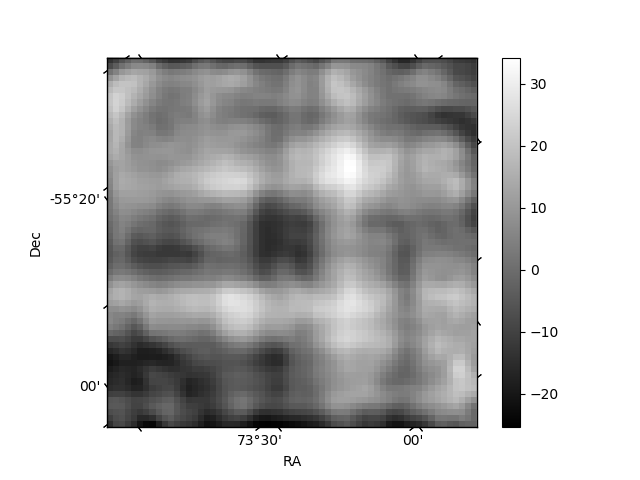
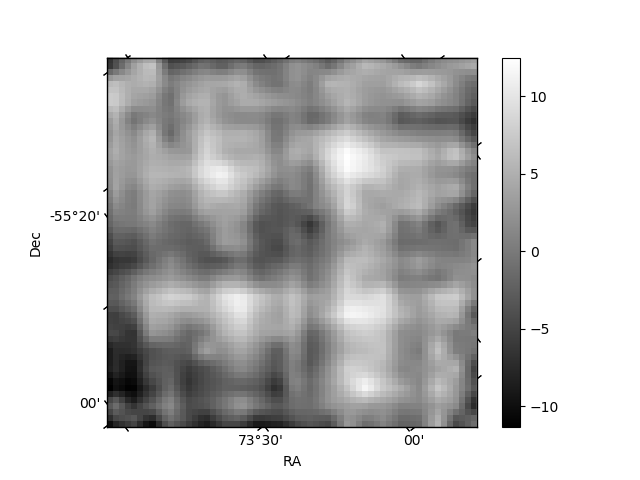
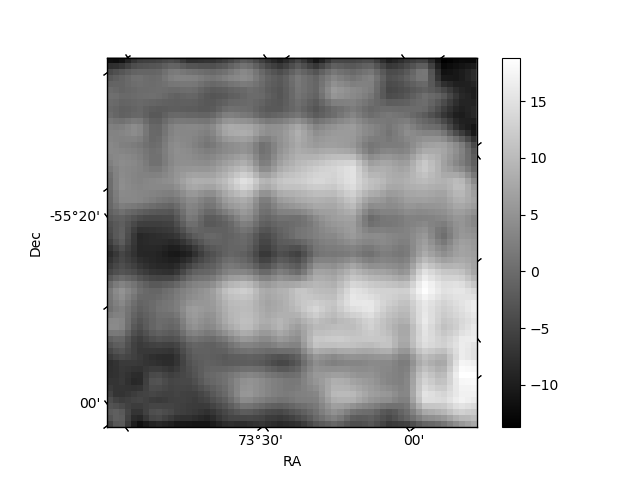
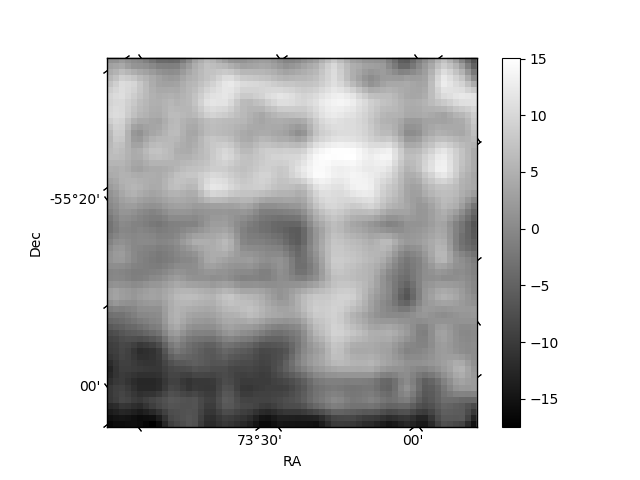
Histogram calculated using DETX and DETY for each event in the final _common_clean file
| Quadrant A | 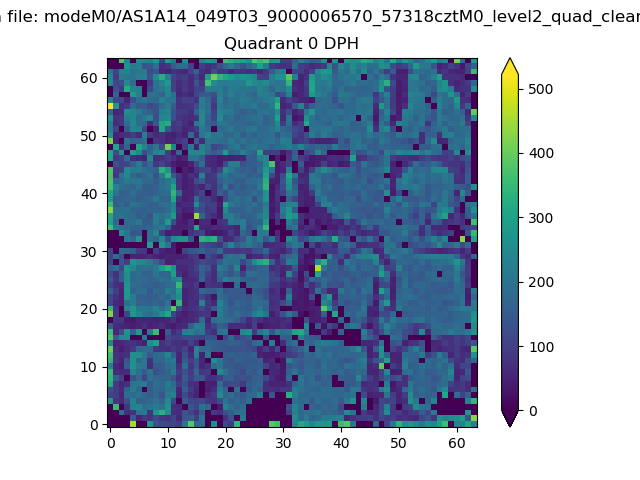 |
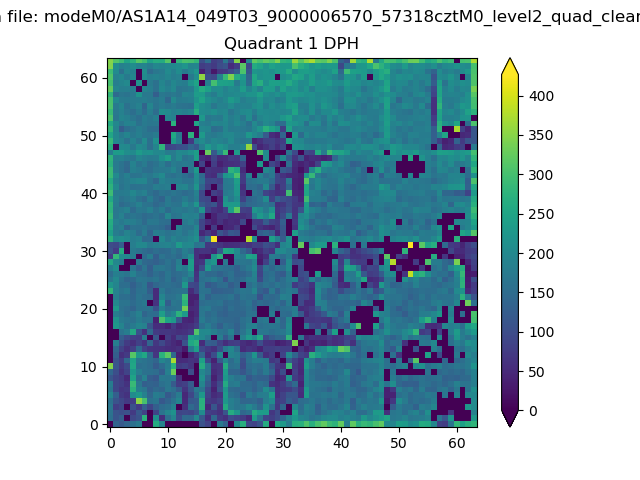 |
Quadrant B |
|---|---|---|---|
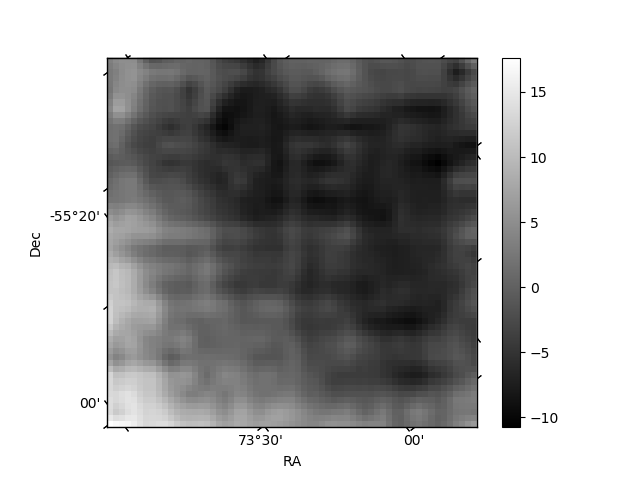
| Quadrant D | 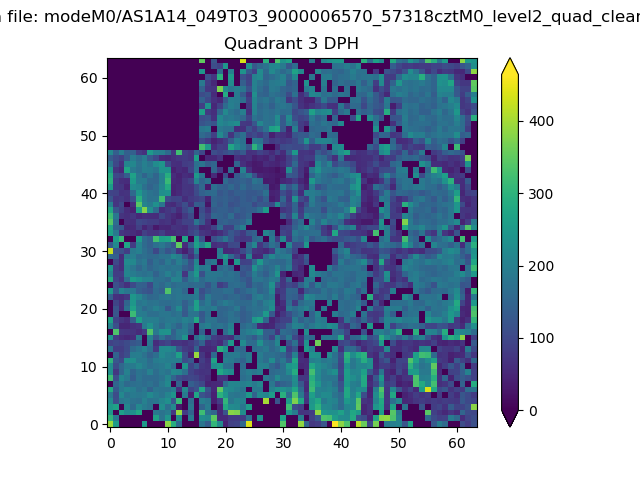 |
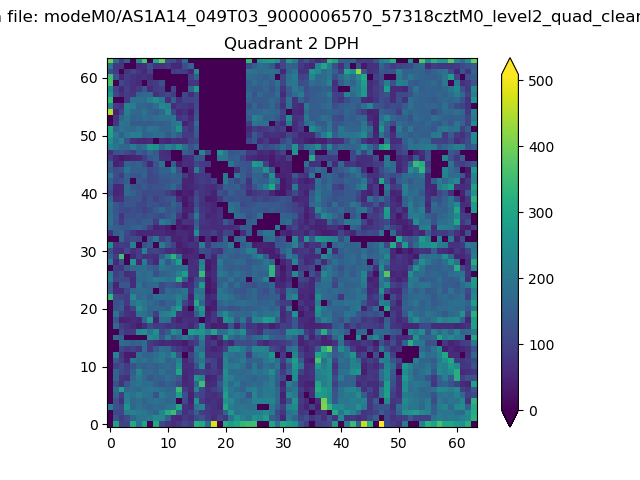 |
Quadrant C |
| Plot type | Count rate plots | Images |
|---|---|---|
| Comparison with Poisson distribution Blue bars denote a histogram of data divided into 1 sec bins. Red curve is a Poisson curve with rate = median count rate of data. |
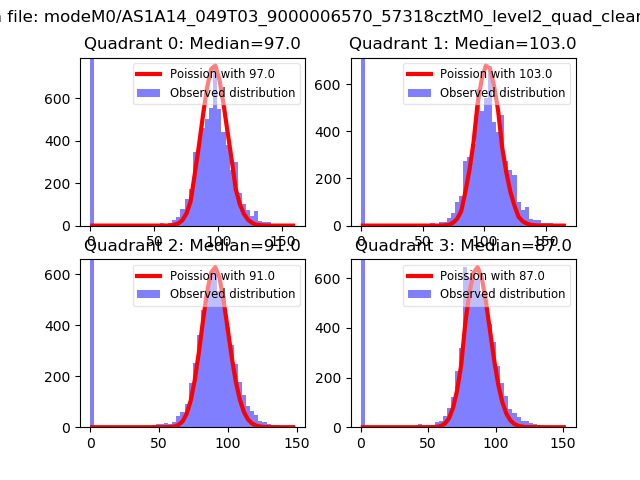 |
 |
| Quadrant-wise count rates Data is divided into 100 sec bins |
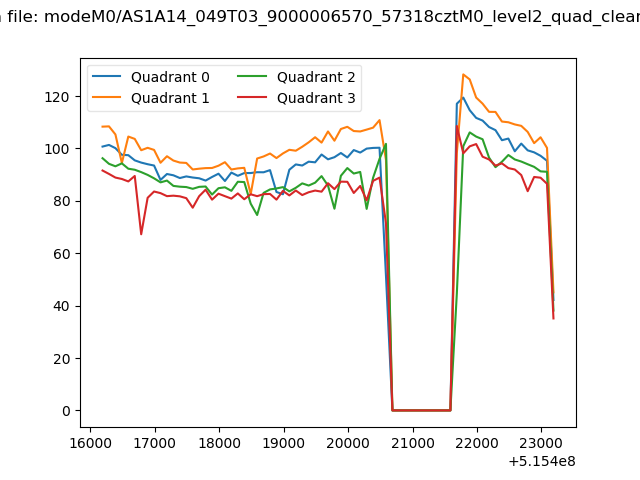 |
|
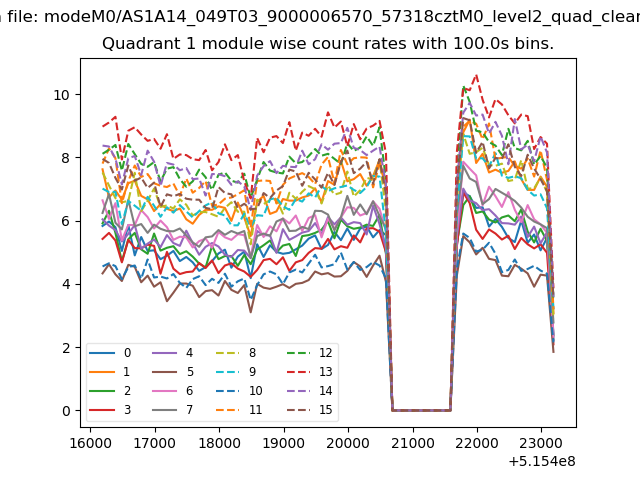
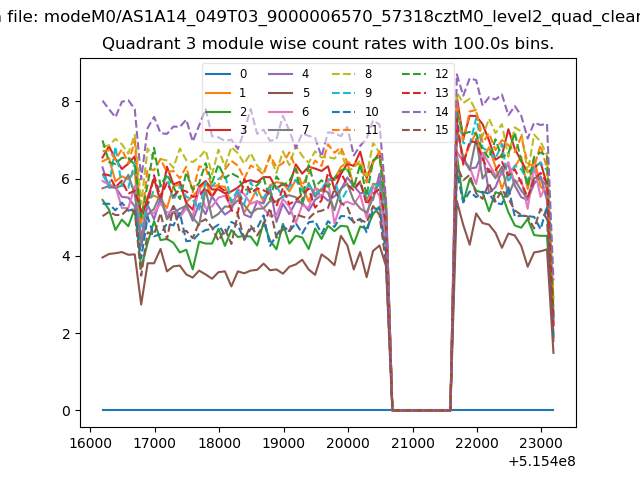
| Module-wise count rates for Quadrant A Data is divided into 100 sec bins |
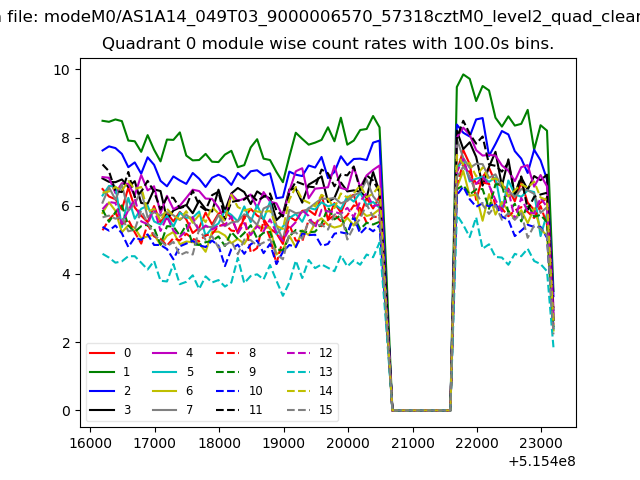 |
 |
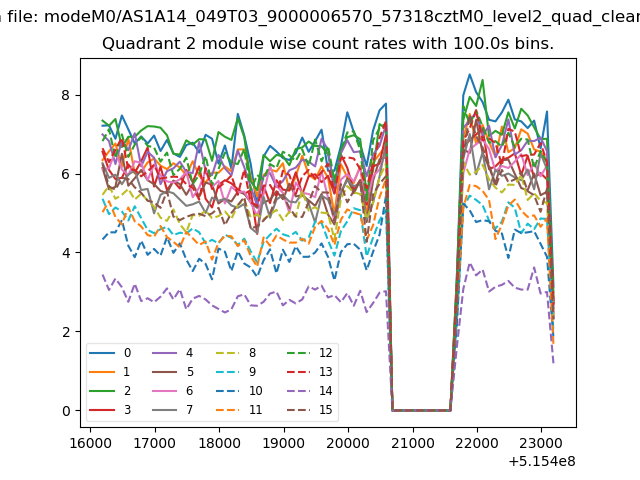
| Module-wise count rates for Quadrant B Data is divided into 100 sec bins |
 |
 |
| Module-wise count rates for Quadrant C Data is divided into 100 sec bins |
 |
 |
| Module-wise count rates for Quadrant D Data is divided into 100 sec bins |
 |
 |
| Parameter | Plot |
|---|---|
| CZT HV Monitor | 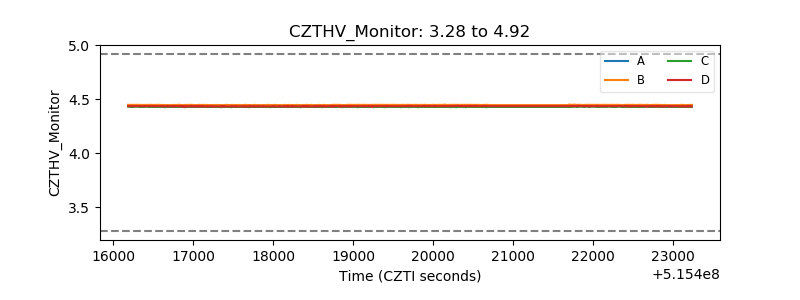 |
| D_VDD | 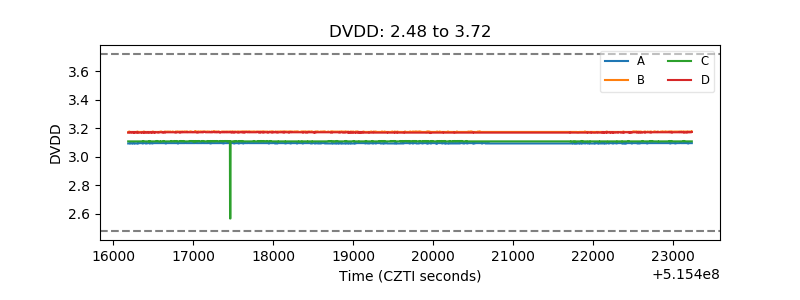 |
| Temperature 1 | 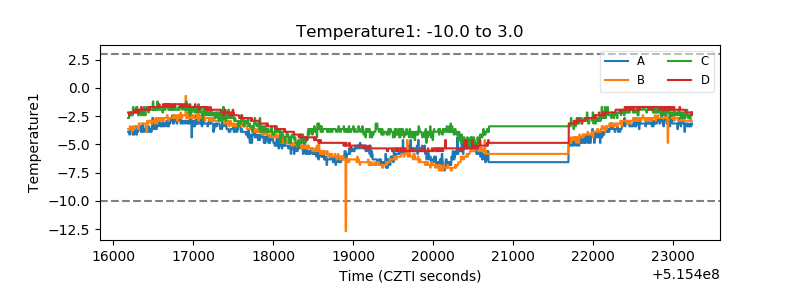 |
| Veto HV Monitor | 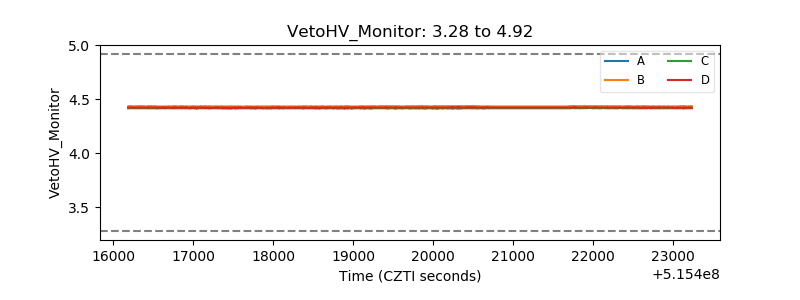 |
| Veto LLD | 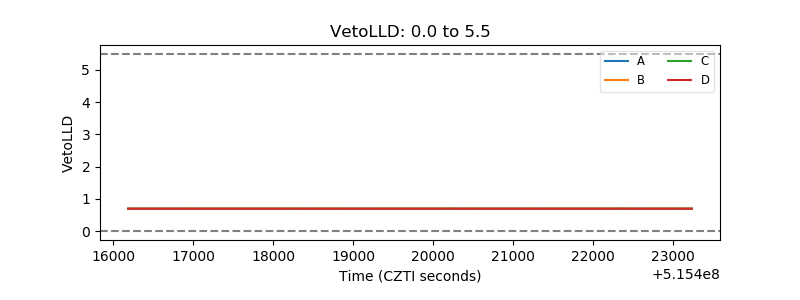 |
| Alpha Counter | 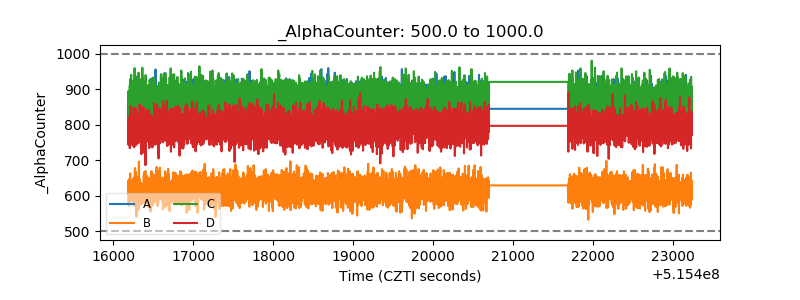 |
| _CPM_Rate | 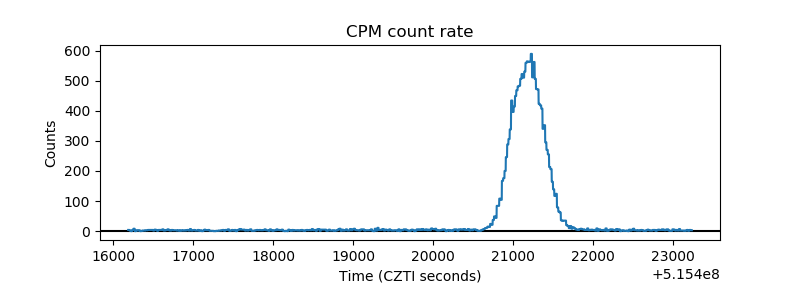 |
| CZT Counter | 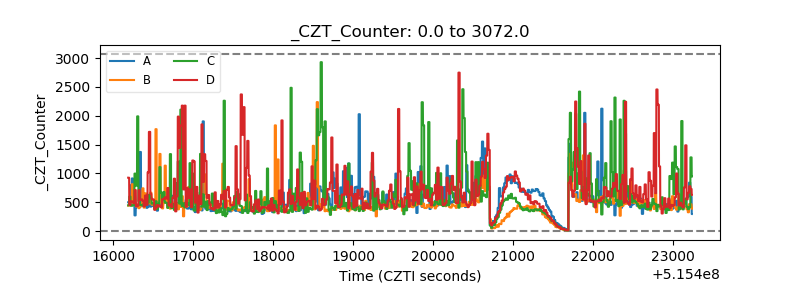 |
| +2.5 Volts monitor | 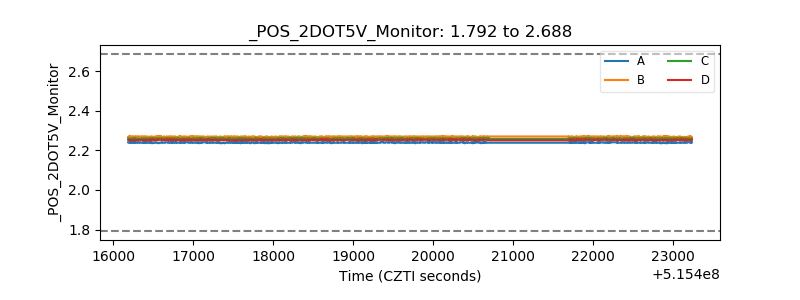 |
| +5 Volts monitor | 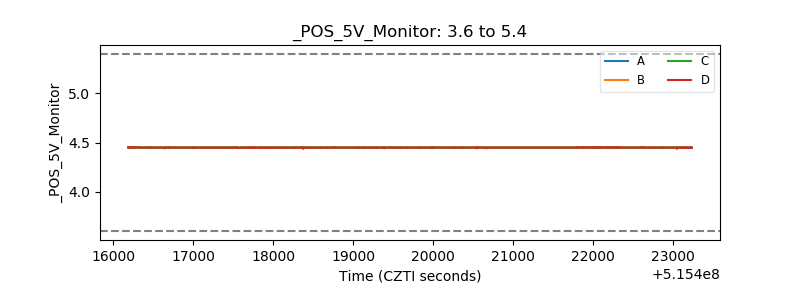 |
| _ROLL_ROT | 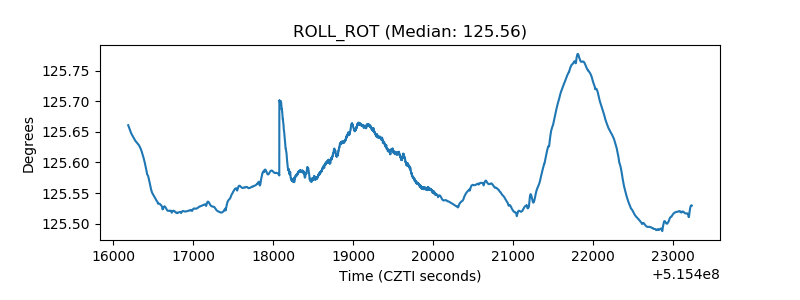 |
| _Roll_DEC | 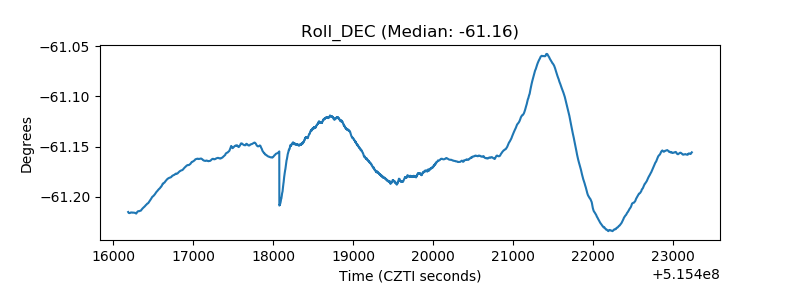 |
| _Roll_RA | 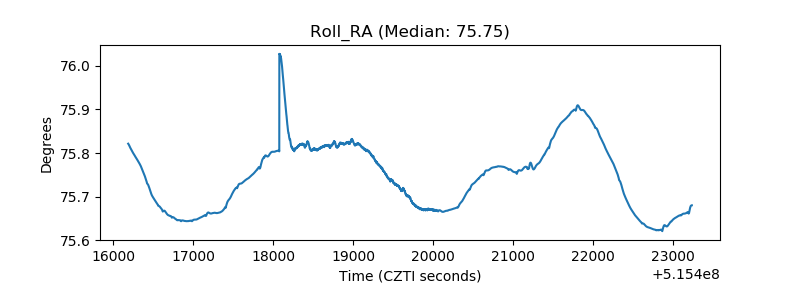 |
| Veto Counter | 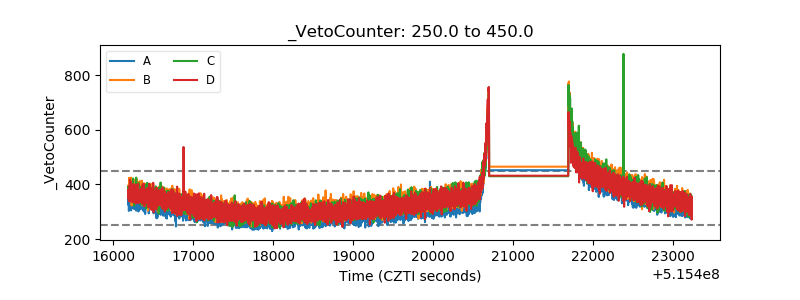 |