| Param | Original file | Final file |
|---|---|---|
| Filename | modeM0/AS1A14_049T03_9000006570_57319cztM0_level2.fits | modeM0/AS1A14_049T03_9000006570_57319cztM0_level2_quad_clean.evt |
| Size (bytes) | 436,455,360 | 91,082,880 |
| Size | 416.2 MB | 86.9 MB |
| Events in quadrant A | 3,191,733 | 609,351 |
| Events in quadrant B | 3,946,828 | 628,473 |
| Events in quadrant C | 4,357,188 | 556,269 |
| Events in quadrant D | 4,184,620 | 535,998 |
| Mode M0 | |||
|---|---|---|---|
| Quadrant | BADHDUFLAG | Total packets | Discarded packets |
| A | 0 | 13777 | 1 |
| B | 0 | 15935 | 1 |
| C | 0 | 17387 | 1 |
| D | 0 | 16649 | 1 |
| Mode M9 | |||
|---|---|---|---|
| Quadrant | BADHDUFLAG | Total packets | Discarded packets |
| A | 0 | 11 | 0 |
| B | 0 | 11 | 0 |
| C | 0 | 11 | 0 |
| D | 0 | 11 | 0 |
| Mode SS | |||
|---|---|---|---|
| Quadrant | BADHDUFLAG | Total packets | Discarded packets |
| A | 0 | 126 | 0 |
| B | 0 | 126 | 0 |
| C | 0 | 126 | 0 |
| D | 0 | 126 | 0 |
| Quadrant | Total seconds | Saturated seconds | Saturation percentage |
|---|---|---|---|
| A | 6123 | 53 | 0.865589% |
| B | 6123 | 294 | 4.801568% |
| C | 6123 | 327 | 5.340519% |
| D | 6123 | 210 | 3.429691% |
Noise dominated data is calculated using 1-second bins in cleaned event files. If a bin has >2000 counts, and if more than 50% of those come from <1% of pixels, then it is considered to be noise-dominated and hence unusable.
| Quadrant | # 1 sec bins | Bins with >0 counts | Bins with >2000 counts | High rate bins dominated by noise | Noise dominated (total time) | Noise dominated (detector-on time) | Marked lightcurve |
|---|---|---|---|---|---|---|---|
| A | 7248 | 6123 | 17 | 17 | 0.23% | 0.28% | 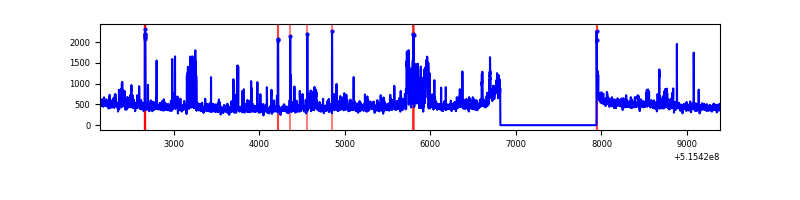 |
| B | 7248 | 6123 | 206 | 206 | 2.84% | 3.36% | 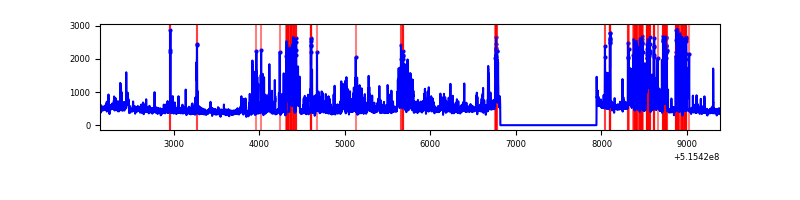 |
| C | 7247 | 6122 | 301 | 301 | 4.15% | 4.92% | 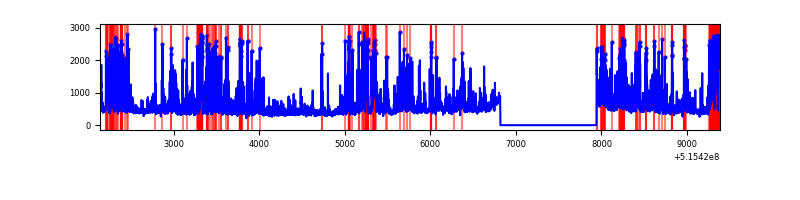 |
| D | 7248 | 6123 | 171 | 171 | 2.36% | 2.79% | 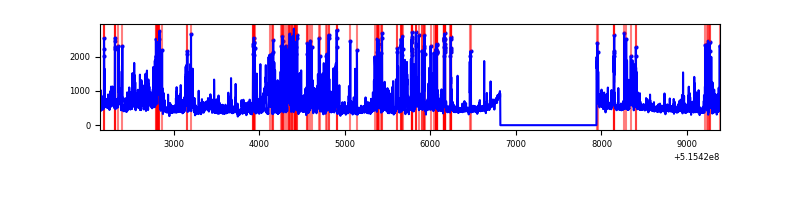 |
Top three noisy pixels from each quadrant. If the there are fewer than three noisy pixels in the level2.evt file, extra rows are filled as -1
| Pixel properties | Quadrant properties | ||||||
|---|---|---|---|---|---|---|---|
| Quadrant | DetID | PixID | Counts | Sigma | Mean | Median | Sigma |
| A | 0 | 12 | 451424 | 2682.11 | 676 | 659 | 168.1 |
| A | 3 | 14 | 77932 | 459.78 | 676 | 659 | 168.1 |
| A | 8 | 4 | 12107 | 68.12 | 676 | 659 | 168.1 |
| B | 2 | 249 | 570346 | 4121.62 | 650 | 628 | 138.2 |
| B | 10 | 16 | 341676 | 2467.31 | 650 | 628 | 138.2 |
| B | 1 | 223 | 163031 | 1174.9 | 650 | 628 | 138.2 |
| C | 15 | 224 | 1760755 | 10234.42 | 630 | 626 | 172.0 |
| C | 1 | 12 | 44506 | 255.14 | 630 | 626 | 172.0 |
| C | 14 | 254 | 34194 | 195.18 | 630 | 626 | 172.0 |
| D | 3 | 224 | 834032 | 4584.79 | 639 | 608 | 181.8 |
| D | 2 | 249 | 457490 | 2513.38 | 639 | 608 | 181.8 |
| D | 3 | 12 | 112670 | 616.47 | 639 | 608 | 181.8 |
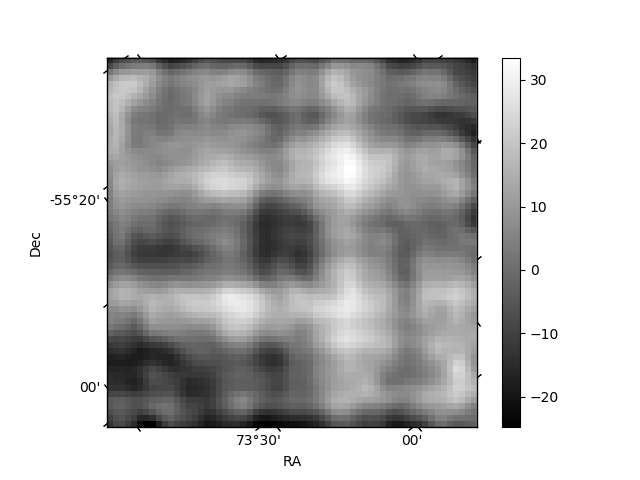
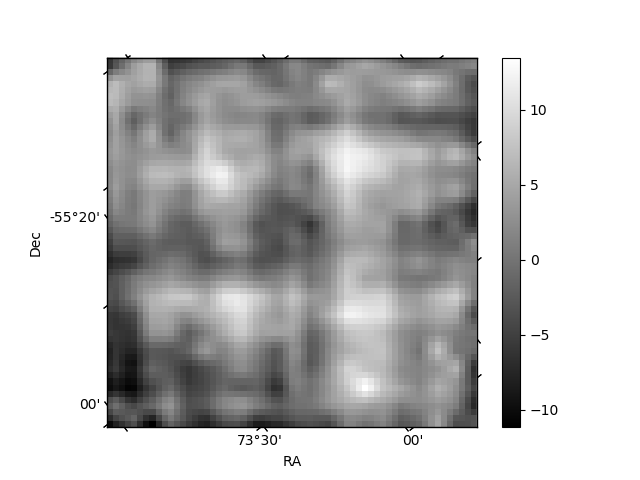
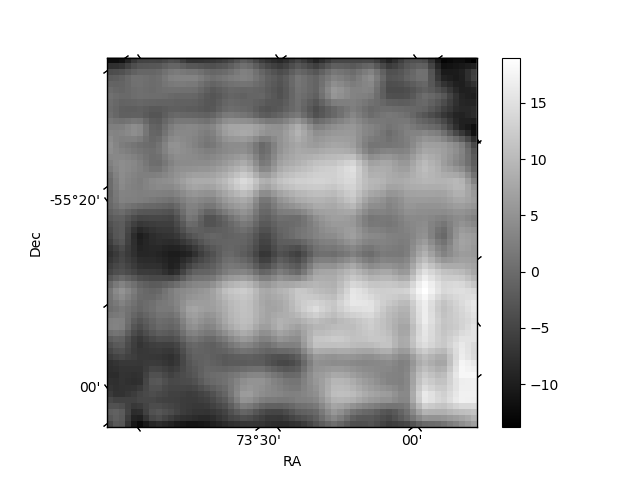
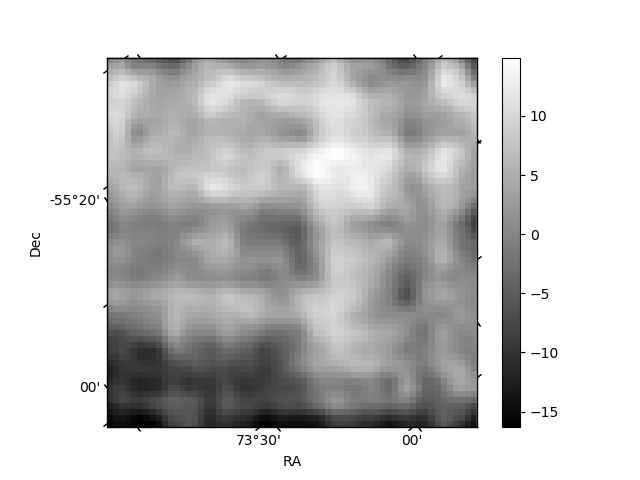
Histogram calculated using DETX and DETY for each event in the final _common_clean file
| Quadrant A | 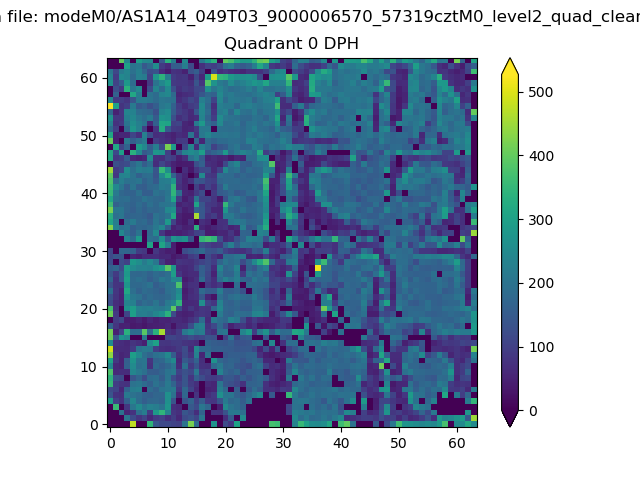 |
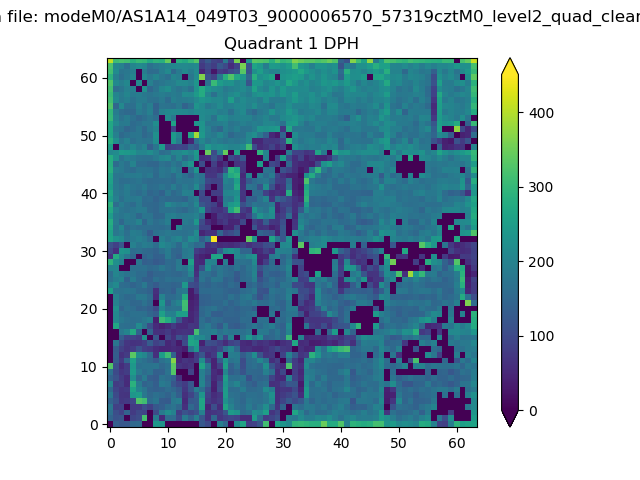 |
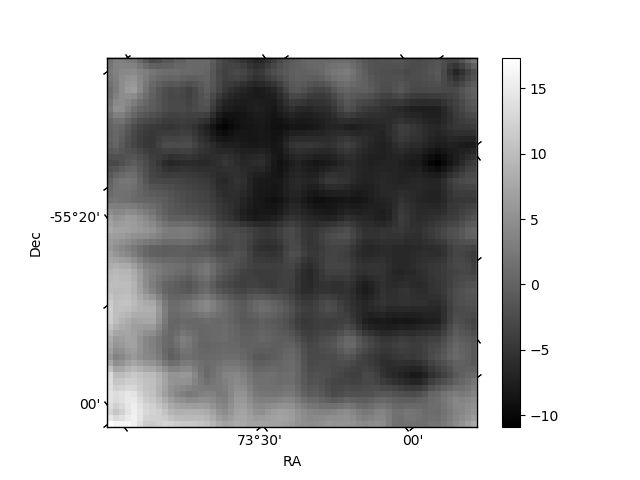
Quadrant B |
|---|---|---|---|
| Quadrant D | 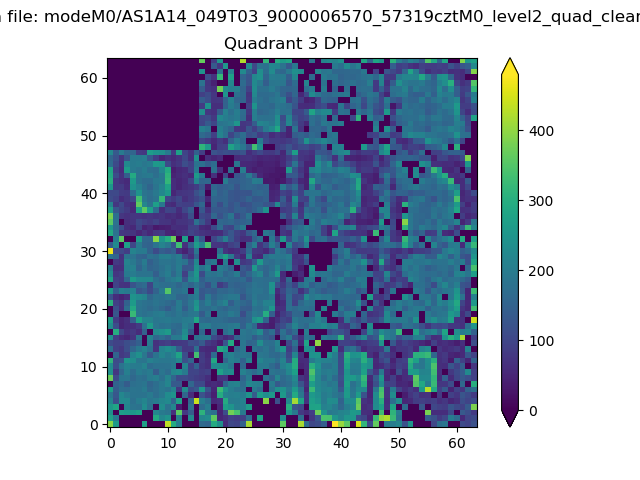 |
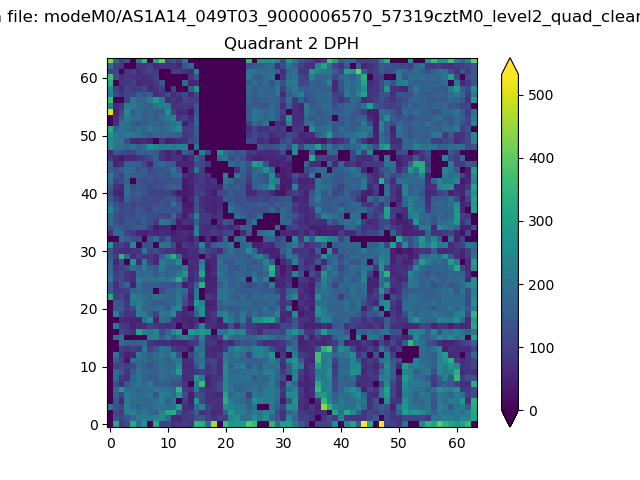 |
Quadrant C |
| Plot type | Count rate plots | Images |
|---|---|---|
| Comparison with Poisson distribution Blue bars denote a histogram of data divided into 1 sec bins. Red curve is a Poisson curve with rate = median count rate of data. |
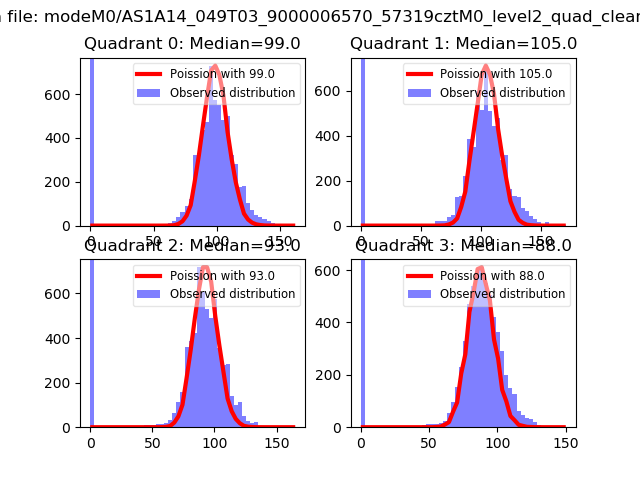 |
 |
| Quadrant-wise count rates Data is divided into 100 sec bins |
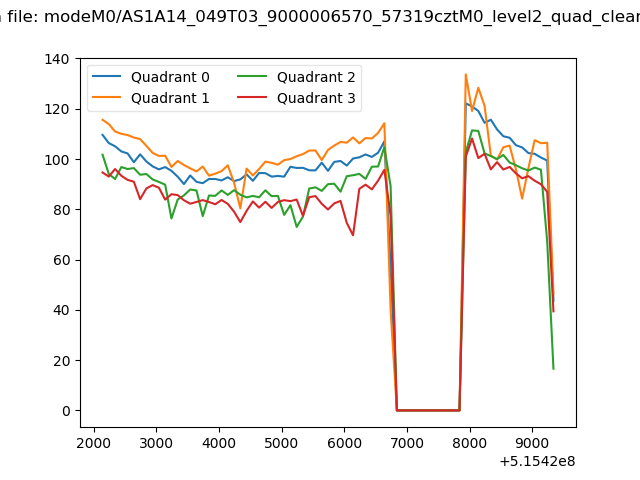 |
|
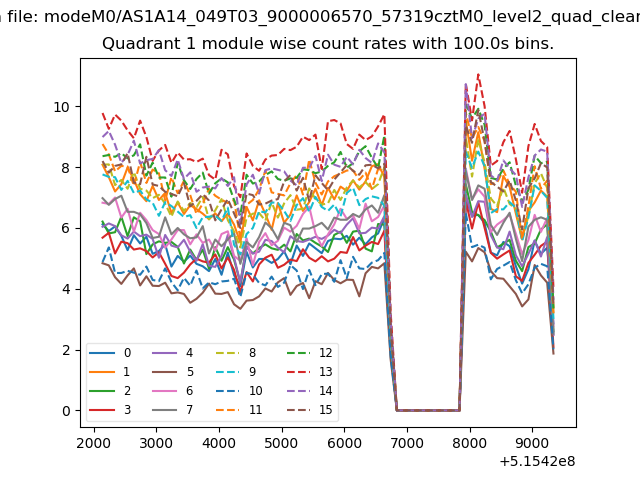
| Module-wise count rates for Quadrant A Data is divided into 100 sec bins |
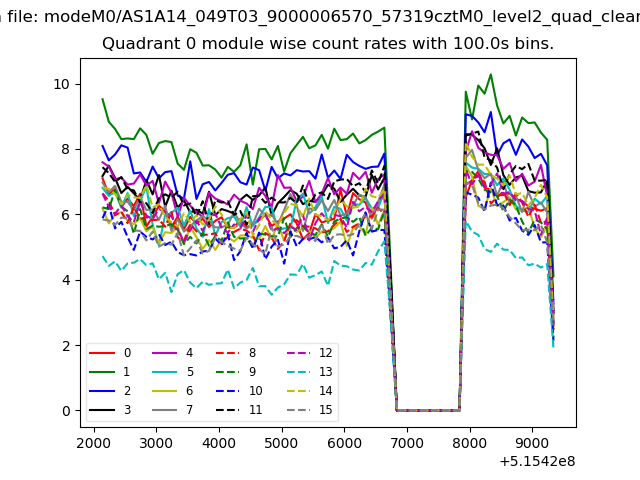 |
 |
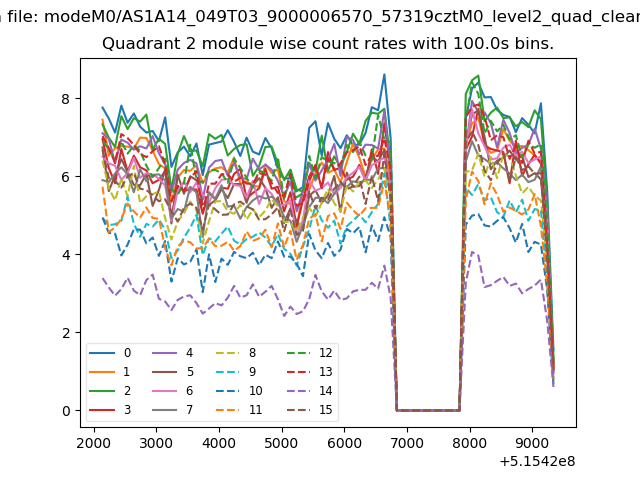
| Module-wise count rates for Quadrant B Data is divided into 100 sec bins |
 |
 |
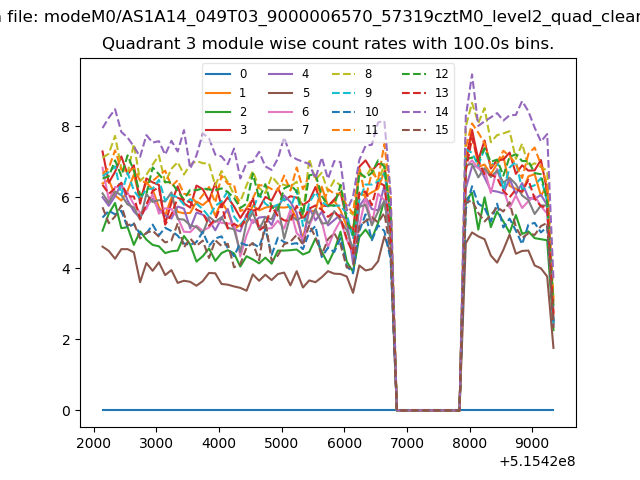
| Module-wise count rates for Quadrant C Data is divided into 100 sec bins |
 |
 |
| Module-wise count rates for Quadrant D Data is divided into 100 sec bins |
 |
 |
| Parameter | Plot |
|---|---|
| CZT HV Monitor | 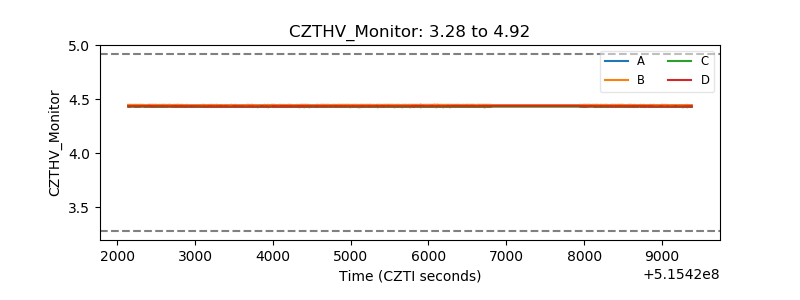 |
| D_VDD | 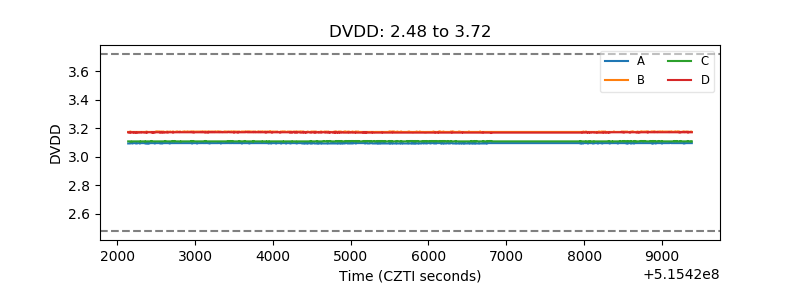 |
| Temperature 1 | 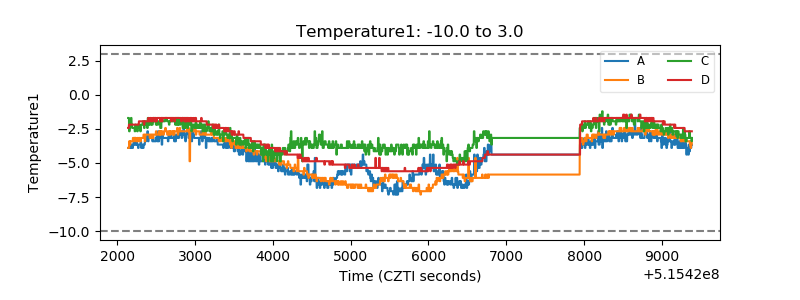 |
| Veto HV Monitor | 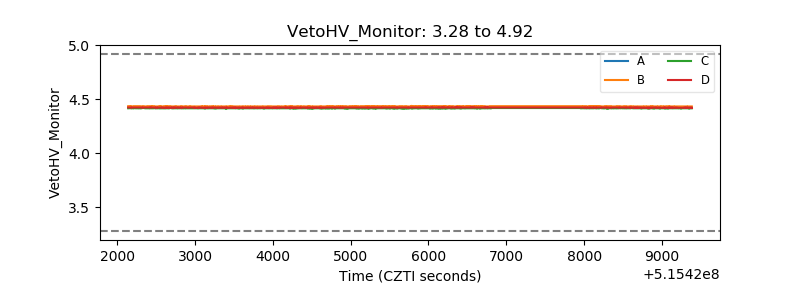 |
| Veto LLD | 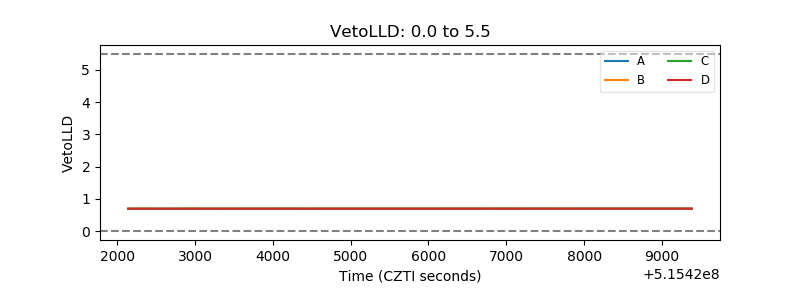 |
| Alpha Counter | 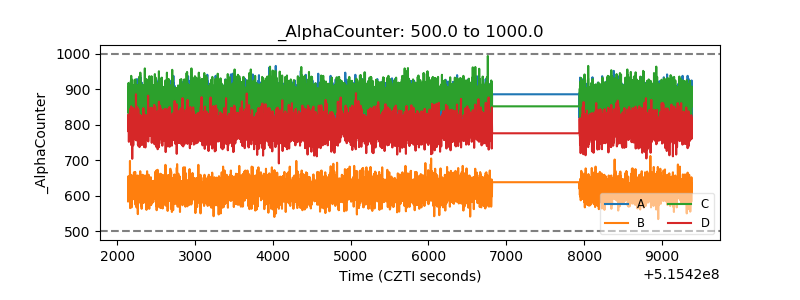 |
| _CPM_Rate | 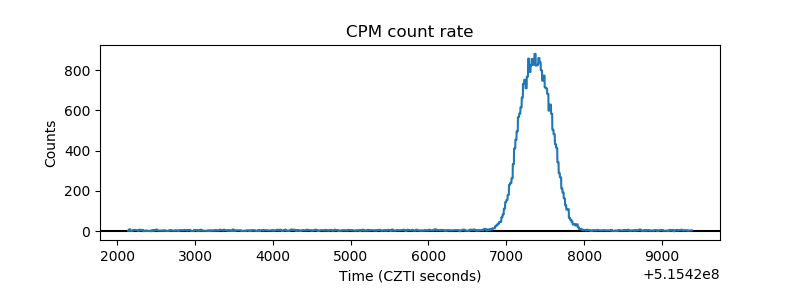 |
| CZT Counter | 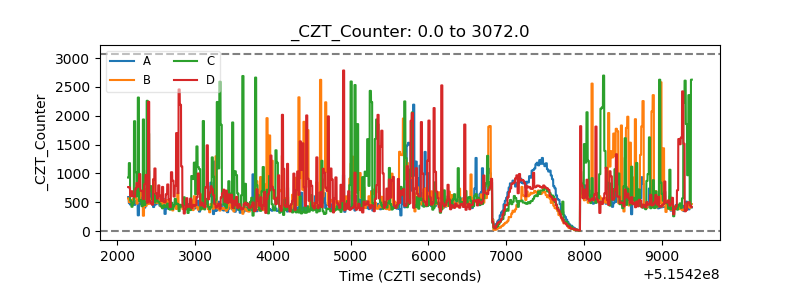 |
| +2.5 Volts monitor |  |
| +5 Volts monitor |  |
| _ROLL_ROT | 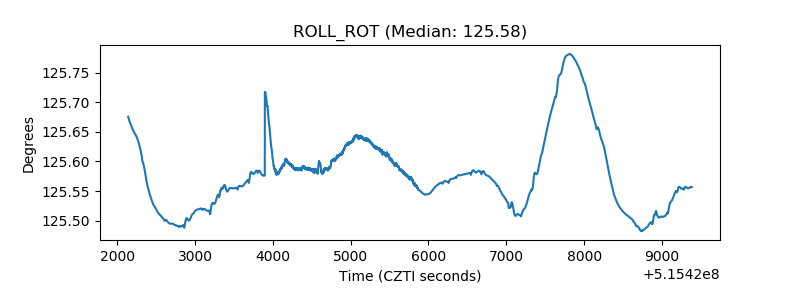 |
| _Roll_DEC | 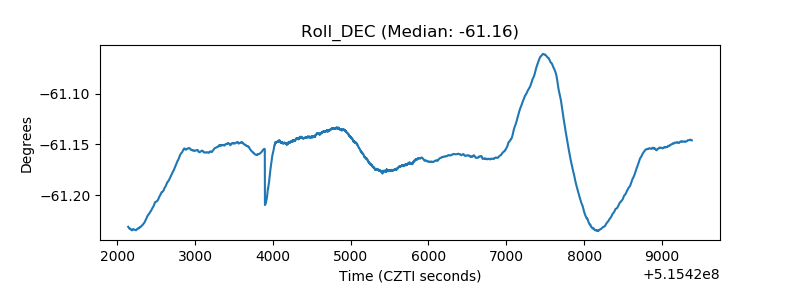 |
| _Roll_RA | 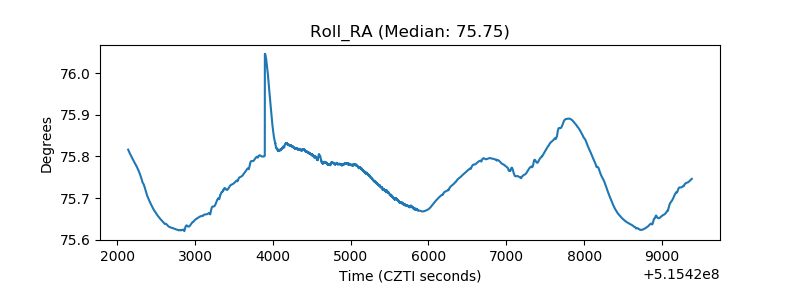 |
| Veto Counter | 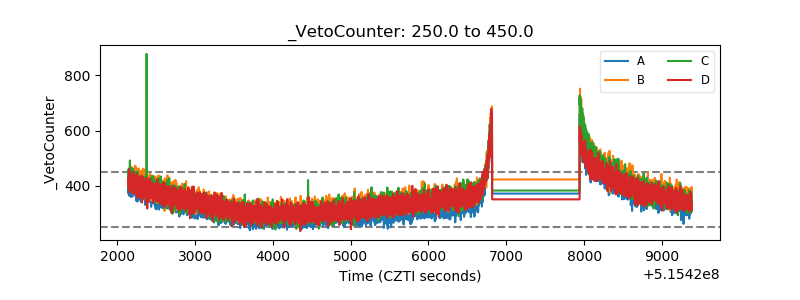 |