| Param | Original file | Final file |
|---|---|---|
| Filename | modeM0/AS1A14_049T03_9000006570_57321cztM0_level2.fits | modeM0/AS1A14_049T03_9000006570_57321cztM0_level2_quad_clean.evt |
| Size (bytes) | 549,239,040 | 91,624,320 |
| Size | 523.8 MB | 87.4 MB |
| Events in quadrant A | 3,192,638 | 641,869 |
| Events in quadrant B | 3,433,846 | 678,756 |
| Events in quadrant C | 4,783,617 | 581,506 |
| Events in quadrant D | 8,434,712 | 435,250 |
| Mode M0 | |||
|---|---|---|---|
| Quadrant | BADHDUFLAG | Total packets | Discarded packets |
| A | 0 | 13912 | 47 |
| B | 0 | 14448 | 59 |
| C | 0 | 18783 | 90 |
| D | 0 | 29439 | 80 |
| Mode M9 | |||
|---|---|---|---|
| Quadrant | BADHDUFLAG | Total packets | Discarded packets |
| A | 0 | 13 | 0 |
| B | 0 | 14 | 1 |
| C | 0 | 14 | 0 |
| D | 0 | 14 | 0 |
| Mode SS | |||
|---|---|---|---|
| Quadrant | BADHDUFLAG | Total packets | Discarded packets |
| A | 0 | 126 | 0 |
| B | 0 | 126 | 0 |
| C | 0 | 126 | 0 |
| D | 0 | 126 | 0 |
| Quadrant | Total seconds | Saturated seconds | Saturation percentage |
|---|---|---|---|
| A | 6264 | 37 | 0.590677% |
| B | 6260 | 122 | 1.948882% |
| C | 6261 | 303 | 4.839483% |
| D | 6262 | 1847 | 29.495369% |
Noise dominated data is calculated using 1-second bins in cleaned event files. If a bin has >2000 counts, and if more than 50% of those come from <1% of pixels, then it is considered to be noise-dominated and hence unusable.
| Quadrant | # 1 sec bins | Bins with >0 counts | Bins with >2000 counts | High rate bins dominated by noise | Noise dominated (total time) | Noise dominated (detector-on time) | Marked lightcurve |
|---|---|---|---|---|---|---|---|
| A | 7508 | 6276 | 22 | 22 | 0.29% | 0.35% | 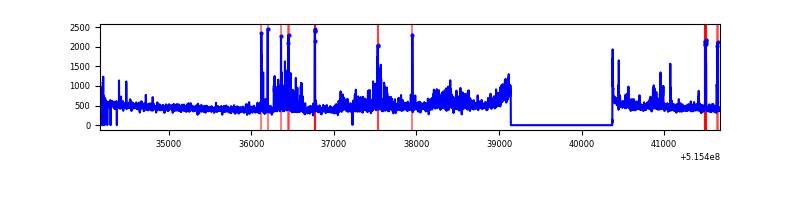 |
| B | 7508 | 6273 | 69 | 69 | 0.92% | 1.10% | 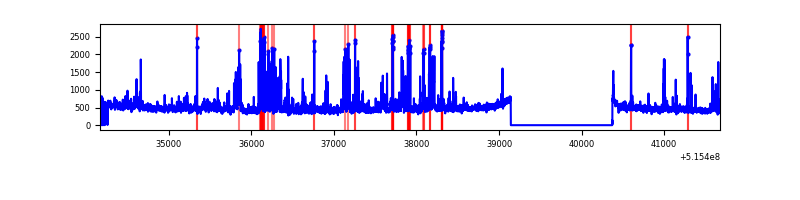 |
| C | 7508 | 6272 | 302 | 302 | 4.02% | 4.82% | 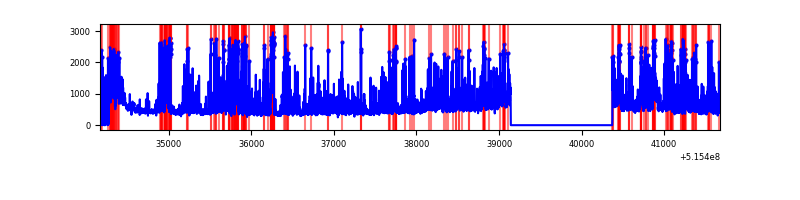 |
| D | 7507 | 6275 | 1775 | 1775 | 23.64% | 28.29% | 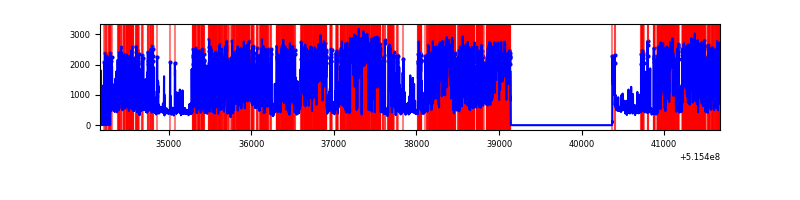 |
Top three noisy pixels from each quadrant. If the there are fewer than three noisy pixels in the level2.evt file, extra rows are filled as -1
| Pixel properties | Quadrant properties | ||||||
|---|---|---|---|---|---|---|---|
| Quadrant | DetID | PixID | Counts | Sigma | Mean | Median | Sigma |
| A | 0 | 12 | 440564 | 2527.85 | 698 | 680 | 174.0 |
| A | 3 | 245 | 19565 | 108.52 | 698 | 680 | 174.0 |
| A | 8 | 4 | 11039 | 59.53 | 698 | 680 | 174.0 |
| B | 5 | 185 | 353310 | 2412.86 | 686 | 662 | 146.2 |
| B | 2 | 249 | 89167 | 605.56 | 686 | 662 | 146.2 |
| B | 7 | 252 | 72672 | 492.7 | 686 | 662 | 146.2 |
| C | 15 | 224 | 1607006 | 9027.8 | 650 | 644 | 177.9 |
| C | 14 | 254 | 293069 | 1643.44 | 650 | 644 | 177.9 |
| C | 6 | 223 | 123990 | 693.21 | 650 | 644 | 177.9 |
| D | 3 | 224 | 5484266 | 32745.15 | 584 | 558 | 167.5 |
| D | 2 | 249 | 445900 | 2659.29 | 584 | 558 | 167.5 |
| D | 2 | 31 | 68854 | 407.82 | 584 | 558 | 167.5 |
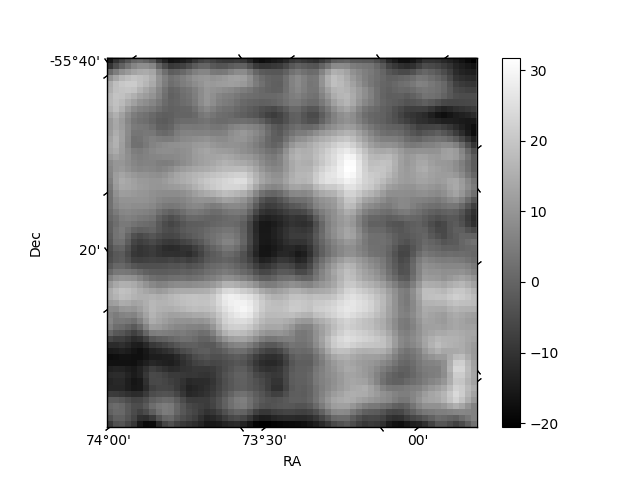
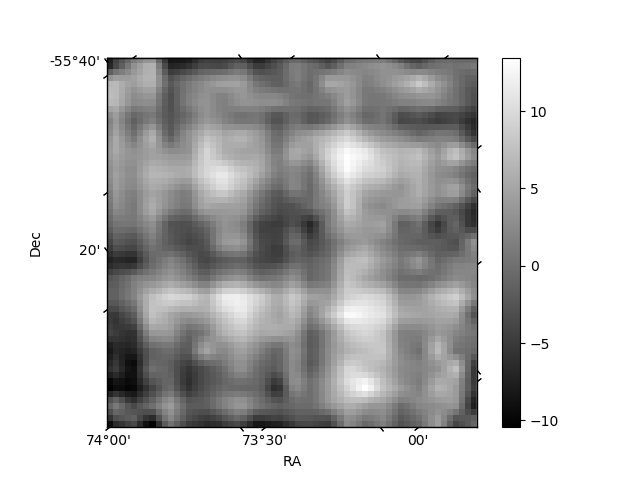
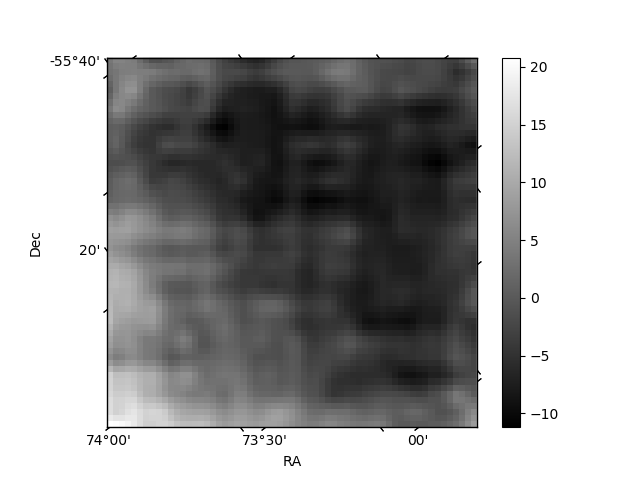
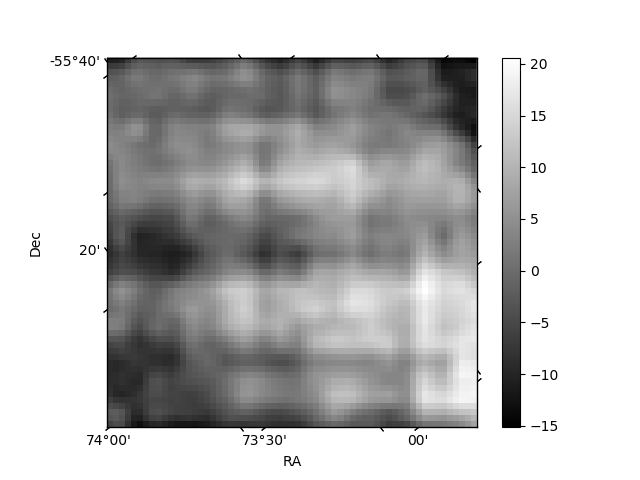
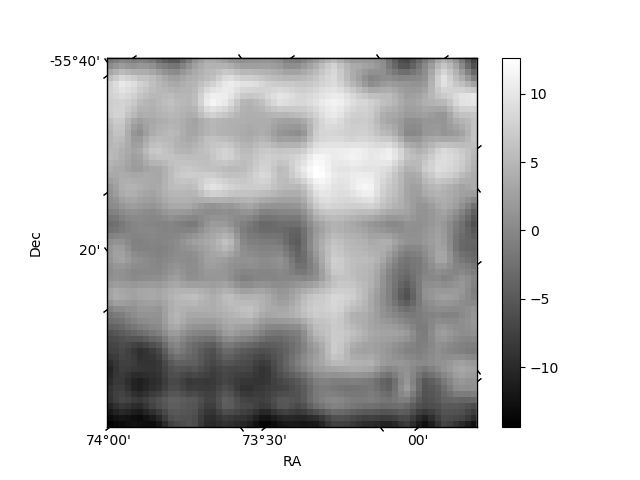
Histogram calculated using DETX and DETY for each event in the final _common_clean file
| Quadrant A | 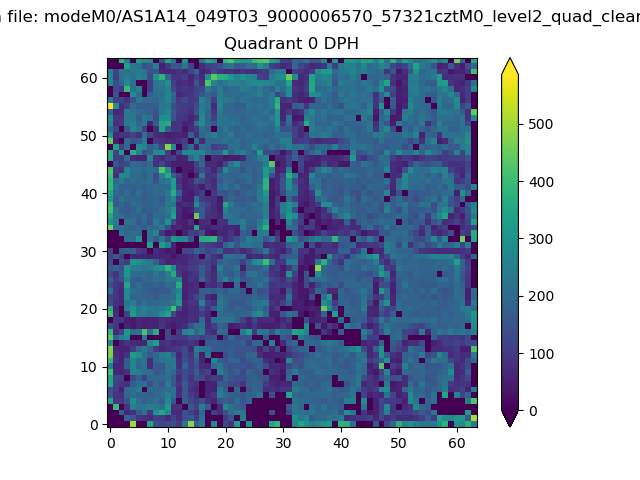 |
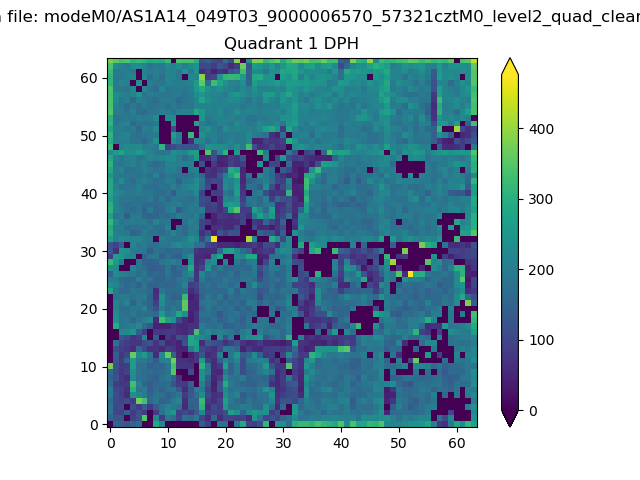 |
Quadrant B |
|---|---|---|---|
| Quadrant D | 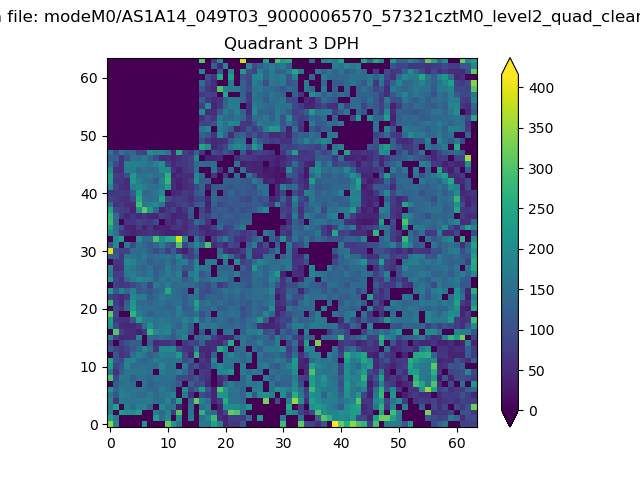 |
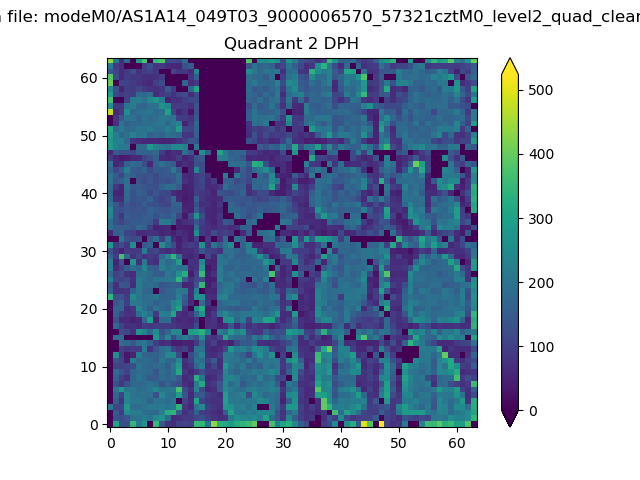 |
Quadrant C |
| Plot type | Count rate plots | Images |
|---|---|---|
| Comparison with Poisson distribution Blue bars denote a histogram of data divided into 1 sec bins. Red curve is a Poisson curve with rate = median count rate of data. |
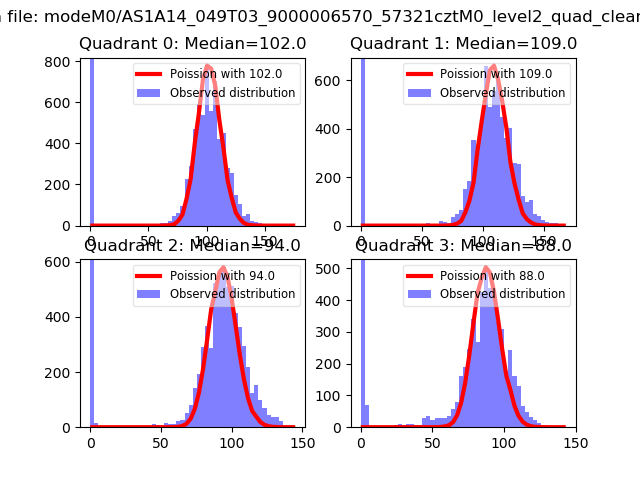 |
 |
| Quadrant-wise count rates Data is divided into 100 sec bins |
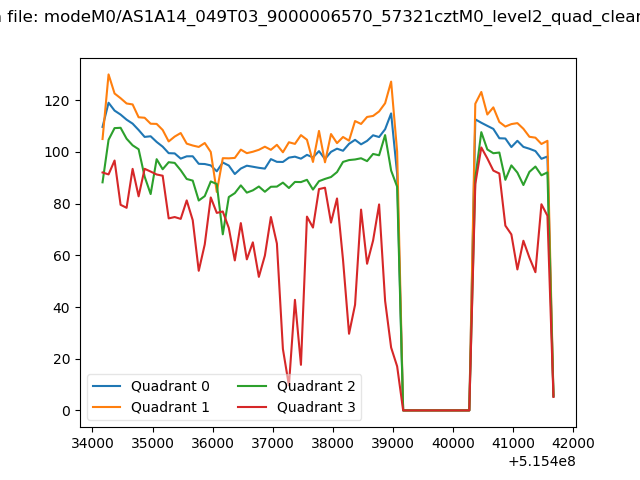 |
|
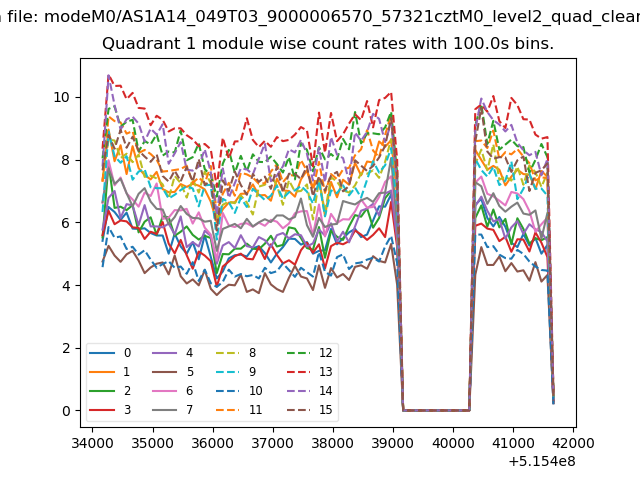
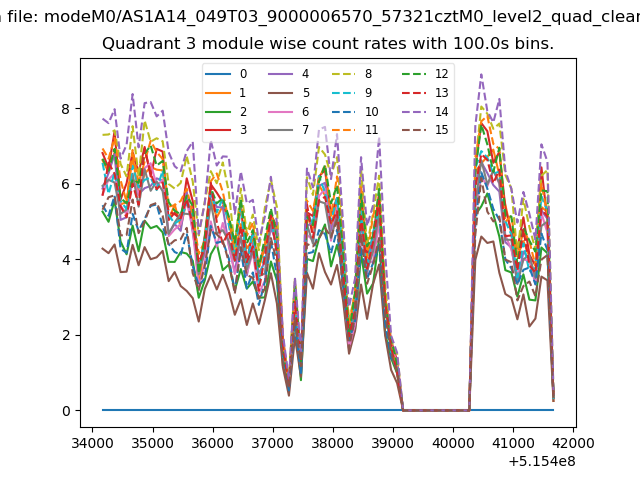
| Module-wise count rates for Quadrant A Data is divided into 100 sec bins |
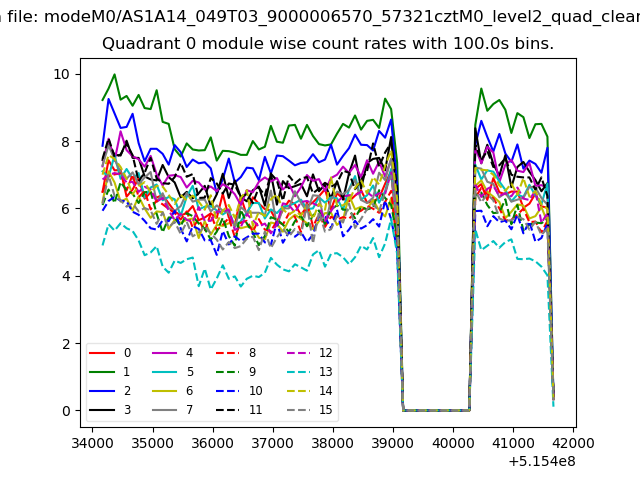 |
 |
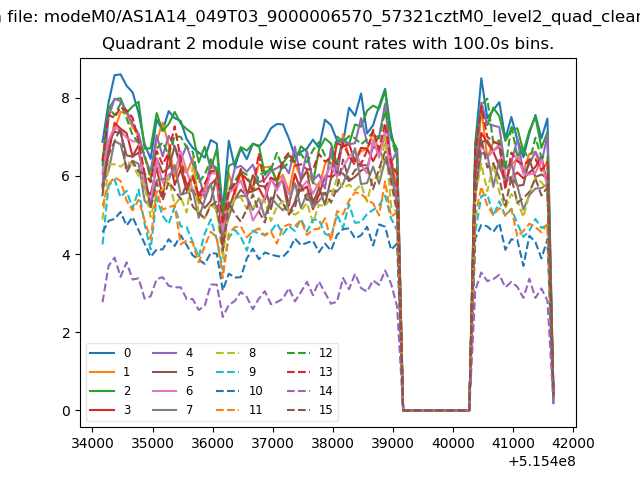
| Module-wise count rates for Quadrant B Data is divided into 100 sec bins |
 |
 |
| Module-wise count rates for Quadrant C Data is divided into 100 sec bins |
 |
 |
| Module-wise count rates for Quadrant D Data is divided into 100 sec bins |
 |
 |
| Parameter | Plot |
|---|---|
| CZT HV Monitor | 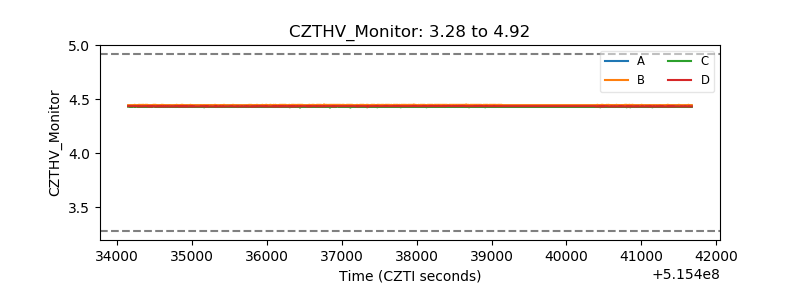 |
| D_VDD | 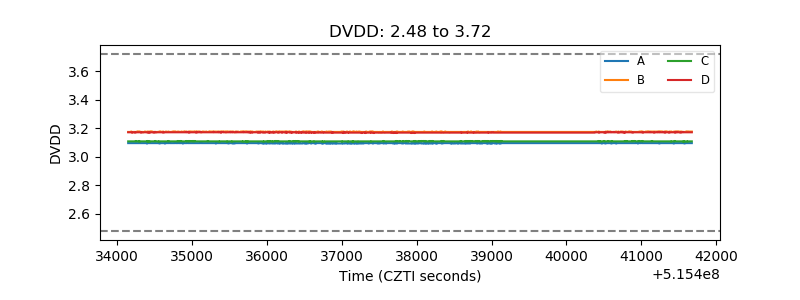 |
| Temperature 1 | 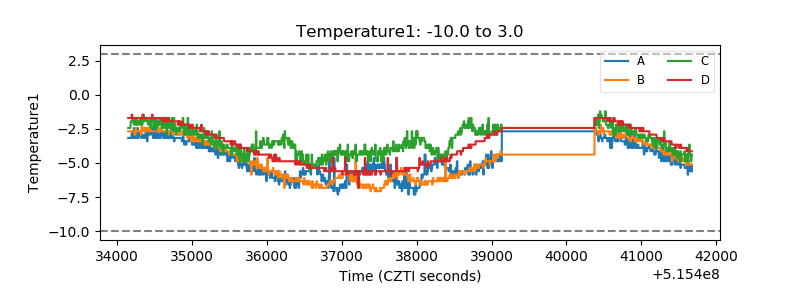 |
| Veto HV Monitor | 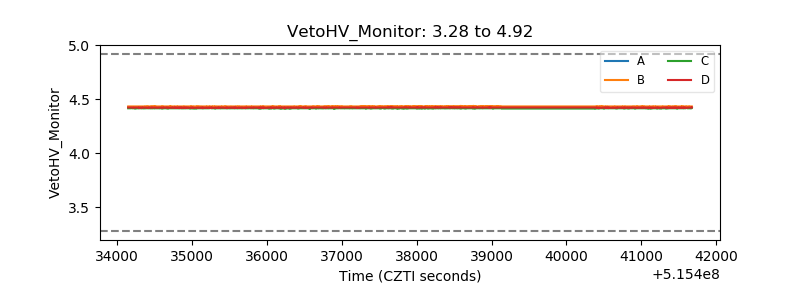 |
| Veto LLD | 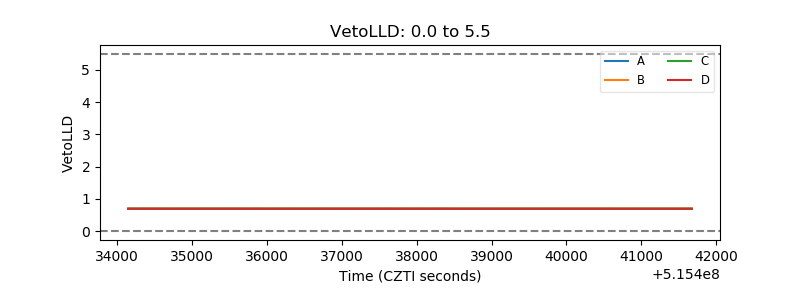 |
| Alpha Counter | 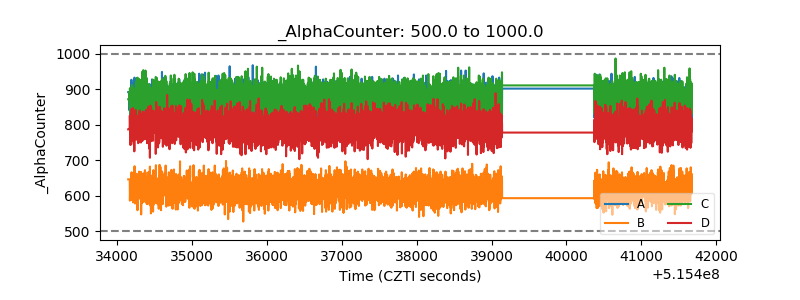 |
| _CPM_Rate | 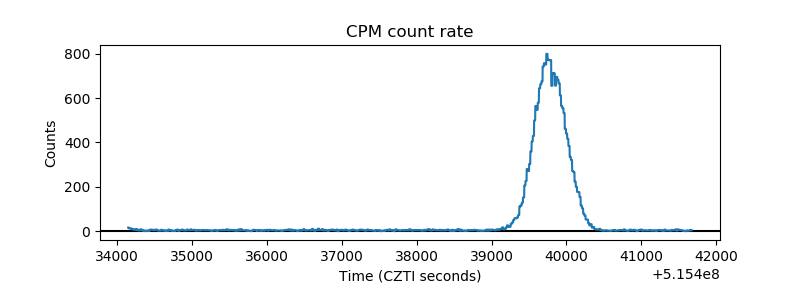 |
| CZT Counter | 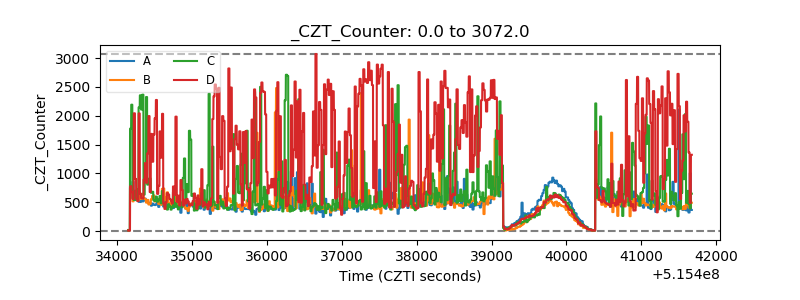 |
| +2.5 Volts monitor |  |
| +5 Volts monitor |  |
| _ROLL_ROT | 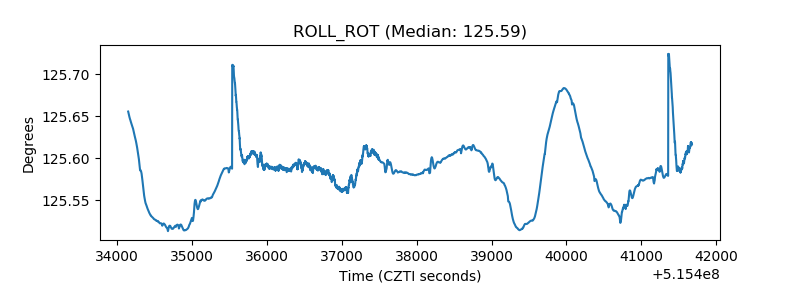 |
| _Roll_DEC | 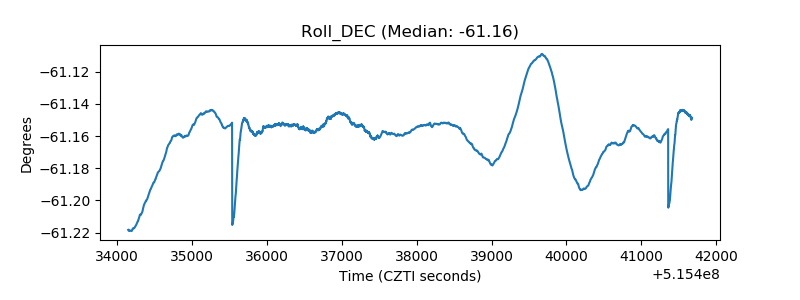 |
| _Roll_RA | 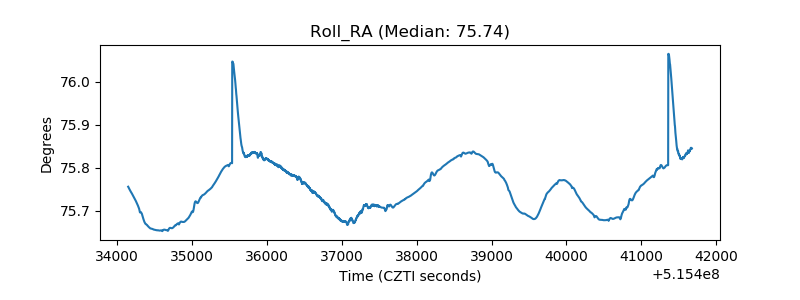 |
| Veto Counter | 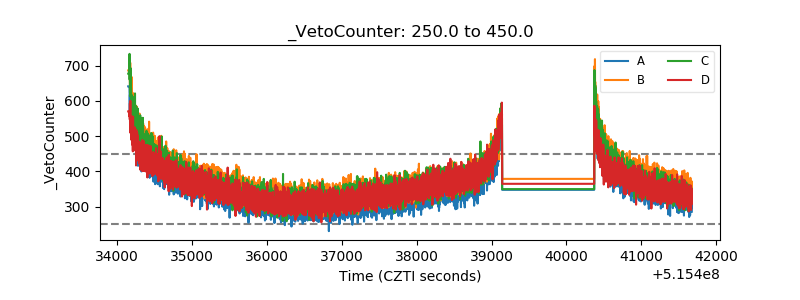 |