| Param | Original file | Final file |
|---|---|---|
| Filename | modeM0/AS1A14_049T03_9000006570_57322cztM0_level2.fits | modeM0/AS1A14_049T03_9000006570_57322cztM0_level2_quad_clean.evt |
| Size (bytes) | 549,642,240 | 85,464,000 |
| Size | 524.2 MB | 81.5 MB |
| Events in quadrant A | 4,868,570 | 566,035 |
| Events in quadrant B | 3,939,722 | 604,503 |
| Events in quadrant C | 4,428,315 | 515,970 |
| Events in quadrant D | 6,614,322 | 455,831 |
| Mode M0 | |||
|---|---|---|---|
| Quadrant | BADHDUFLAG | Total packets | Discarded packets |
| A | 0 | 19362 | 309 |
| B | 0 | 16461 | 290 |
| C | 0 | 18290 | 551 |
| D | 0 | 24508 | 390 |
| Mode M9 | |||
|---|---|---|---|
| Quadrant | BADHDUFLAG | Total packets | Discarded packets |
| A | 0 | 12 | 0 |
| B | 0 | 12 | 0 |
| C | 0 | 12 | 0 |
| D | 0 | 12 | 0 |
| Mode SS | |||
|---|---|---|---|
| Quadrant | BADHDUFLAG | Total packets | Discarded packets |
| A | 0 | 130 | 4 |
| B | 0 | 130 | 0 |
| C | 0 | 130 | 0 |
| D | 0 | 130 | 2 |
| Quadrant | Total seconds | Saturated seconds | Saturation percentage |
|---|---|---|---|
| A | 6388 | 341 | 5.338134% |
| B | 6391 | 189 | 2.957284% |
| C | 6364 | 266 | 4.179761% |
| D | 6382 | 1044 | 16.358508% |
Noise dominated data is calculated using 1-second bins in cleaned event files. If a bin has >2000 counts, and if more than 50% of those come from <1% of pixels, then it is considered to be noise-dominated and hence unusable.
| Quadrant | # 1 sec bins | Bins with >0 counts | Bins with >2000 counts | High rate bins dominated by noise | Noise dominated (total time) | Noise dominated (detector-on time) | Marked lightcurve |
|---|---|---|---|---|---|---|---|
| A | 7843 | 6694 | 306 | 306 | 3.90% | 4.57% | 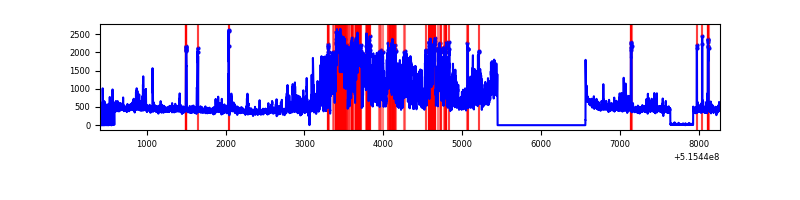 |
| B | 7858 | 6697 | 98 | 98 | 1.25% | 1.46% | 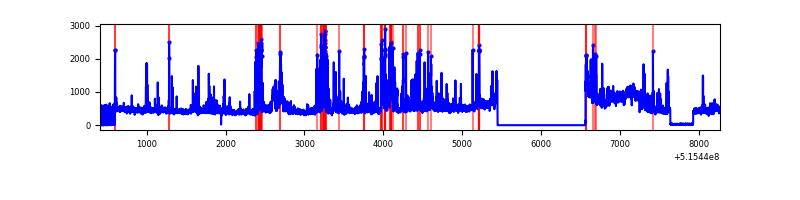 |
| C | 7843 | 6670 | 283 | 283 | 3.61% | 4.24% | 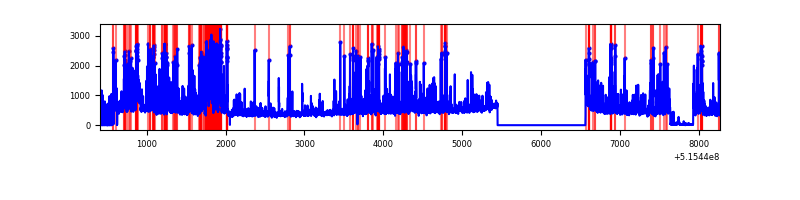 |
| D | 7840 | 6685 | 972 | 972 | 12.40% | 14.54% | 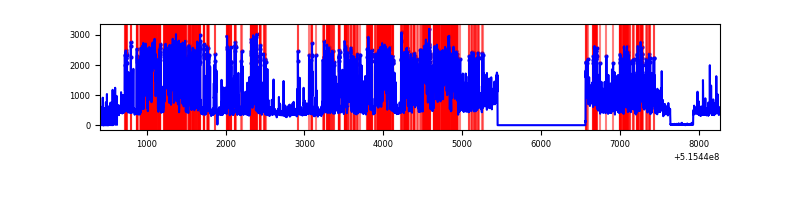 |
Top three noisy pixels from each quadrant. If the there are fewer than three noisy pixels in the level2.evt file, extra rows are filled as -1
| Pixel properties | Quadrant properties | ||||||
|---|---|---|---|---|---|---|---|
| Quadrant | DetID | PixID | Counts | Sigma | Mean | Median | Sigma |
| A | 0 | 12 | 2135105 | 12465.21 | 691 | 674 | 171.2 |
| A | 3 | 245 | 22697 | 128.62 | 691 | 674 | 171.2 |
| A | 4 | 3 | 10004 | 54.49 | 691 | 674 | 171.2 |
| B | 5 | 185 | 770344 | 5281.41 | 684 | 659 | 145.7 |
| B | 10 | 16 | 297744 | 2038.53 | 684 | 659 | 145.7 |
| B | 7 | 252 | 49636 | 336.07 | 684 | 659 | 145.7 |
| C | 15 | 224 | 1337937 | 7471.15 | 653 | 647 | 179.0 |
| C | 14 | 254 | 330787 | 1844.42 | 653 | 647 | 179.0 |
| C | 6 | 223 | 83366 | 462.13 | 653 | 647 | 179.0 |
| D | 3 | 224 | 3371049 | 18942.97 | 623 | 594 | 177.9 |
| D | 2 | 249 | 376069 | 2110.28 | 623 | 594 | 177.9 |
| D | 7 | 96 | 122684 | 686.18 | 623 | 594 | 177.9 |
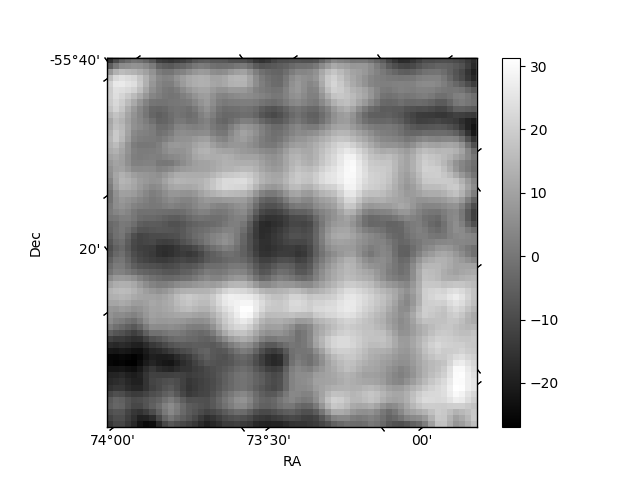
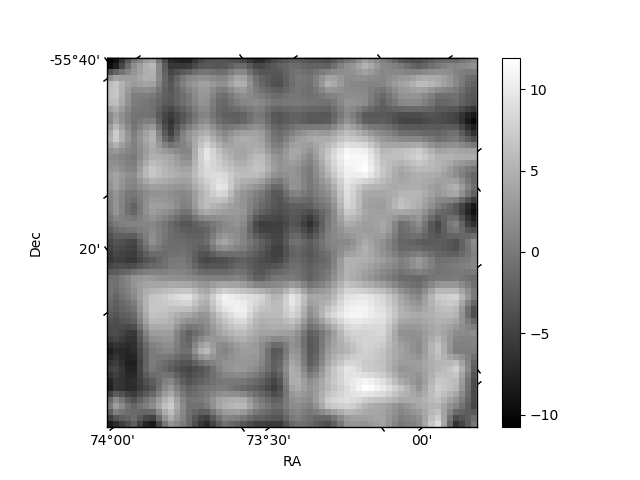
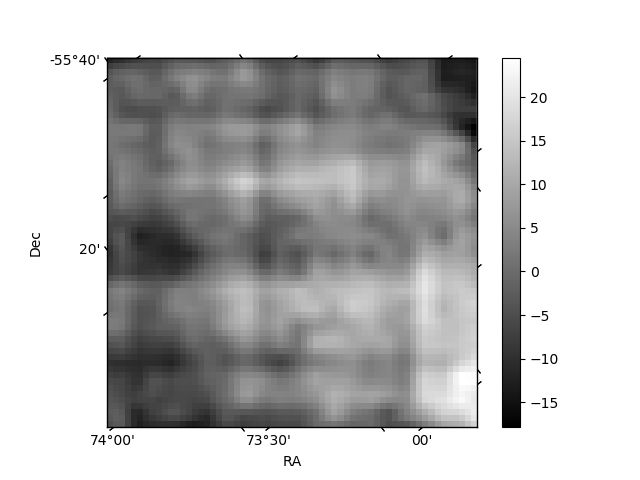
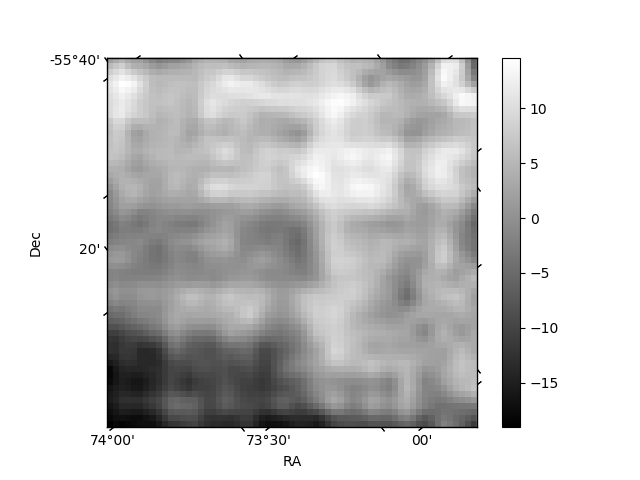
Histogram calculated using DETX and DETY for each event in the final _common_clean file
| Quadrant A | 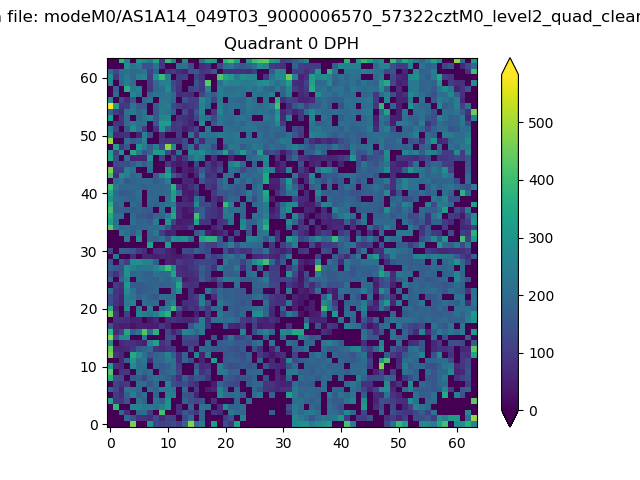 |
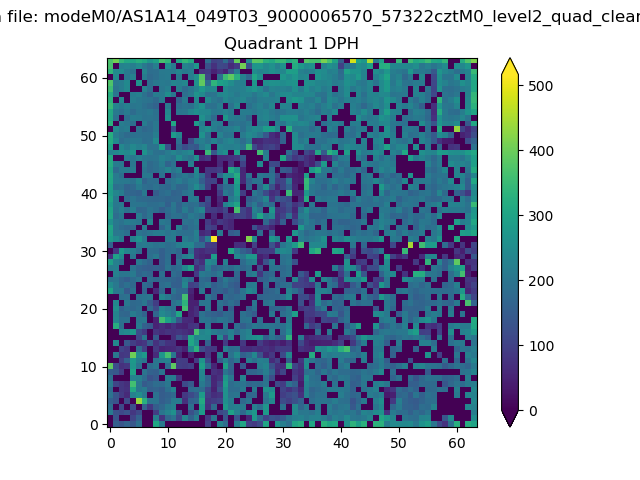 |
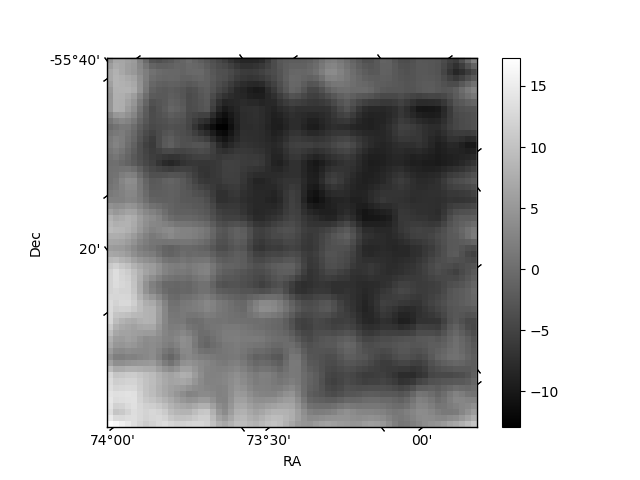
Quadrant B |
|---|---|---|---|
| Quadrant D | 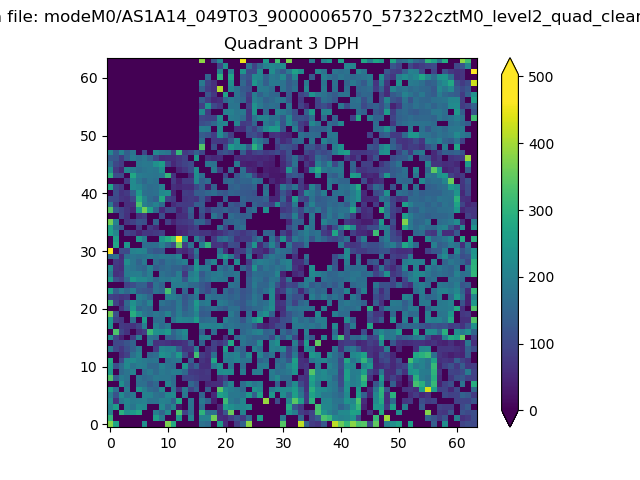 |
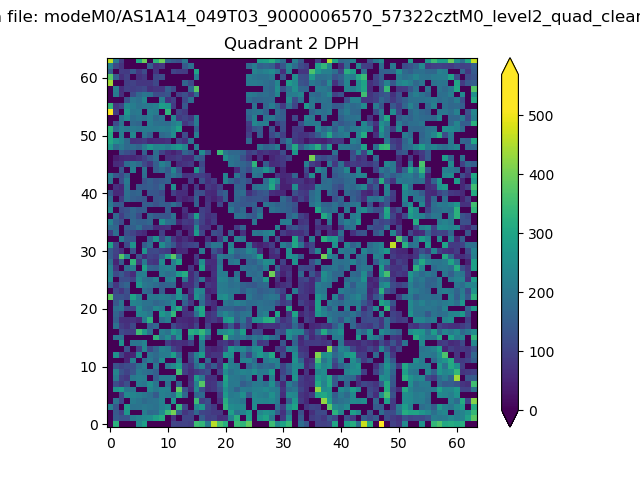 |
Quadrant C |
| Plot type | Count rate plots | Images |
|---|---|---|
| Comparison with Poisson distribution Blue bars denote a histogram of data divided into 1 sec bins. Red curve is a Poisson curve with rate = median count rate of data. |
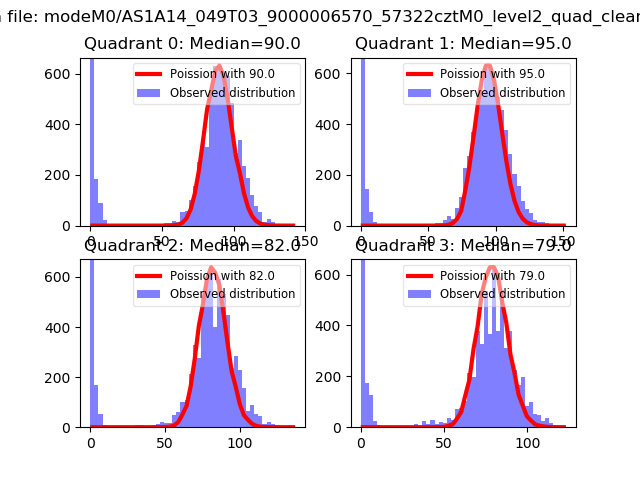 |
 |
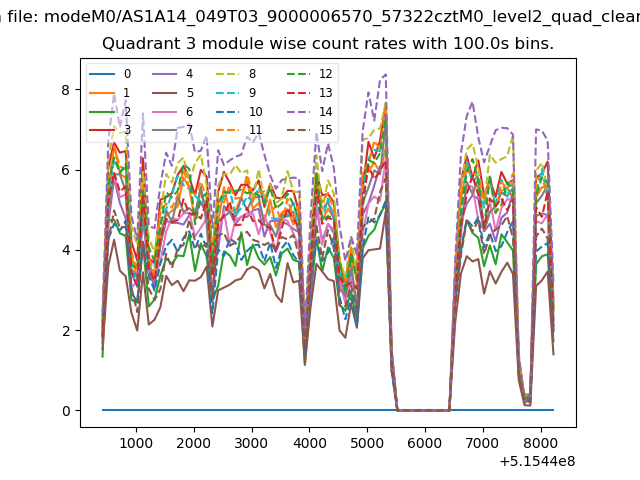
| Quadrant-wise count rates Data is divided into 100 sec bins |
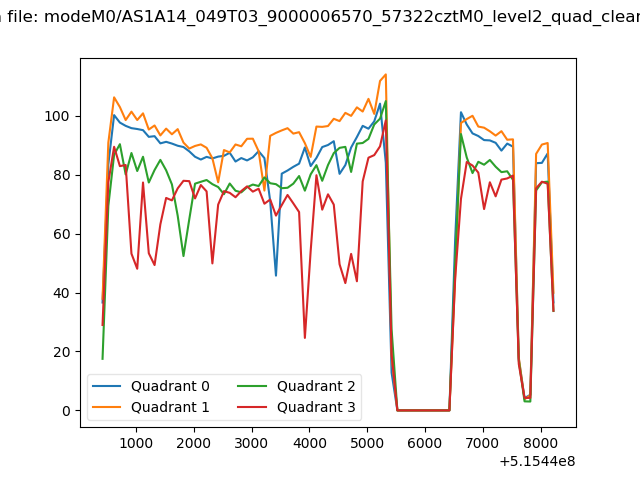 |
|
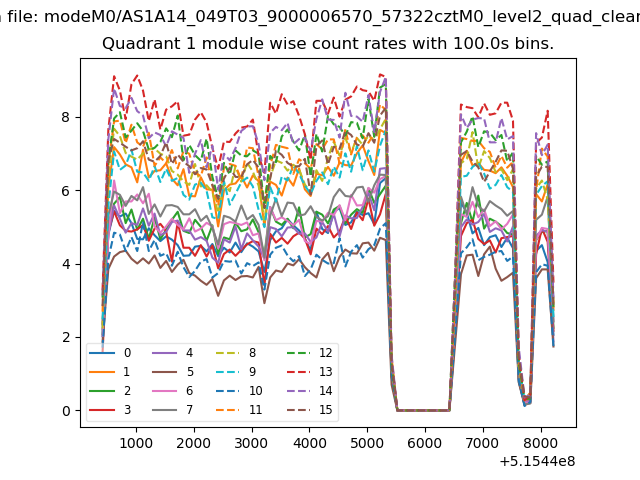
| Module-wise count rates for Quadrant A Data is divided into 100 sec bins |
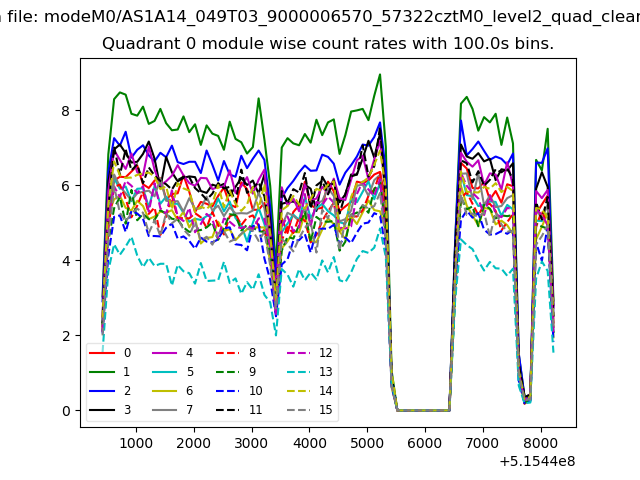 |
 |
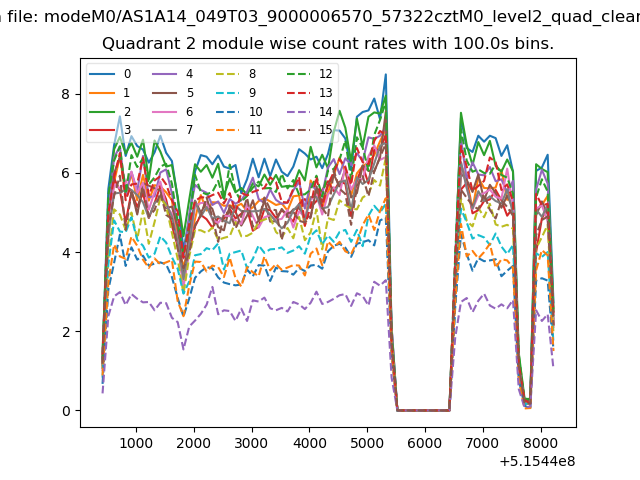
| Module-wise count rates for Quadrant B Data is divided into 100 sec bins |
 |
 |
| Module-wise count rates for Quadrant C Data is divided into 100 sec bins |
 |
 |
| Module-wise count rates for Quadrant D Data is divided into 100 sec bins |
 |
 |
| Parameter | Plot |
|---|---|
| CZT HV Monitor | 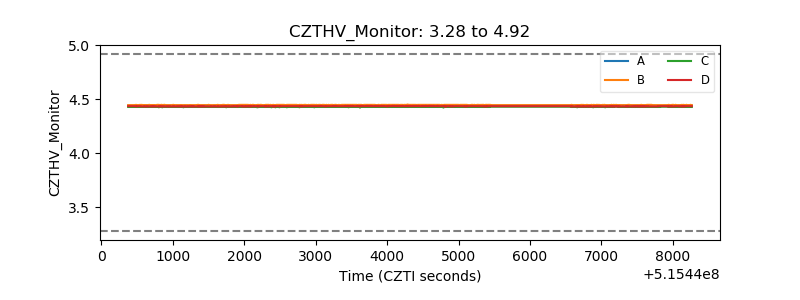 |
| D_VDD | 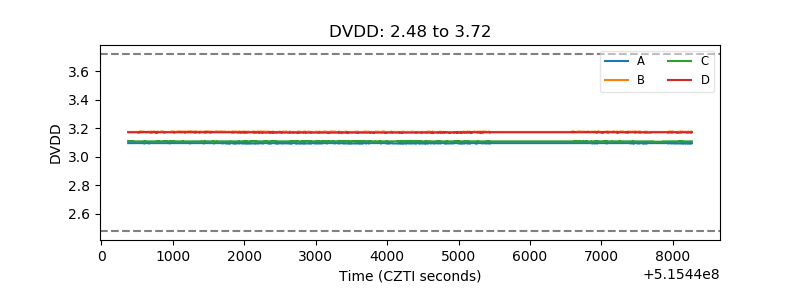 |
| Temperature 1 | 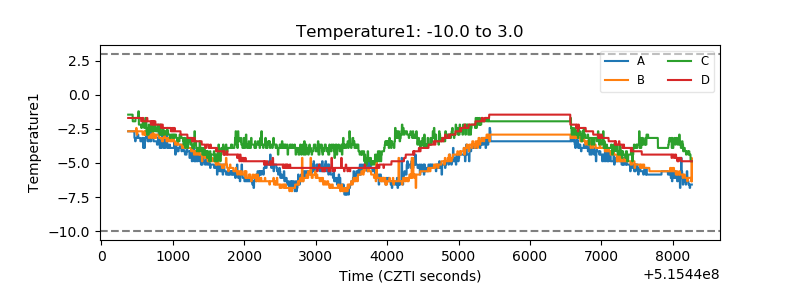 |
| Veto HV Monitor | 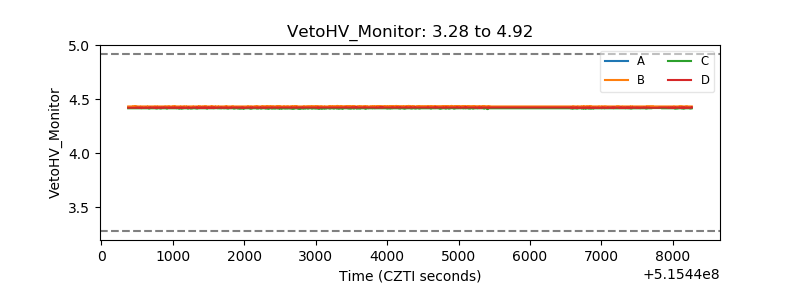 |
| Veto LLD | 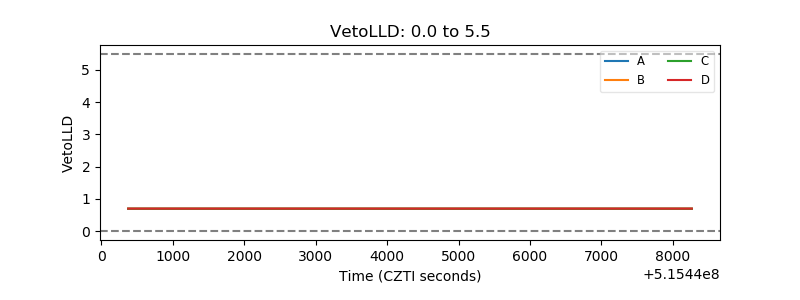 |
| Alpha Counter | 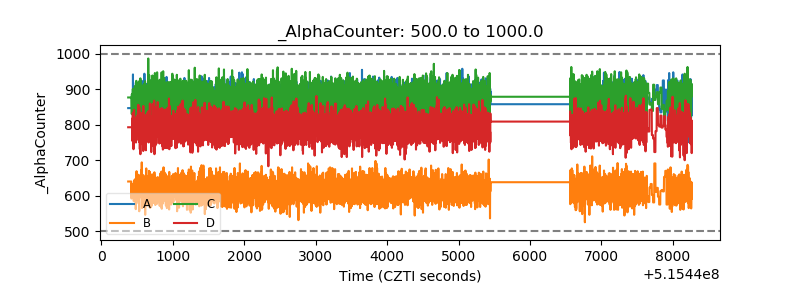 |
| _CPM_Rate | 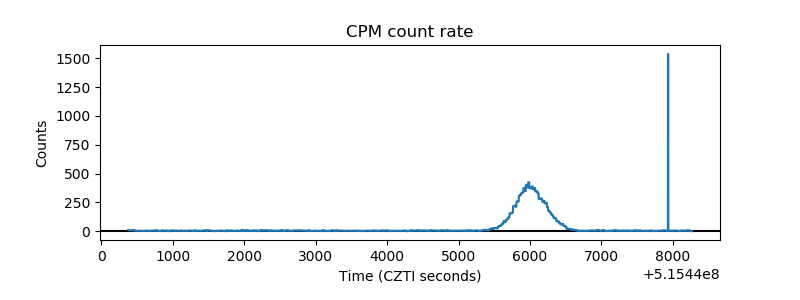 |
| CZT Counter | 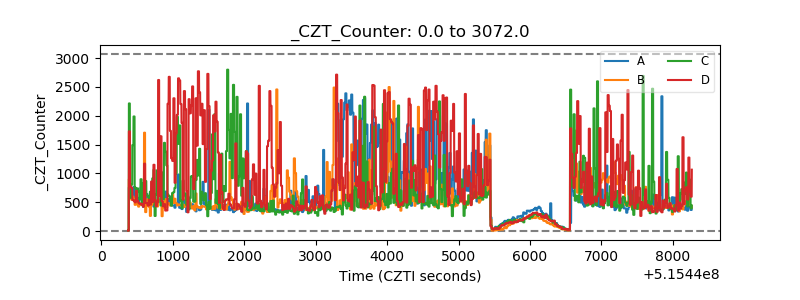 |
| +2.5 Volts monitor |  |
| +5 Volts monitor |  |
| _ROLL_ROT | 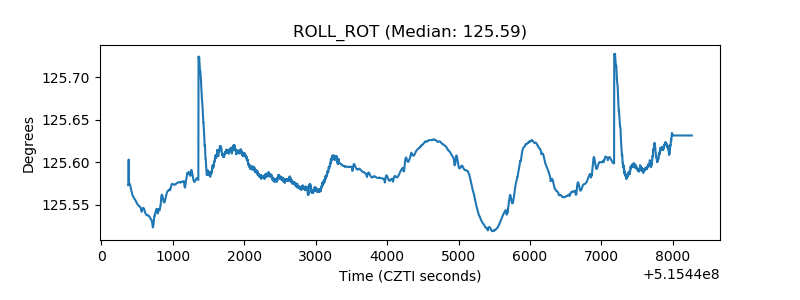 |
| _Roll_DEC | 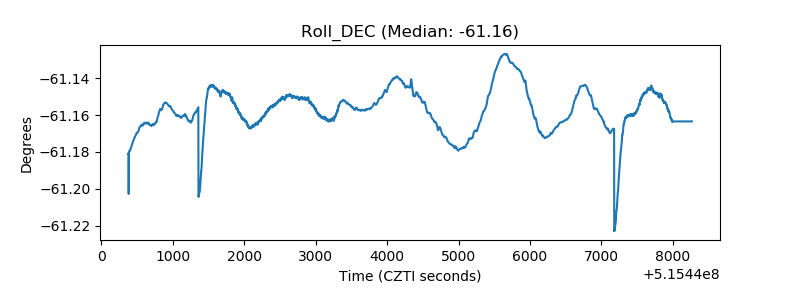 |
| _Roll_RA | 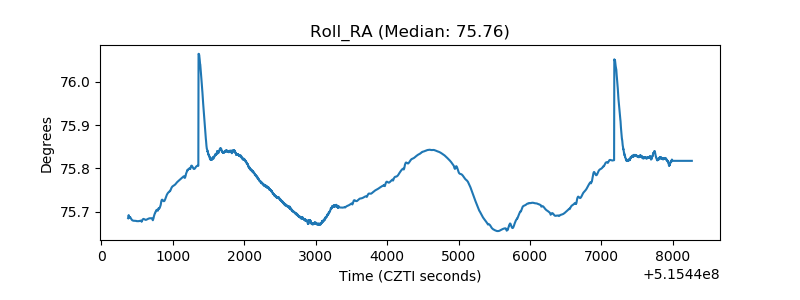 |
| Veto Counter | 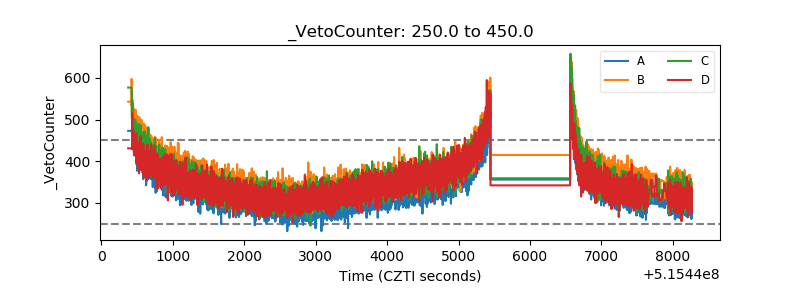 |