| Param | Original file | Final file |
|---|---|---|
| Filename | modeM0/AS1A14_049T03_9000006570_57323cztM0_level2.fits | modeM0/AS1A14_049T03_9000006570_57323cztM0_level2_quad_clean.evt |
| Size (bytes) | 580,985,280 | 86,345,280 |
| Size | 554.1 MB | 82.3 MB |
| Events in quadrant A | 3,936,460 | 589,959 |
| Events in quadrant B | 3,454,459 | 612,973 |
| Events in quadrant C | 5,781,094 | 511,763 |
| Events in quadrant D | 7,815,784 | 433,803 |
| Mode M0 | |||
|---|---|---|---|
| Quadrant | BADHDUFLAG | Total packets | Discarded packets |
| A | 0 | 16485 | 2 |
| B | 0 | 15077 | 2 |
| C | 0 | 21964 | 2 |
| D | 0 | 27889 | 2 |
| Mode M9 | |||
|---|---|---|---|
| Quadrant | BADHDUFLAG | Total packets | Discarded packets |
| A | 0 | 10 | 0 |
| B | 0 | 10 | 0 |
| C | 0 | 10 | 0 |
| D | 0 | 10 | 0 |
| Mode SS | |||
|---|---|---|---|
| Quadrant | BADHDUFLAG | Total packets | Discarded packets |
| A | 0 | 134 | 0 |
| B | 0 | 134 | 0 |
| C | 0 | 134 | 0 |
| D | 0 | 134 | 0 |
| Quadrant | Total seconds | Saturated seconds | Saturation percentage |
|---|---|---|---|
| A | 6685 | 87 | 1.301421% |
| B | 6686 | 87 | 1.301226% |
| C | 6685 | 606 | 9.065071% |
| D | 6685 | 1548 | 23.156320% |
Noise dominated data is calculated using 1-second bins in cleaned event files. If a bin has >2000 counts, and if more than 50% of those come from <1% of pixels, then it is considered to be noise-dominated and hence unusable.
| Quadrant | # 1 sec bins | Bins with >0 counts | Bins with >2000 counts | High rate bins dominated by noise | Noise dominated (total time) | Noise dominated (detector-on time) | Marked lightcurve |
|---|---|---|---|---|---|---|---|
| A | 7873 | 6954 | 88 | 88 | 1.12% | 1.27% | 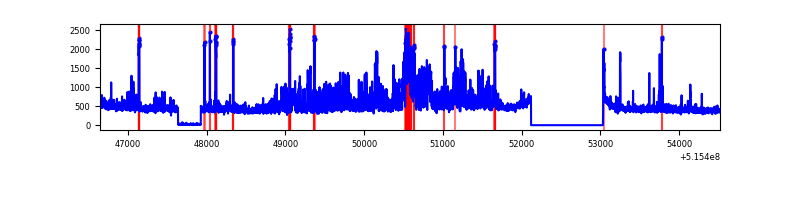 |
| B | 7874 | 6955 | 26 | 26 | 0.33% | 0.37% | 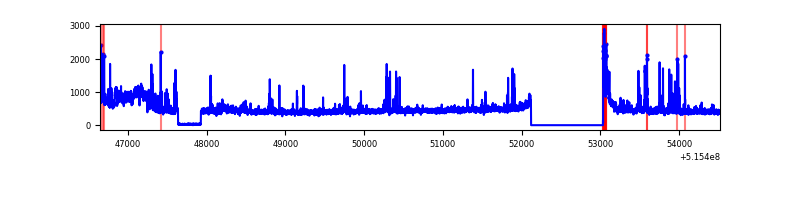 |
| C | 7873 | 6954 | 553 | 553 | 7.02% | 7.95% | 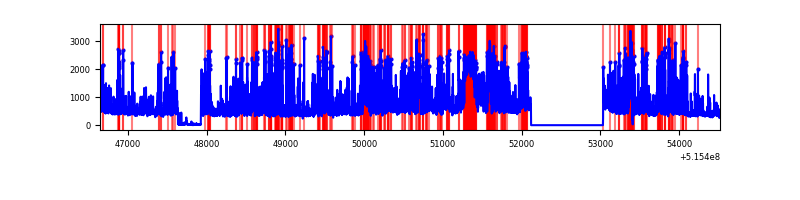 |
| D | 7873 | 6954 | 1357 | 1357 | 17.24% | 19.51% | 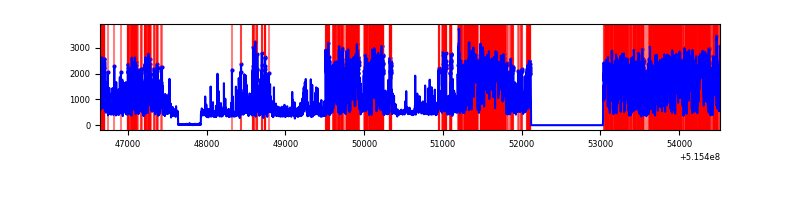 |
Top three noisy pixels from each quadrant. If the there are fewer than three noisy pixels in the level2.evt file, extra rows are filled as -1
| Pixel properties | Quadrant properties | ||||||
|---|---|---|---|---|---|---|---|
| Quadrant | DetID | PixID | Counts | Sigma | Mean | Median | Sigma |
| A | 0 | 12 | 1081358 | 6179.06 | 713 | 695 | 174.9 |
| A | 8 | 4 | 29526 | 164.85 | 713 | 695 | 174.9 |
| A | 3 | 245 | 24075 | 133.68 | 713 | 695 | 174.9 |
| B | 5 | 185 | 337195 | 2221.78 | 704 | 680 | 151.5 |
| B | 10 | 16 | 119742 | 786.09 | 704 | 680 | 151.5 |
| B | 7 | 252 | 80997 | 530.28 | 704 | 680 | 151.5 |
| C | 15 | 224 | 2351772 | 13017.77 | 662 | 656 | 180.6 |
| C | 14 | 254 | 366114 | 2023.49 | 662 | 656 | 180.6 |
| C | 1 | 12 | 324025 | 1790.44 | 662 | 656 | 180.6 |
| D | 3 | 224 | 3943096 | 22192.9 | 620 | 592 | 177.6 |
| D | 7 | 96 | 635284 | 3572.77 | 620 | 592 | 177.6 |
| D | 2 | 249 | 287049 | 1612.51 | 620 | 592 | 177.6 |
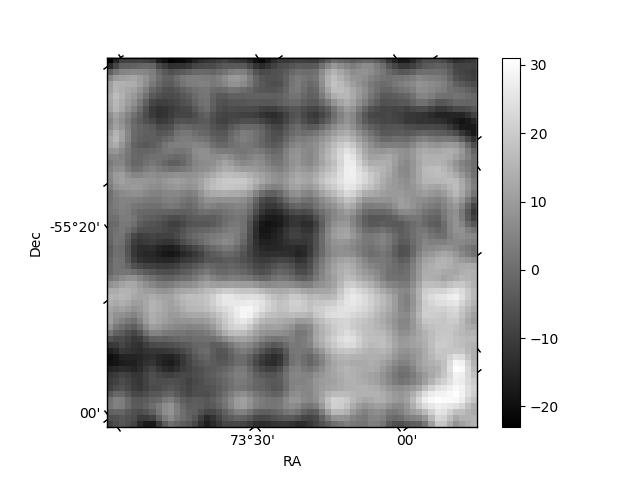
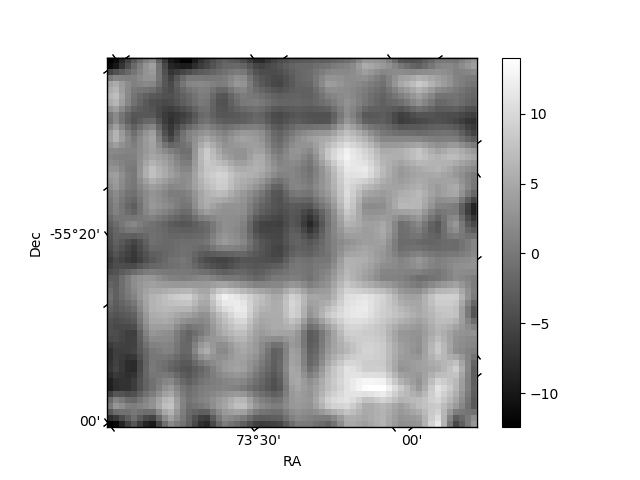
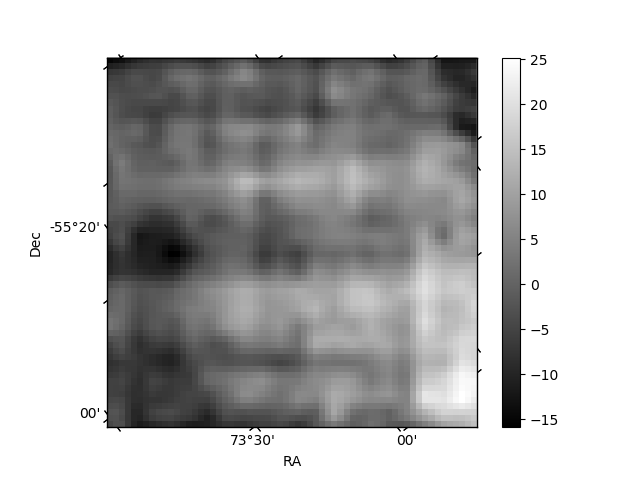
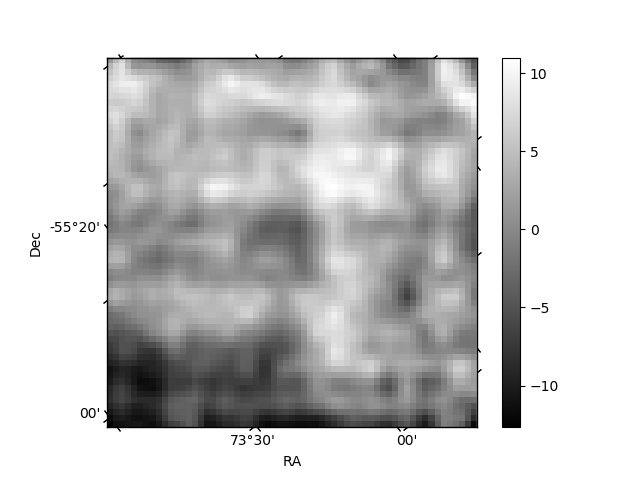
Histogram calculated using DETX and DETY for each event in the final _common_clean file
| Quadrant A | 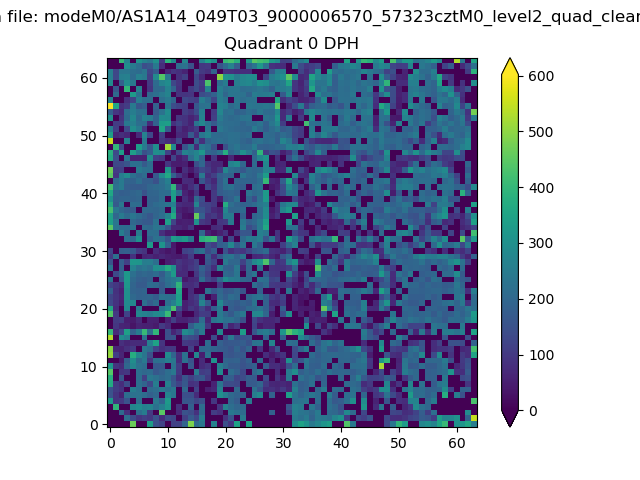 |
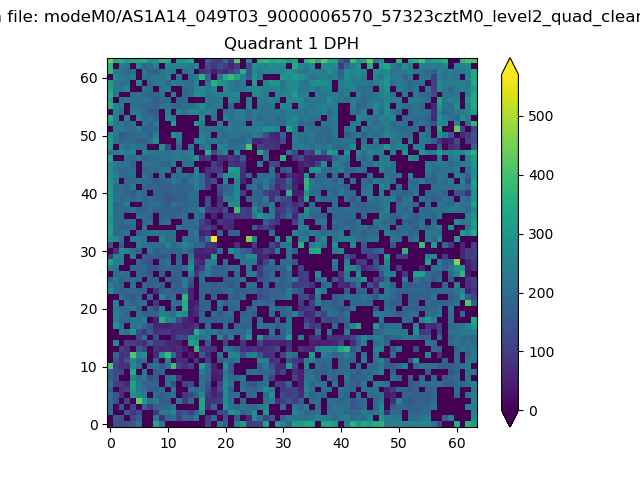 |
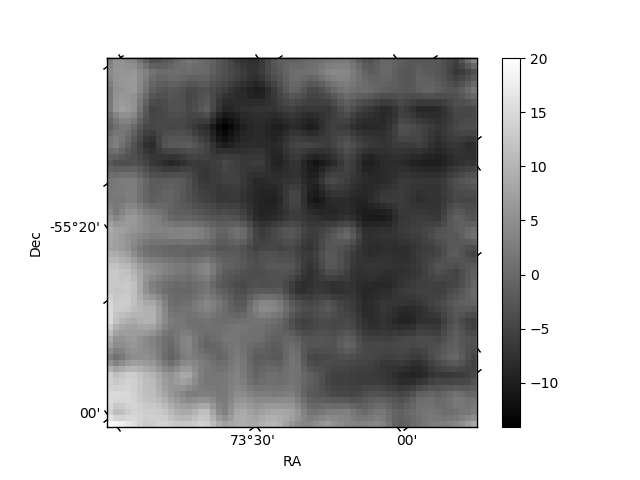
Quadrant B |
|---|---|---|---|
| Quadrant D | 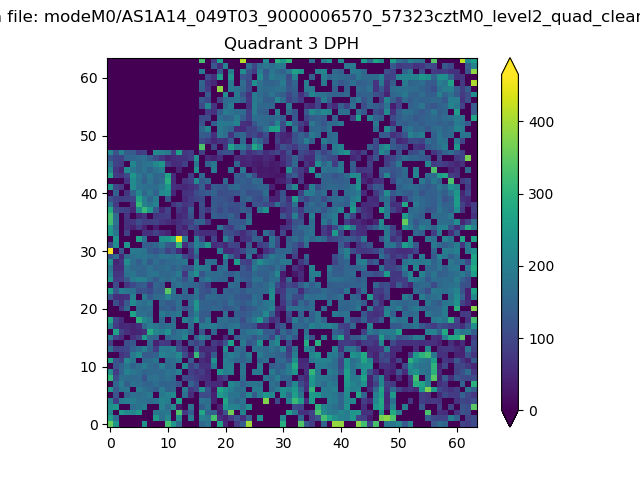 |
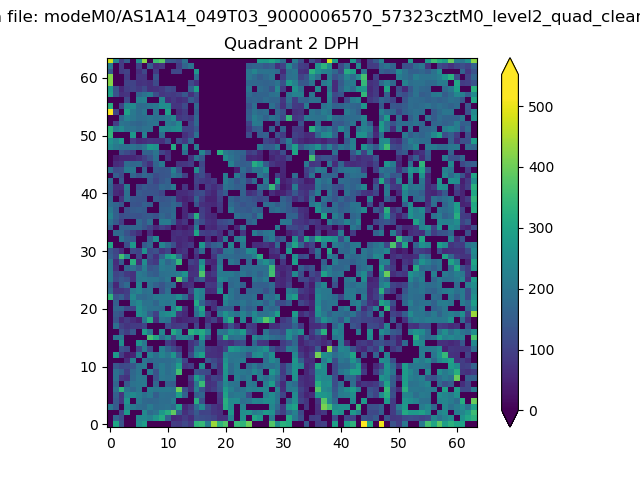 |
Quadrant C |
| Plot type | Count rate plots | Images |
|---|---|---|
| Comparison with Poisson distribution Blue bars denote a histogram of data divided into 1 sec bins. Red curve is a Poisson curve with rate = median count rate of data. |
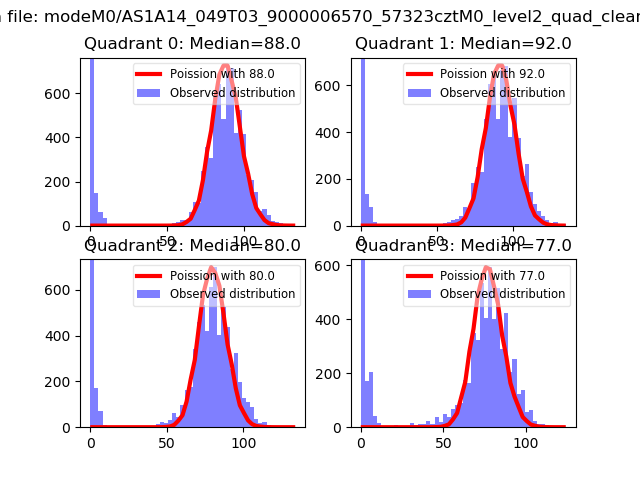 |
 |
| Quadrant-wise count rates Data is divided into 100 sec bins |
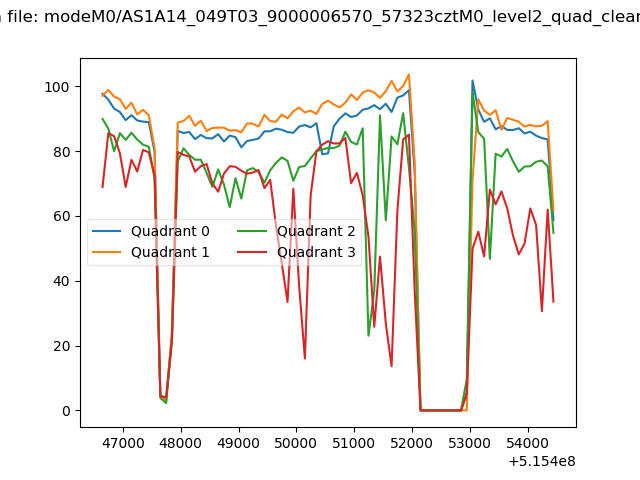 |
|
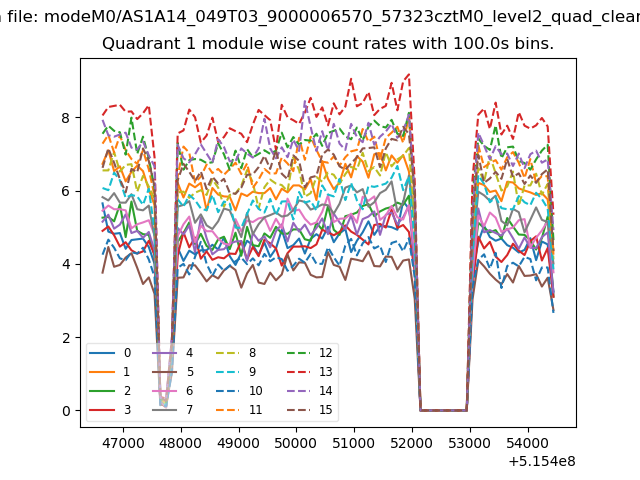
| Module-wise count rates for Quadrant A Data is divided into 100 sec bins |
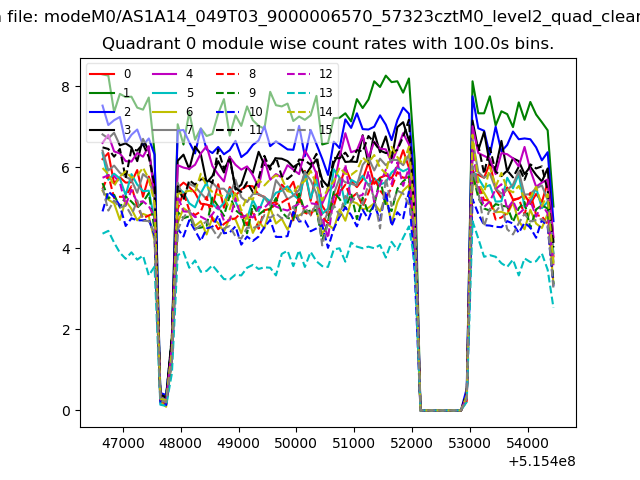 |
 |
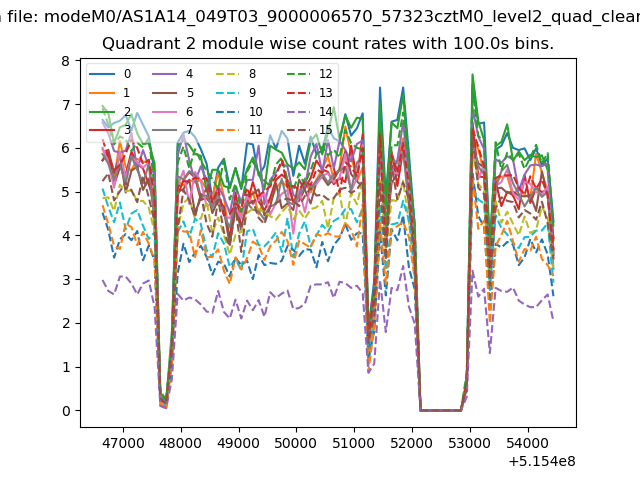
| Module-wise count rates for Quadrant B Data is divided into 100 sec bins |
 |
 |
| Module-wise count rates for Quadrant C Data is divided into 100 sec bins |
 |
 |
| Module-wise count rates for Quadrant D Data is divided into 100 sec bins |
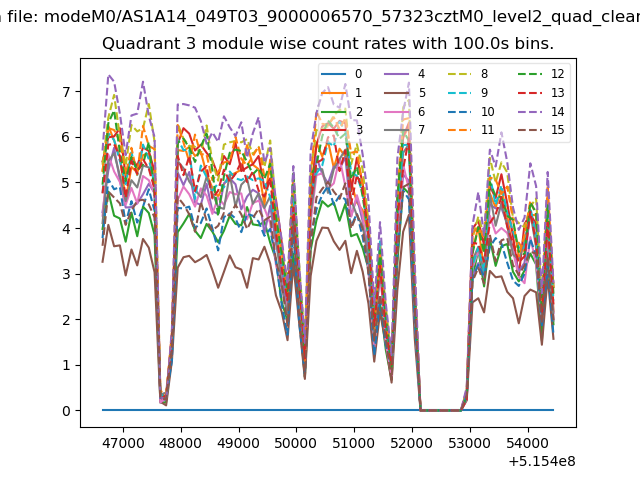 |
 |
| Parameter | Plot |
|---|---|
| CZT HV Monitor | 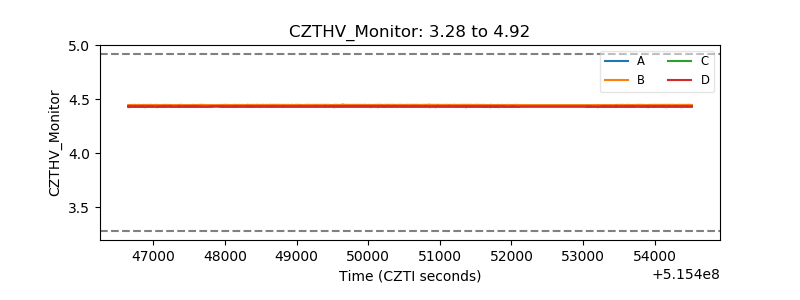 |
| D_VDD | 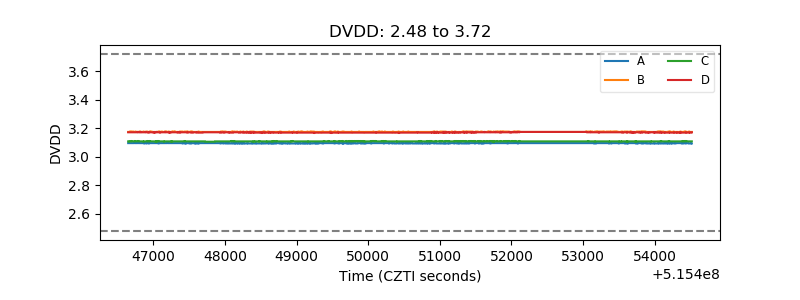 |
| Temperature 1 | 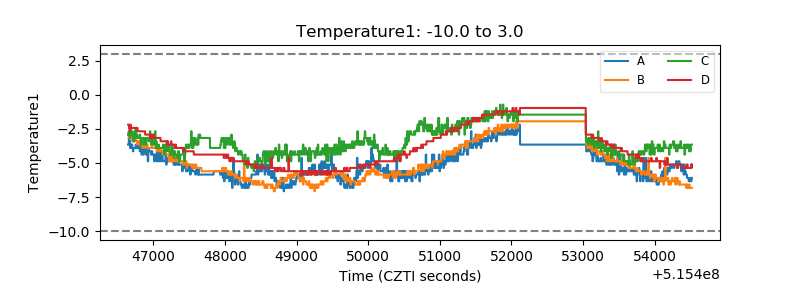 |
| Veto HV Monitor | 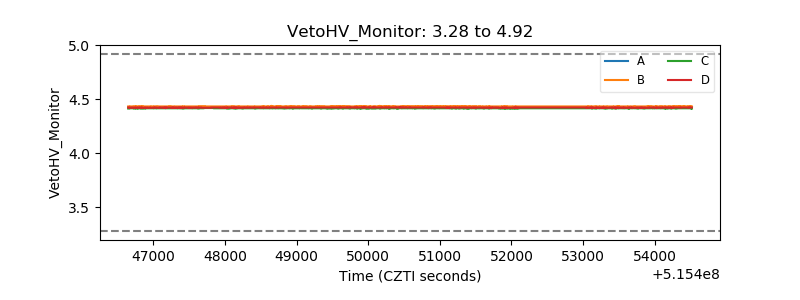 |
| Veto LLD | 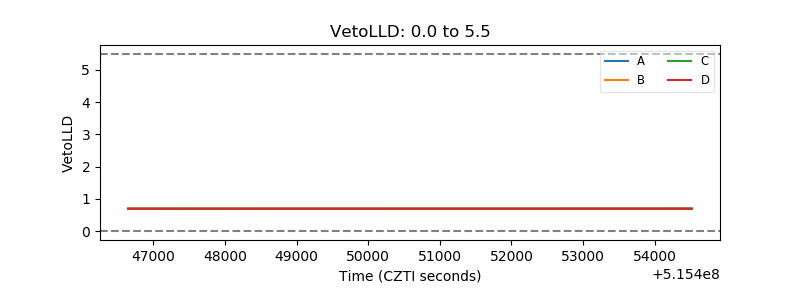 |
| Alpha Counter | 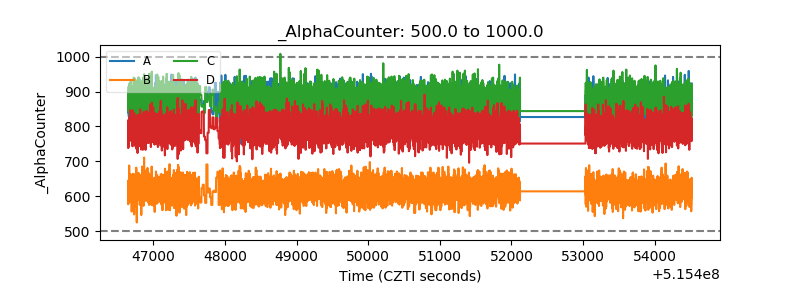 |
| _CPM_Rate | 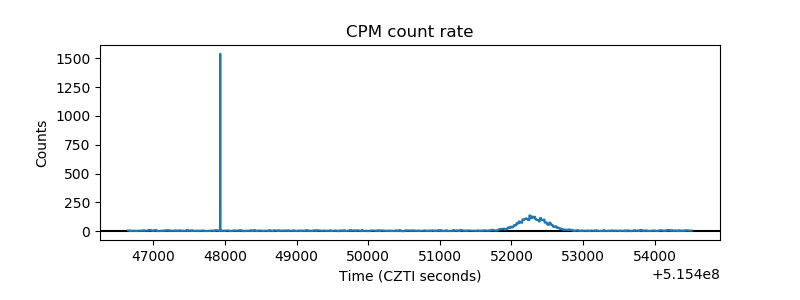 |
| CZT Counter | 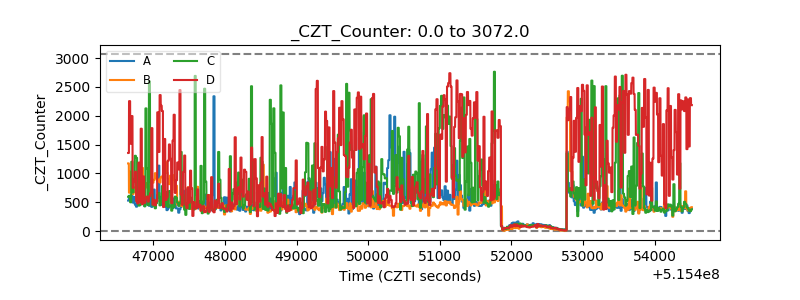 |
| +2.5 Volts monitor |  |
| +5 Volts monitor |  |
| _ROLL_ROT | 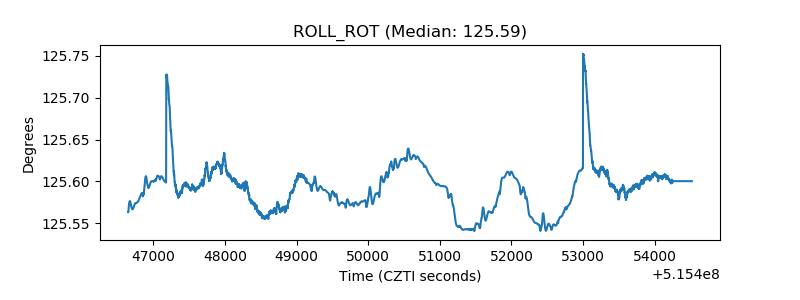 |
| _Roll_DEC | 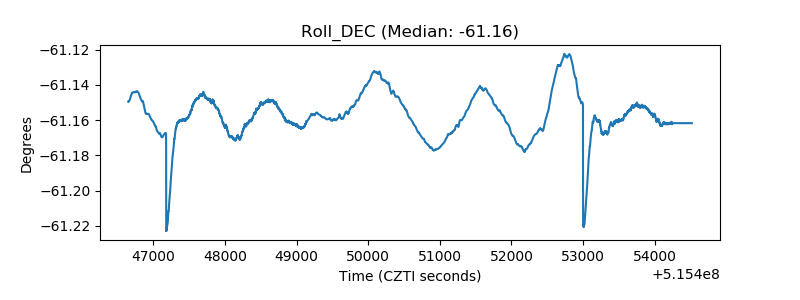 |
| _Roll_RA | 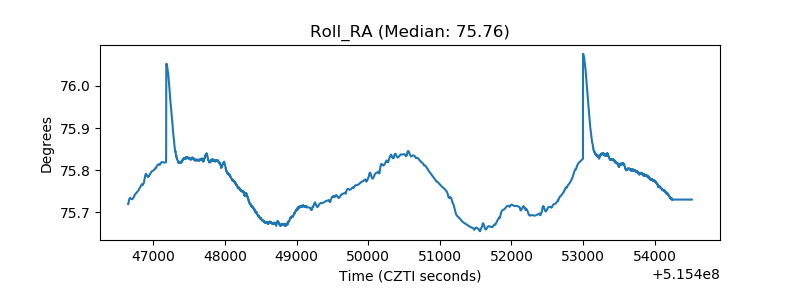 |
| Veto Counter | 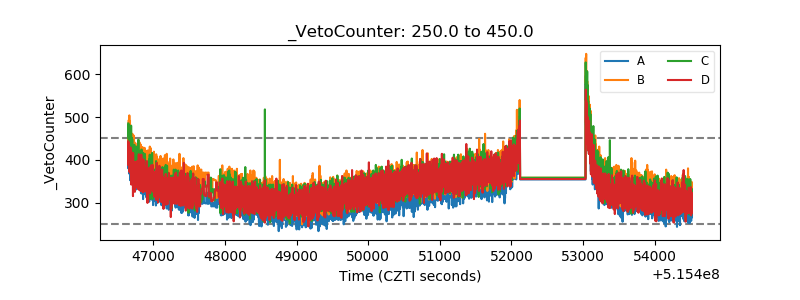 |