| Param | Original file | Final file |
|---|---|---|
| Filename | modeM0/AS1A14_049T03_9000006570_57324cztM0_level2.fits | modeM0/AS1A14_049T03_9000006570_57324cztM0_level2_quad_clean.evt |
| Size (bytes) | 546,667,200 | 86,832,000 |
| Size | 521.3 MB | 82.8 MB |
| Events in quadrant A | 3,445,460 | 584,815 |
| Events in quadrant B | 3,281,733 | 624,807 |
| Events in quadrant C | 6,279,046 | 489,627 |
| Events in quadrant D | 6,693,530 | 448,488 |
| Mode M0 | |||
|---|---|---|---|
| Quadrant | BADHDUFLAG | Total packets | Discarded packets |
| A | 0 | 15432 | 1 |
| B | 0 | 14854 | 1 |
| C | 0 | 23580 | 1 |
| D | 0 | 24787 | 1 |
| Mode M9 | |||
|---|---|---|---|
| Quadrant | BADHDUFLAG | Total packets | Discarded packets |
| A | 0 | 4 | 0 |
| B | 0 | 4 | 0 |
| C | 0 | 4 | 0 |
| D | 0 | 4 | 0 |
| Mode SS | |||
|---|---|---|---|
| Quadrant | BADHDUFLAG | Total packets | Discarded packets |
| A | 0 | 140 | 0 |
| B | 0 | 140 | 0 |
| C | 0 | 140 | 0 |
| D | 0 | 140 | 0 |
| Quadrant | Total seconds | Saturated seconds | Saturation percentage |
|---|---|---|---|
| A | 6904 | 87 | 1.260139% |
| B | 6903 | 150 | 2.172968% |
| C | 6903 | 876 | 12.690135% |
| D | 6903 | 902 | 13.066783% |
Noise dominated data is calculated using 1-second bins in cleaned event files. If a bin has >2000 counts, and if more than 50% of those come from <1% of pixels, then it is considered to be noise-dominated and hence unusable.
| Quadrant | # 1 sec bins | Bins with >0 counts | Bins with >2000 counts | High rate bins dominated by noise | Noise dominated (total time) | Noise dominated (detector-on time) | Marked lightcurve |
|---|---|---|---|---|---|---|---|
| A | 7553 | 7175 | 6 | 6 | 0.08% | 0.08% | 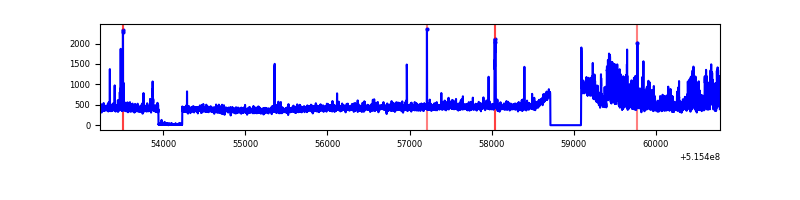 |
| B | 7552 | 7174 | 15 | 15 | 0.20% | 0.21% | 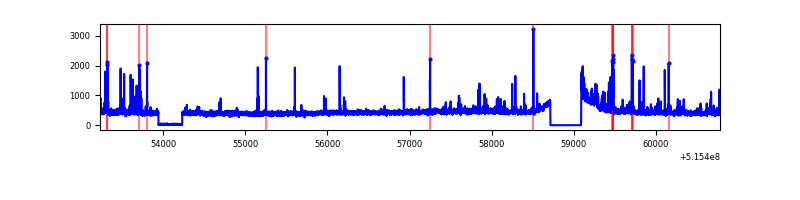 |
| C | 7552 | 7174 | 692 | 692 | 9.16% | 9.65% | 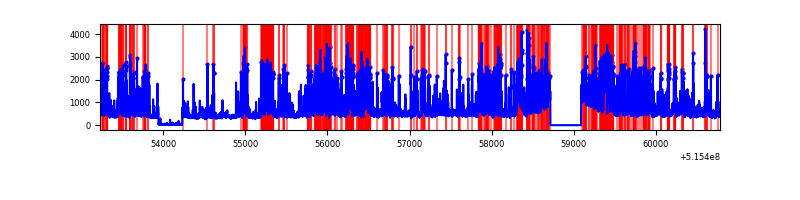 |
| D | 7552 | 7143 | 747 | 747 | 9.89% | 10.46% | 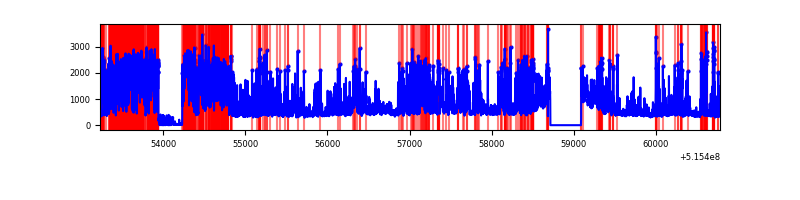 |
Top three noisy pixels from each quadrant. If the there are fewer than three noisy pixels in the level2.evt file, extra rows are filled as -1
| Pixel properties | Quadrant properties | ||||||
|---|---|---|---|---|---|---|---|
| Quadrant | DetID | PixID | Counts | Sigma | Mean | Median | Sigma |
| A | 0 | 12 | 481993 | 2609.21 | 746 | 726 | 184.4 |
| A | 3 | 245 | 30617 | 162.06 | 746 | 726 | 184.4 |
| A | 8 | 4 | 11957 | 60.89 | 746 | 726 | 184.4 |
| B | 7 | 252 | 115239 | 729.84 | 734 | 708 | 156.9 |
| B | 10 | 16 | 74416 | 469.69 | 734 | 708 | 156.9 |
| B | 5 | 185 | 60697 | 382.27 | 734 | 708 | 156.9 |
| C | 15 | 224 | 2962738 | 16008.33 | 682 | 675 | 185.0 |
| C | 14 | 254 | 472057 | 2547.56 | 682 | 675 | 185.0 |
| C | 12 | 252 | 59041 | 315.44 | 682 | 675 | 185.0 |
| D | 3 | 224 | 2856524 | 14517.44 | 690 | 655 | 196.7 |
| D | 2 | 31 | 343074 | 1740.64 | 690 | 655 | 196.7 |
| D | 7 | 96 | 210429 | 1066.36 | 690 | 655 | 196.7 |
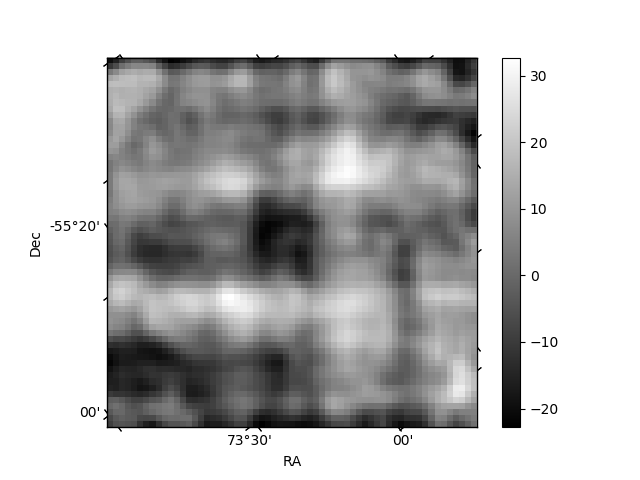
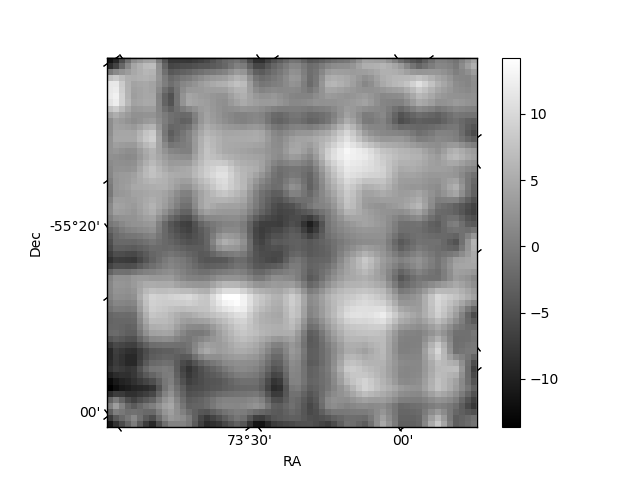
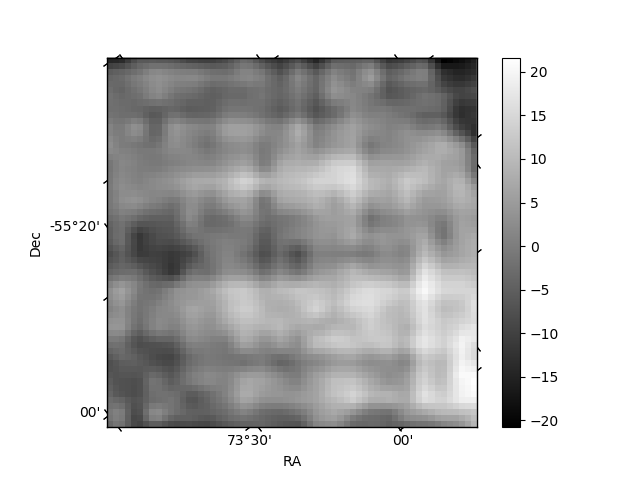
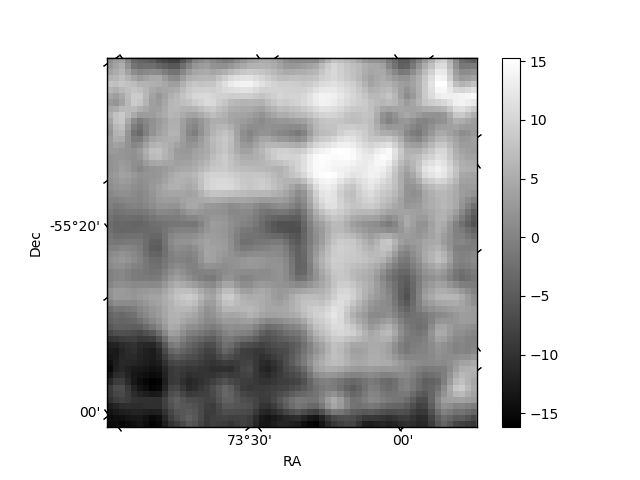
Histogram calculated using DETX and DETY for each event in the final _common_clean file
| Quadrant A | 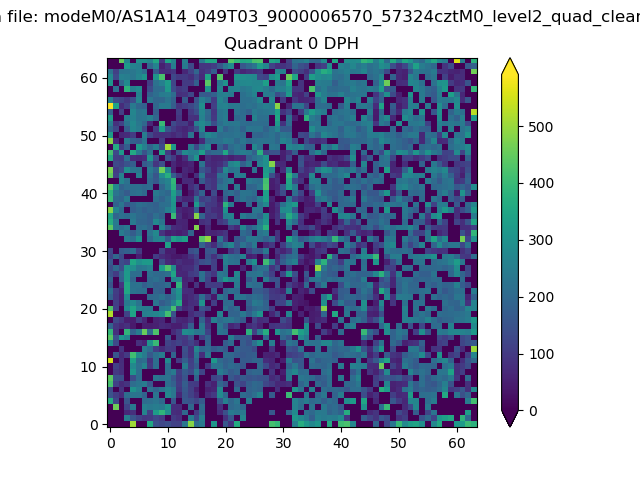 |
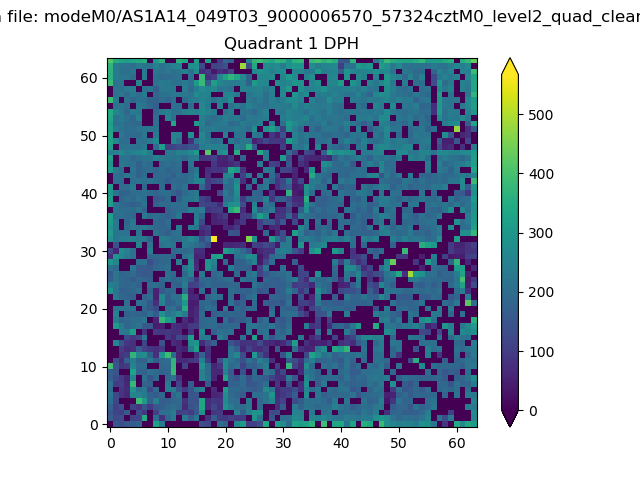 |
Quadrant B |
|---|---|---|---|
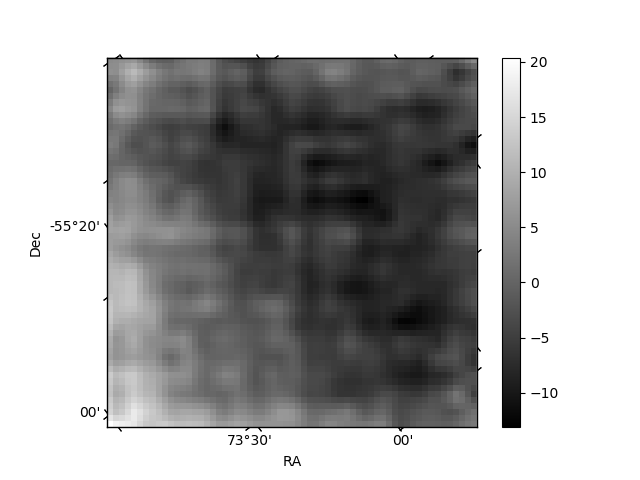
| Quadrant D | 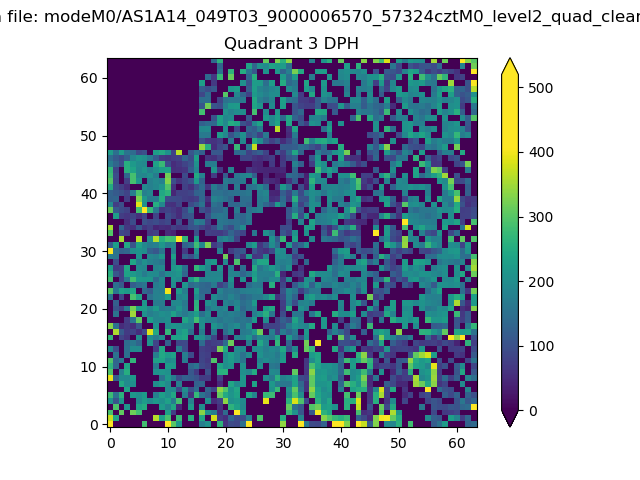 |
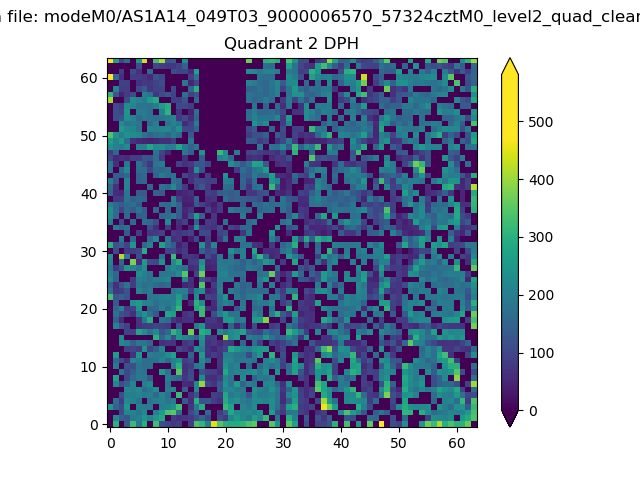 |
Quadrant C |
| Plot type | Count rate plots | Images |
|---|---|---|
| Comparison with Poisson distribution Blue bars denote a histogram of data divided into 1 sec bins. Red curve is a Poisson curve with rate = median count rate of data. |
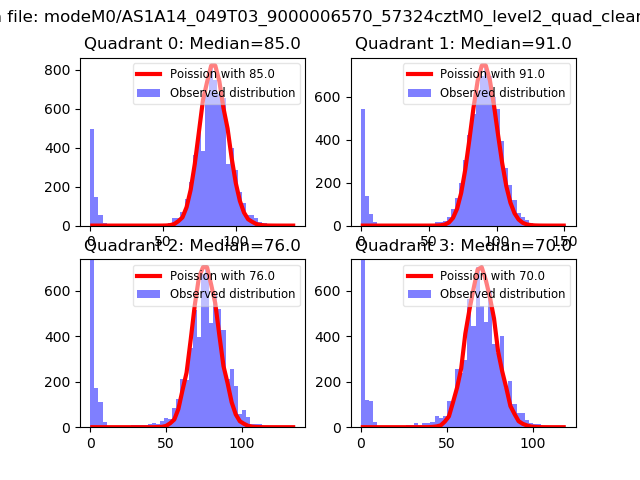 |
 |
| Quadrant-wise count rates Data is divided into 100 sec bins |
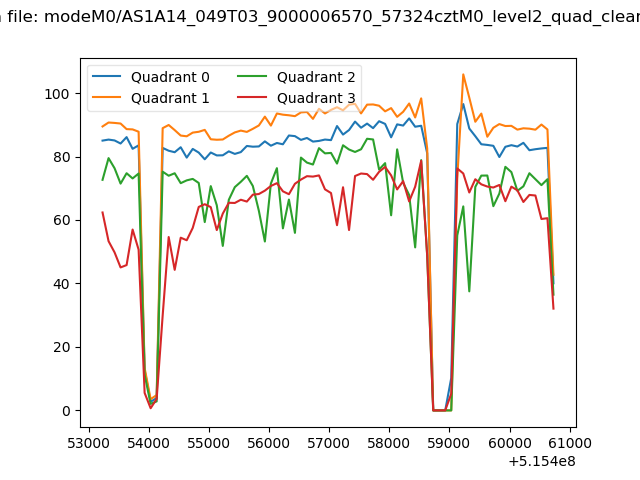 |
|
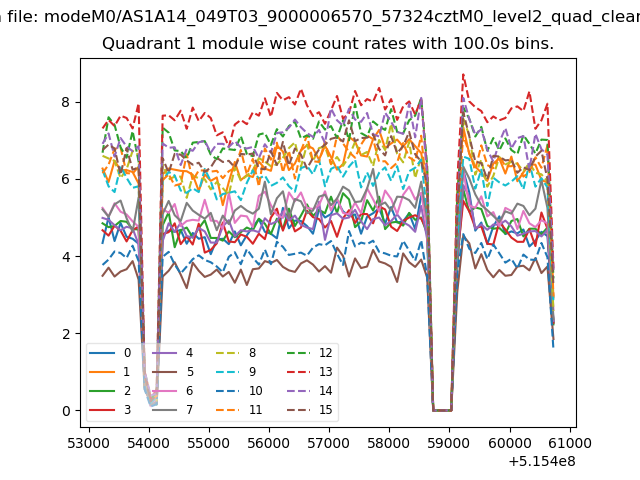
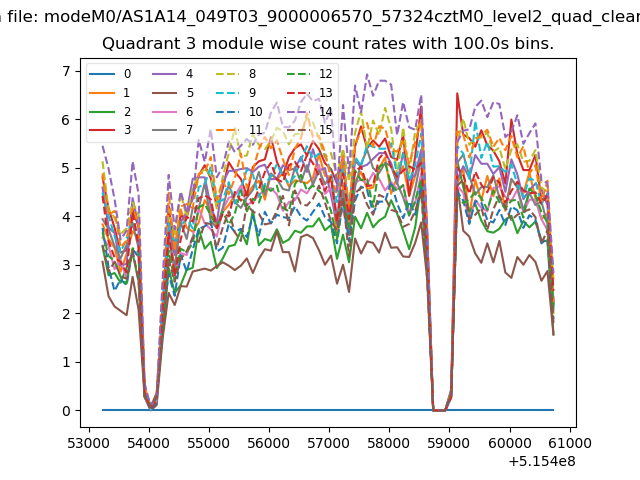
| Module-wise count rates for Quadrant A Data is divided into 100 sec bins |
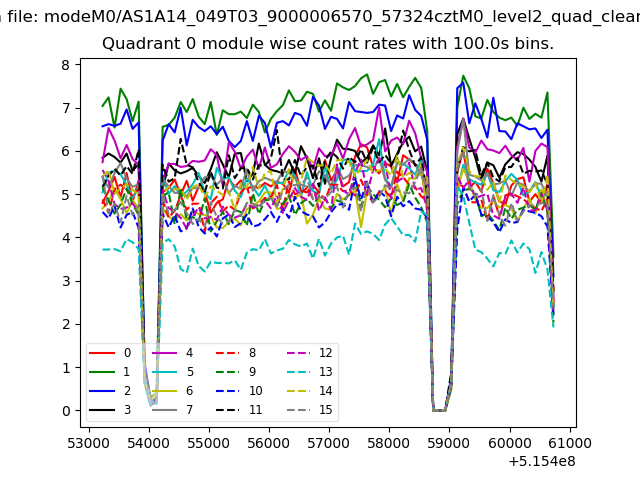 |
 |
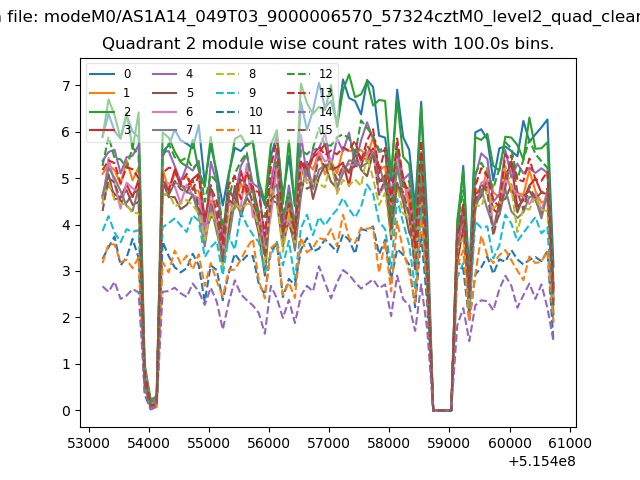
| Module-wise count rates for Quadrant B Data is divided into 100 sec bins |
 |
 |
| Module-wise count rates for Quadrant C Data is divided into 100 sec bins |
 |
 |
| Module-wise count rates for Quadrant D Data is divided into 100 sec bins |
 |
 |
| Parameter | Plot |
|---|---|
| CZT HV Monitor | 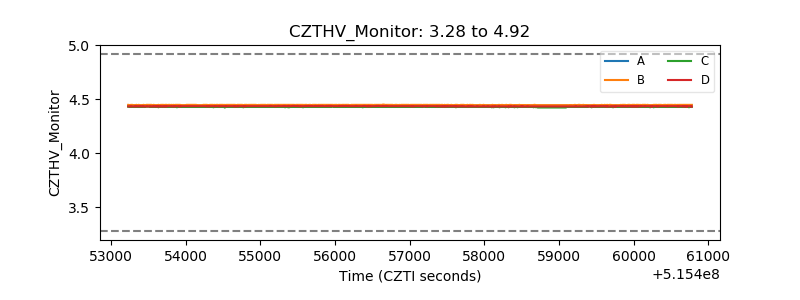 |
| D_VDD | 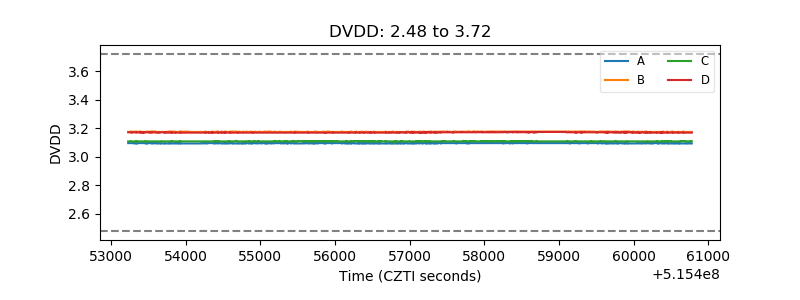 |
| Temperature 1 | 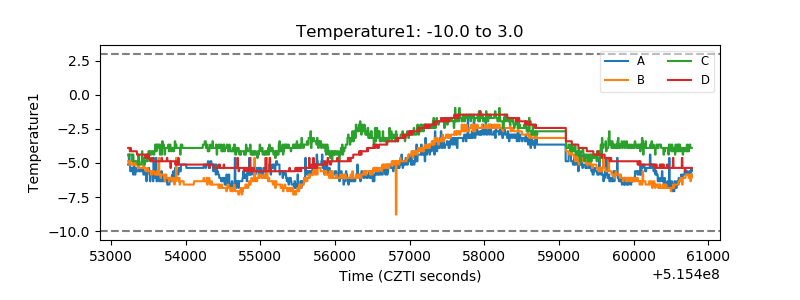 |
| Veto HV Monitor | 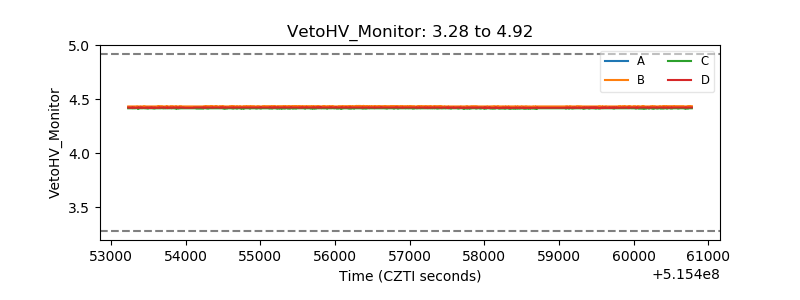 |
| Veto LLD | 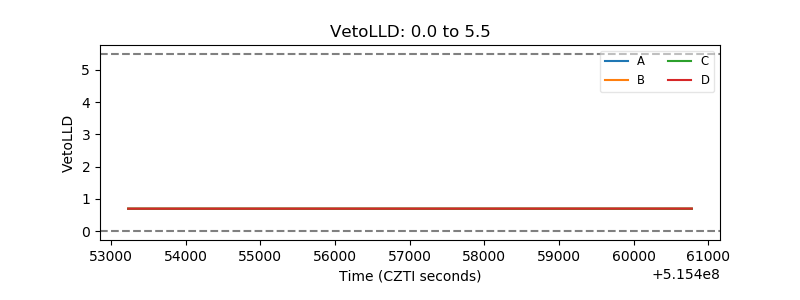 |
| Alpha Counter | 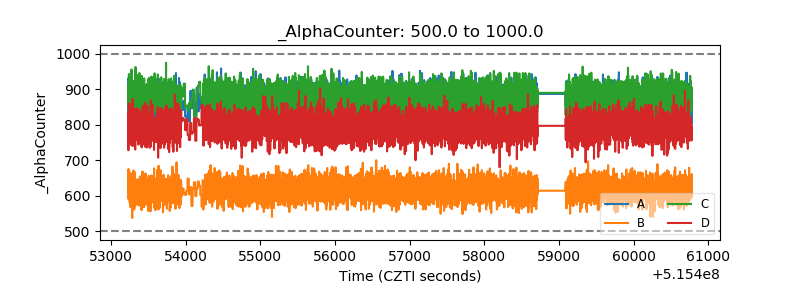 |
| _CPM_Rate | 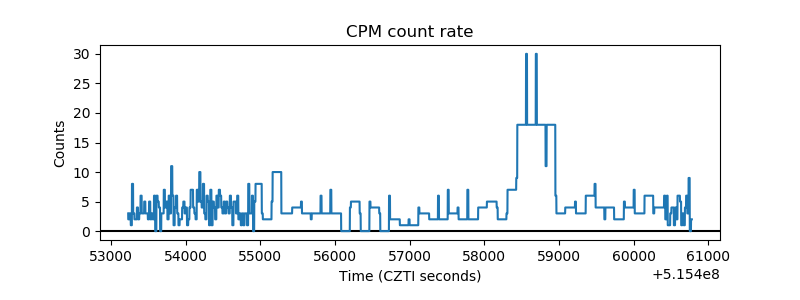 |
| CZT Counter | 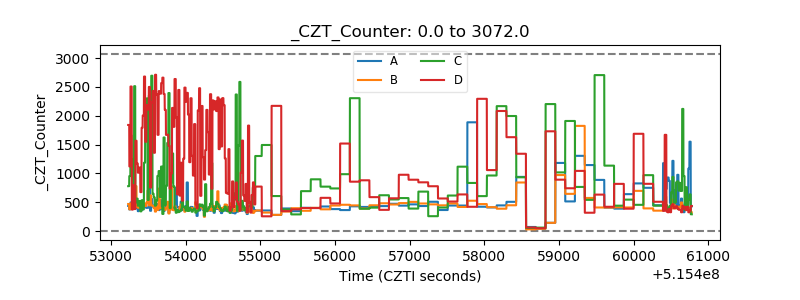 |
| +2.5 Volts monitor |  |
| +5 Volts monitor |  |
| _ROLL_ROT | 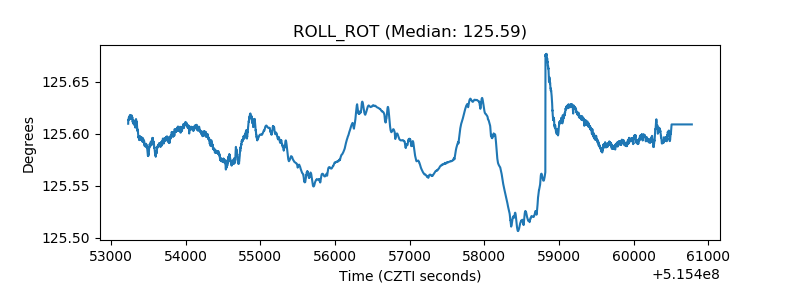 |
| _Roll_DEC | 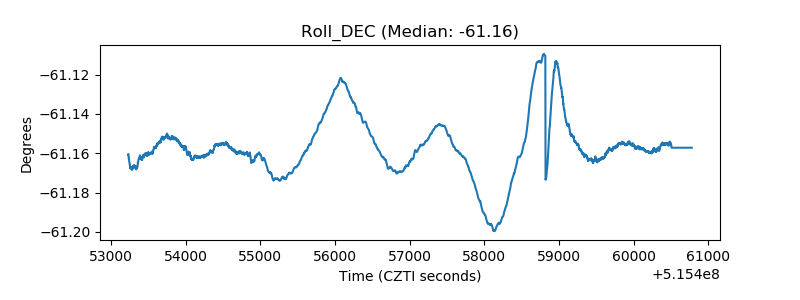 |
| _Roll_RA | 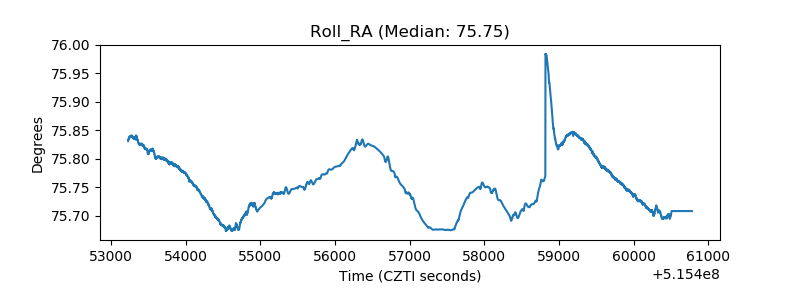 |
| Veto Counter | 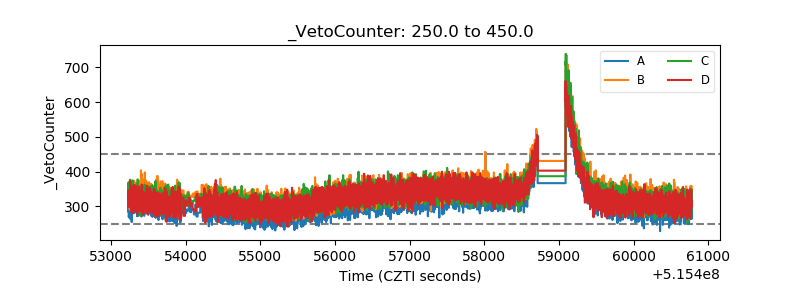 |